
Statistics on payments and securities trading, clearing and settlement – data for 2008
- In 2008, the total number of non-cash payments, using all types of instruments, increased by 5% to 78 billion in the EU. Card payments accounted for almost 40% of all transactions in 2008, while credit transfers and direct debits accounted equally for most of the remainder. [1]
- The corresponding total value of transactions decreased by around 18% to €259 trillion. Credit transfers accounted for almost 90% of the total in 2008, while the remainder was generated primarily by direct debits (6%) and cheques (3%). The average value per transaction decreased by 20% to €3,315, partially due to exchange rate effects.
- The total number of payment cards (i.e. cards with a debit, credit or delayed debit function) was just under 727 million in 2008. This represented around 1.5 payment cards per person in the EU, and is an increase of 5% compared with 2007.
- The total value of euro-denominated currency in circulation [2] increased in 2008, as compared to 2007, by 11% to 785 billion; of which over 97% was accounted for by banknotes. Around 35% of the value of all banknotes in circulation in 2008 were €500 denominations (compared with 32% in 2007), followed by the €50 denominations (32%) and €100 denominations (18%).
- The number of automated teller machines (ATMs) available to the public increased by around 6% to 400,000 ATMs. This means that there are over 850 ATMs per million inhabitants in the EU.
- The number of delivery instructions processed by central securities depositories reached 346 million, corresponding to a value of € 831 trillion. Compared with the data for 2007, this means a decrease of 8% of the number and a fall 9% of their value.
Today the European Central Bank (ECB) is publishing statistics for 2008 on payments and securities trading, clearing and settlement (hereafter “payment statistics”). Payment statistics comprise a comprehensive set of indicators on the use of and access to payment instruments and terminals by the public (i.e. individuals and firms), as well as the volumes and values of transactions processed through national and pan-European payment systems. [3] Payments statistics are published for each European Union (EU) Member State, in addition to euro area aggregates and comparative statistics.
Selected payment trends in the EU over the nine years from 2000 to 2008, the period for which harmonised statistics are available, are presented below.
Payment instruments
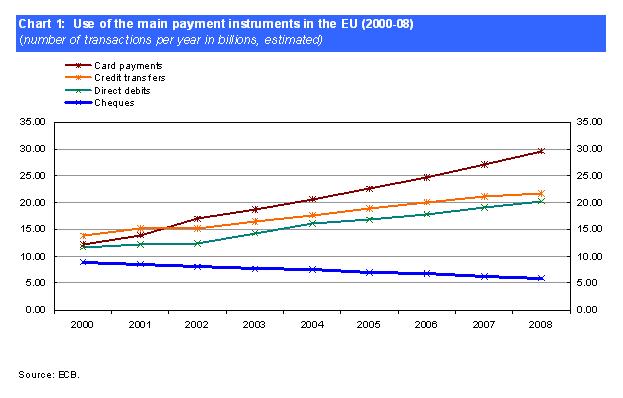
The number of transactions carried out with all payment instruments (excluding cash transactions) grew by 5% in 2008. This is below the 6% per year between 2000 and 2008. The latter trend was primarily driven by the strong average growth rate of 10% per year for card payments over this period. The use of credit transfers and direct debits also grew, albeit at more modest average rates of 5% and 6% per year respectively. By contrast, transactions using cheques declined by an average of 5% per year over the nine-year period.
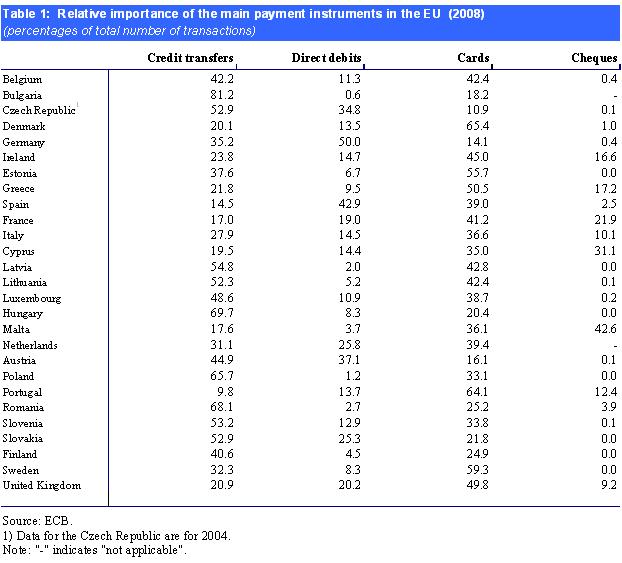
As can be seen in Table 1, the use of each of the main payment instruments in 2008 varied significantly across countries.
Retail payment systems
Retail payment systems in the EU mainly handle payments by the public, with a relatively low value and urgency, concerning e.g. credit transfers, direct debits and cheques.
In the EU as a whole, there were 40 retail payment systems [4] in 2008, serving a total population of approximately 500 million. In that year, these systems processed 37.5 billion transactions, with a total value of €28.9 trillion. Just under a half (19) of these systems were located in the euro area, serving a total population of 322 million. These euro area systems processed 26.0 billion transactions in 2008 (i.e. 68% of the EU total) with a value amounting to €17.2 trillion (i.e. 59% of the EU total).
Compared with one year earlier, there was a net increase of five systems in the euro area and of one system in the rest of the EU. The increases in the number of transactions in both the EU and the euro area were 3% and 2%, respectively, while the value of transactions remained generally unchanged.
There is a notable degree of concentration in the retail payment systems of the EU. In 2008, the largest system accounted for just over one third (12.5 billion) of all EU transactions processed. Furthermore, the five largest retail systems together processed over 70% of all EU transactions. Four out of these five systems were located in the euro area.
Central securities depositories
Central securities depositories (CSDs) are entities which hold and administer securities or other financial assets, hold issuance accounts and enable transactions to be processed by book entry.
In 2008 there were 39 CSDs operating in the EU, of which 18 were located in the euro area. 346 million delivery instructions were processed by CSDs in the EU, with a total value of € 831 trillion. Compared with 2007, this represents a decrease of 8% in terms of the number of transactions and of 9% in terms of their value.
A notable degree of concentration remains, with the five largest CSDs accounting for 81% of the total value of the delivery instructions processed in the market. There is somewhat less concentration in terms of volume, with the five largest CSDs representing 62% of the total volume of delivery instructions processed.
The Eurosystem also monitors developments in the securities trading and clearing infrastructure, given its close relationship with the settlement of securities in CSDs. Therefore, in addition to the statistics from CSDs, the ECB is also releasing today statistics from central counterparties (clearing) and securities exchanges (trading).
Additional information
This press release contains only a small sub-set of the payment and settlement statistics compiled every year by the ECB. The full set of statistics can be downloaded from the Statistical Data Warehouse (SDW) on the ECB’s website at http://sdw.ecb.europa.eu.
The SDW contains payment statistics for the period 2000-08, statistics on securities settlement systems covering 2005-08, and statistics on central counterparties (i.e. securities clearing) and on stock exchanges (i.e. securities trading) covering 2006-08.
In its “Reports” section, available at http://sdw.ecb.europa.eu/reports.do?node=100000760, the SDW also contains pre-formatted tables with payment statistics for the last five years. The data are presented in the same format as in the former “Blue Book Addendum”, which is available at http://www.ecb.europa.eu/stats/payments/html/stopped.en.html.
For detailed methodological information, including a list of all data definitions, see the “Statistics” section of the ECB’s website at http://www.ecb.europa.eu/stats/payments/paym/html/index.en.html
-
[1] In order to compute more harmonised EU and euro area aggregates, selected series for Germany, which were subject to a structural break in 2007, have been estimated for the years 2000-2006.
-
[2] Data on euro-denominated banknotes and coins are published on a monthly basis and available from the ECB’s Statistical Data Warehouse: http://sdw/browse.do?node=5274892.
-
[3] These results are strongly influenced by the inclusion of book-entry transactions in Germany in the statistics as from 2007.
-
[4] Including the STEP2 XCT Service, STEP2 ICT Service and STEP2 SCT Service.
Banco Central Europeo
Dirección General de Comunicación
- Sonnemannstrasse 20
- 60314 Frankfurt am Main, Alemania
- +49 69 1344 7455
- media@ecb.europa.eu
Se permite la reproducción, siempre que se cite la fuente.
Contactos de prensa