

- SPEECH
Everything everywhere all at once: responding to multiple global shocks
Speech by Fabio Panetta, Member of the Executive Board of the ECB, at a panel on “Global shocks, policy spillovers and geo-strategic risks: how to coordinate policies” at The ECB and its Watchers XXIII Conference
Frankfurt am Main, 22 March 2023
We are still going through a sequence of global shocks that are disrupting economies around the world. In just three years we have seen a pandemic, severe supply chain disruptions, a war, an energy crisis and now tensions in banking markets.
The resulting swings in activity and prices have presented policymakers with the challenge of identifying turning points in their underlying dynamics at a time of disruption in the economy and the financial sector. Inevitably, we need to navigate between the risk of underreacting – which could prolong the inflationary effects of these shocks – and that of overreacting, which could turn volatility into instability.
There are no simple solutions to these complex problems.
We need to adapt our policies to the overlapping effects of the shocks, to geopolitical developments, to the risk of financial amplification and to spillovers from other jurisdictions.
Three principles can help guide our monetary policy decisions in this context.
First, given the prevailing uncertainty and the ground we have already covered in tightening our policy, we must remain fully data-dependent and avoid pre-committing to any specific policy path. We should be guided by our reaction function, taking stock of inflation developments, underlying inflation dynamics and the strength of monetary policy transmission, also given the possible risks for the medium term outlook stemming from both the real economy and the financial sector.[1] This way we can ensure that we calibrate our measures in the light of the incoming information.[2]
Second, we need to monitor the effects of our measures and the way our different instruments interact with each other. In particular, we should continuously assess the combined effect of raising rates and reducing the size of our balance sheet.[3] The experience of other jurisdictions suggests that abrupt adjustments could make it more difficult for investors to adapt to evolving market conditions.
We need to maintain our disinflationary stance until we see convincing signs that inflation is returning to our target, in line with the “separation principle”: delivering the appropriate policy stance should not come at the cost of impairing its transmission.
And third: given the global nature of the shocks we are facing, we need to consider how they are transmitted across markets and economies as well as the potential spillovers from policies adopted abroad. But we should remain focused on our primary mandate of ensuring price stability in the euro area, without being overly conditioned by other jurisdictions.[4]
I will start by illustrating the global shocks and the uncertainty they create. I will then turn to the policy response to these shocks and their spillovers across jurisdictions. And I will outline what this means for our monetary policy in the current environment.
Global shocks and uncertainty
Over the past three years we have faced considerable uncertainty from both domestic and global shocks, complicating the policy diagnosis and increasing the risks of either underreacting or overreacting.
Global shocks, their pass-through and their unwinding
A major source of uncertainty surrounding both inflation and economic activity relates to the pass-through of global shocks and their unwinding. For example, the unprecedented sequence of domestic and global shocks makes it difficult to distinguish supply-demand imbalances triggered by the pandemic and the energy crisis from persistent, self-sustained inflationary dynamics.
Pandemic-related shocks
The reopening of the economy after the pandemic gave a sudden boost to demand (Chart 1) at a time when supply disruptions had not yet been resolved, leading to persistent bottlenecks. Firms reacted by building up inventories and hoarding labour, fuelling inflationary pressures. As a result, both demand and supply contributed to inflation in 2022.
Chart 1
Evolution of real GDP and private consumption in the euro area and the United States
(index: Q4 2019 = 100)

Sources: Eurostat, FRED and ECB staff calculations.
Note: NPISH stands for “non-profit institutions serving households”.
The boost to activity from the reopening is now fading. Supply bottlenecks have largely faded out[5] (Chart 2) and firms are starting to run down their inventories (Chart 3). This should dampen price pressures.
Chart 2
Easing of supply chain bottlenecks
(diffusion indices)
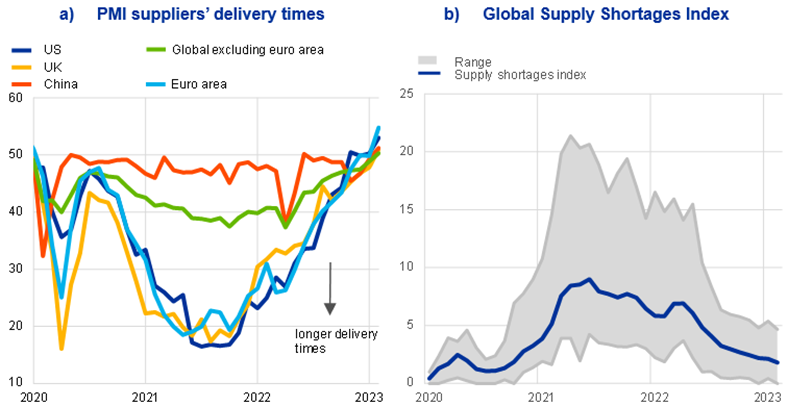
Sources: S&P Global, Markit and ECB staff calculations.
Notes: The Global Supply Shortage Index measures how many selected items have been in short supply against their long-run average for each month. The long-run average refers to value 1 of the index. The shaded area refers to the 5th-95th percentile range across 20 items (e.g. chemicals, electrical items, packaging, steel and textiles). The latest observations are for February 2023.
Chart 3
Inventory-to-GDP ratio and related survey indicators in the euro area
(standard deviation from historical (1999-2019) mean)

Sources: Eurostat (inventory investment-to-GDP ratio), S&P Global (PMI stocks of purchases and finished goods), European Commission (adequacy of stocks) and ECB calculations.
Note: The latest observations are for the fourth quarter of 2022 for the inventory investment-to-GDP ratio and the first quarter of 2023 for PMI stocks and adequacy of stocks.
The energy crisis
The energy crisis has had similar effects.[6] The sharp increase in wholesale energy and commodity prices has raised not only energy and food inflation but also – indirectly – core goods and services inflation (Chart 4).
Chart 4
Contributions of energy-sensitive components to goods and services inflation in the euro area
(annual percentage changes and percentage point contributions)

Sources: Eurostat and ECB staff calculations.
Notes: The term “energy-sensitive component” reflects items with a share of energy in direct costs above the average share of energy across services items (panel a) and non-energy industrial goods (NEIG) items (panel b). The latest observations are for February 2023.
These effects are starting to be reabsorbed. Lower energy and commodity prices have translated into lower energy inflation (Chart 5). And they should eventually pass through to food and core inflation – consistent with the easing in pipeline price pressures (Chart 6). This is compressing medium-term consumer inflation expectations[7], and might temper catch-up wage demands. But how quickly these effects will be reflected in the inflation data is uncertain. And concerns about inflation persistence[8] make projecting core inflation particularly challenging.
Chart 5
Headline inflation and components in the euro area and the United States
(annual percentage changes and percentage point contributions)
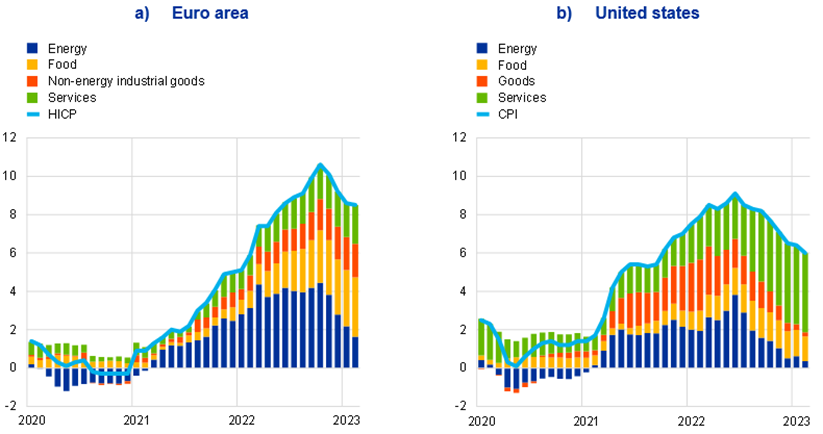
Sources: Eurostat, US Bureau of Labor Statistics and ECB calculations.
Note: The latest observations are for February 2023.
Chart 6
Pipeline pressures and input/output prices
(panel a): annual percentage changes; panel b): diffusion index)
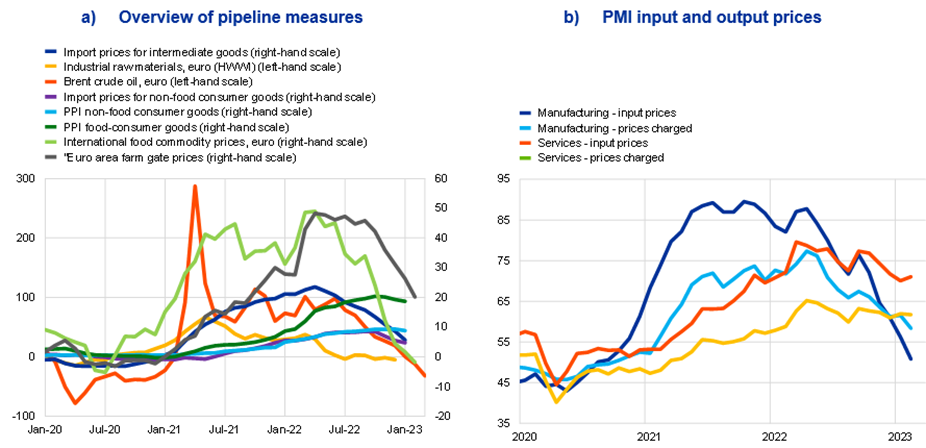
Sources: panel a): Eurostat and Refinitiv and Hamburg Institute of International Economics (HWWI), panel b): Markit.
Notes: Panel a): For Brent crude oil in euro, the monthly value represents the average of the data available (working days up to the day of the update). The latest observations are for 15 March 2023 for Brent crude oil in euro, February 2023 for euro area farm gate prices and international food commodity prices and January 2023 for the other items. Panel b): The latest observations are for February 2023.
The risk of inflation becoming entrenched
The unwinding of inflationary pressures has triggered concerns about the risk of second-round effects in the form of a de-anchoring of inflation expectations or a wage-price spiral, especially in view of the tight labour market conditions in advanced economies (Chart 7).[9]
Chart 7
Labour markets are still tight
(panel a): percent; panel b): annual percentage changes)
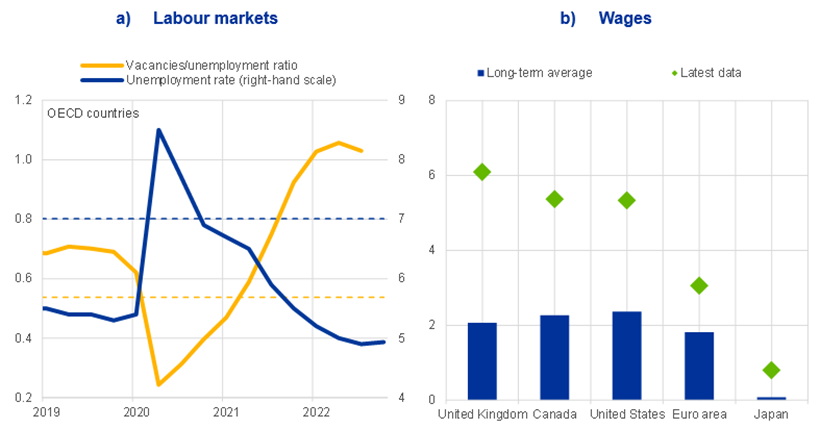
Sources: OECD, Haver and ECB calculations.
Notes: Panel a): the OECD aggregate for the vacancy ratio is based on the United States, United Kingdom, Japan, South Korea, euro area (excluding Italy), Canada, Sweden, Switzerland, Poland, Romania, Czech Republic, and Hungary. The dashed lines refer to long-term averages (2010-2019). The latest observations are for the third quarter of 2022 for the vacancy ratio and the fourth quarter of 2022 for the unemployment rate. Panel b): wage growth series are not harmonised, so comparability across country data is limited. Wages refer to average hourly wages for the United States and Canada and to average weekly regular earnings (excluding bonuses) for the United Kingdom. For the euro area and Japan, wage data track negotiated and scheduled wages respectively. The long-term average refers to 2010-2019. The latest observations are for February 2023 for the United States and Canada, January 2023 for Japan and the United Kingdom and December 2022 for the euro area.
In the euro area, medium-term inflation expectations remain anchored at our target. This reflects the ECB’s clear commitment to stamp out inflation. As President Lagarde stated this morning, “the public can be certain about one thing: we will deliver price stability, and bringing inflation back to 2% over the medium term is non-negotiable.”[10]
Robust wage growth over the next three years is also consistent with our projections, which indicate that inflation will gradually fall to around 3% by the end of 2023 and around 2% by the middle of 2025.
The risk is rather that wage and price-setting dynamics could make high inflation stickier and eventually feed into inflation expectations. Wages are still accelerating, and we cannot rule out a scenario in which stronger and persistent wage increases take hold. This risk needs to be closely monitored.
Opportunistic behaviour by firms could also delay the fall in core inflation. In fact, unit profits contributed to more than half of domestic price pressures in the last quarter of 2022 (Chart 8).[11] In some industries, profits are increasing strongly (Chart 9) and retail prices are rising rapidly, in spite of the fact that wholesale prices have been decreasing for some time. This suggests that some producers have been exploiting the uncertainty created by high and volatile inflation[12] and supply-demand mismatches[13] to increase their margins, raising prices beyond what was necessary to absorb cost increases. We should monitor the risk that a profit-price spiral could make core inflation stickier.
Chart 8
GDP deflator at market prices
(annual percentage changes; percentage point contributions)
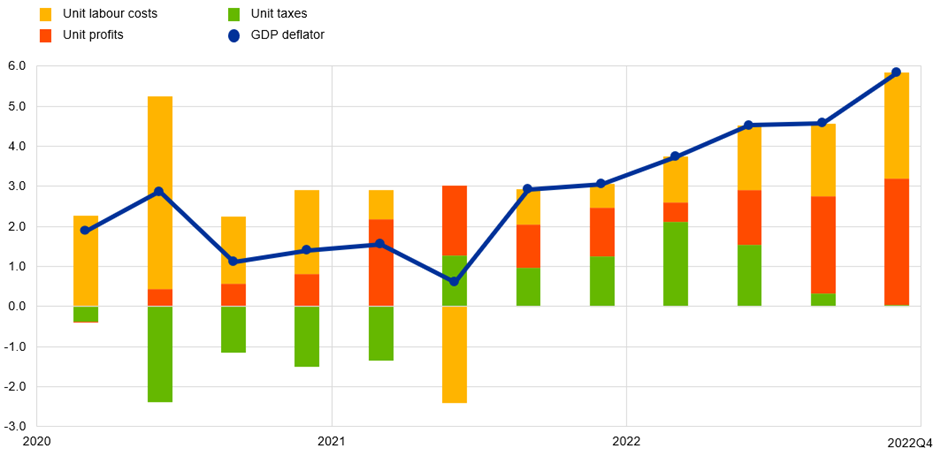
Sources: Eurostat and ECB calculations.
Note: The latest observations are for the fourth quarter of 2022.
Chart 9
Sectoral wage and profit developments
(left-hand panel: percentage change from Q4 2019 to Q4 2022; right-hand panel: gross operating surplus over real value added, level)
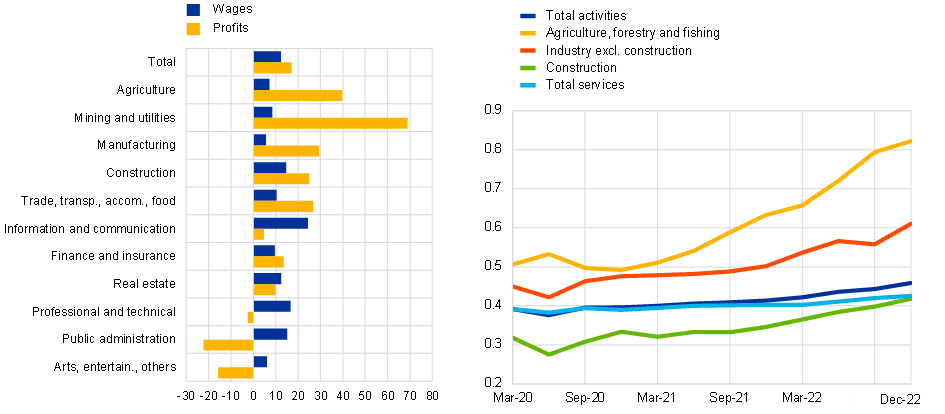
Sources: Eurostat and ECB calculations.
Notes: Wages refer to compensation of employees, and profits to gross operating surplus. Income for self-employed people is included in wages. The latest observations are for the fourth quarter of 2022.
Looking ahead, a normalisation of profits would help bring down core inflation and reduce the risk of second-round effects, as wage demands could be accommodated without leading to an increase in prices in response.
Global supply-demand mismatches
Uncertainty about global supply and demand conditions is still high – and is now exacerbated by the financial tensions that have recently emerged.
Demand is showing signs of weakness in both the United States and the euro area.[14]
In China, the end of zero-COVID policies has been followed by a downturn and then a rebound, which could still be slowed down by headwinds emanating from the property market. The reopening will have an ambiguous overall effect on global inflation: it could dampen prices in sectors where China is a net exporter – such as goods – and increase prices in sectors where it is a net importer, such as commodities.[15]
The global policy response and its spillovers
A second source of uncertainty relates to the global policy responses to the shocks, and the spillovers from these responses.
We have already seen clear examples of these spillovers. For instance, the outsized fiscal stimulus implemented in the United States in response to the pandemic boosted the demand for durable goods (Chart 10) but led to a negative supply shock in other countries.[16] In the euro area, this supply shock contributed to pushing up inflation and hit the economy at an early stage of its recovery.[17]
Chart 10
Individual consumption – durables and services
(panel a): index: Q1 2018 = 100; panel b): January 2018 = 100)
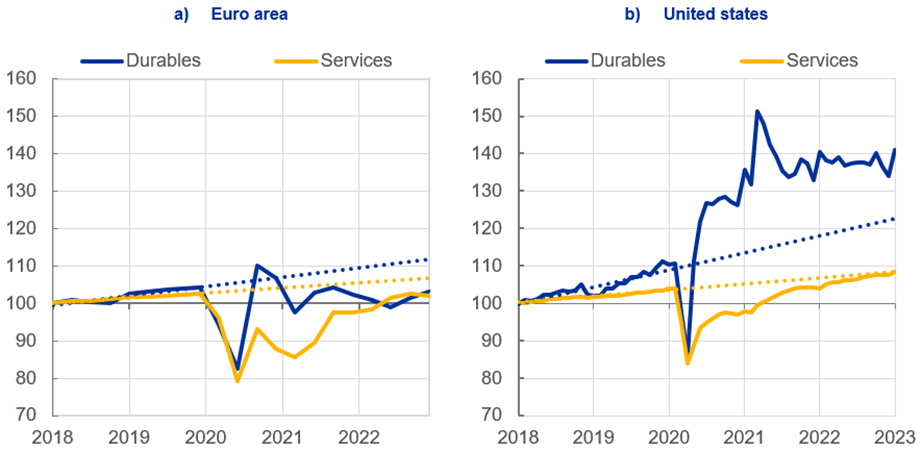
Sources: ECB and Federal Reserve System.
Notes: Dotted lines denote the linear trend (from the first quarter of 2018 to the fourth quarter of 2019). Durables and services for the euro area are approximated using a bottom-up aggregation of available country-level data.
We are now facing a simultaneous and rapid global tightening of financing conditions (Charts 11), which is creating financial and policy spillovers (Chart 12). For example, monetary tightening in the United States is also resulting in tighter financing conditions[18] in other jurisdictions, including the euro area.[19] This adds to the risk of overtightening if central banks do not factor in the feedback loops they create.[20]
Chart 11
Global tightening of financing conditions
(panel a): standardised indices; panel b): percentages of countries)

Sources: Panel a) Refinitiv Datastream and ECB staff calculations; Panel b): Haver and ECB staff calculations.
Notes: Panel a): Country-level indices are aggregated as a weighted average using GDP purchasing power parity percentage shares. An increase reflects loosening financial conditions. A decrease reflects tightening financial conditions. The latest observations are for 17 March 2023.
Panel b): The global “inflation surges” index shows the share of countries which, at time t, are experiencing contemporaneously (1) year-on-year inflation that is higher than the time t-1 and (2) year-on-year inflation that is above a certain threshold. In this case, the threshold is given by the average of the year-on-year inflation in the post-Volcker period, from the first quarter of 1984 to the fourth quarter of 2022. The global “rate hikes synchronisation” index is constructed using BIS data on policy rates set by central banks and shows the share of countries that are tightening at time t. Both the indices cover 30 countries across advanced economies and emerging market economies. Global recessions are periods with (1) an annual world GDP per capita that is negative or close to zero, and (2) a high share of countries in a technical recession. The latest observations are for the fourth quarter of 2022.
Chart 12
Global component in yields
(correlation coefficients)
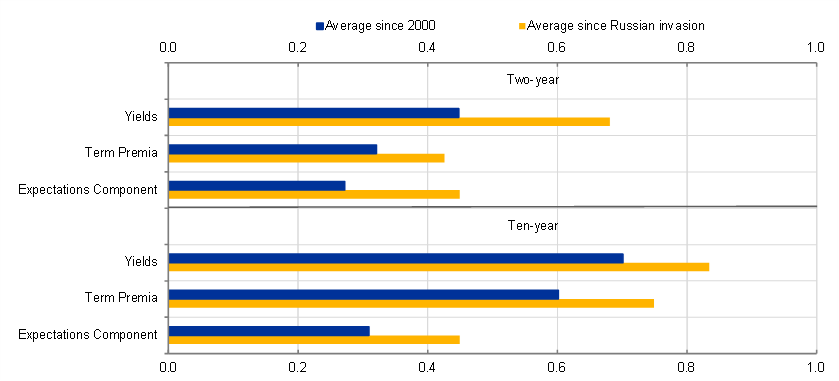
Sources: Datastream and Haver Analytics.
Notes: The sample consists of ten advanced economies (Australia, Canada, Denmark, euro area, Japan, New Zealand, Sweden, Switzerland, United Kingdom and United States). The bilateral correlation coefficients are averaged across these countries and time periods. The term premia and expectations components are the average of estimates from three models (dynamic Nelson-Siegel, rotated dynamic Nelson-Siegel and dynamic Svensson-Soderlind). The latest observations are for 9 March 2023.
In the euro area, the effects of monetary tightening are already visible, although they are only expected to fully materialise in the coming months due to the usual lag in the transmission of monetary policy. The monetary aggregates M1 and M3 are slowing down rapidly. In real terms their growth rates are in negative territory and at historic lows, below the levels of 2008 and 2011 (Chart 13).[21] Bank credit is also decelerating rapidly (Chart 14). As a result, it is declining as a share of GDP – faster, in fact, than in previous tightening episodes – and markets expect it to decline significantly further this year (Chart 15). These developments are largely related to our policy normalisation. But the size and the speed of the adjustment indicate that the transmission of our monetary policy to the economy may have become stronger.
Chart 13
Growth of monetary aggregates M1 and M3 in the euro area and the United States
(annual growth rates, percentages)
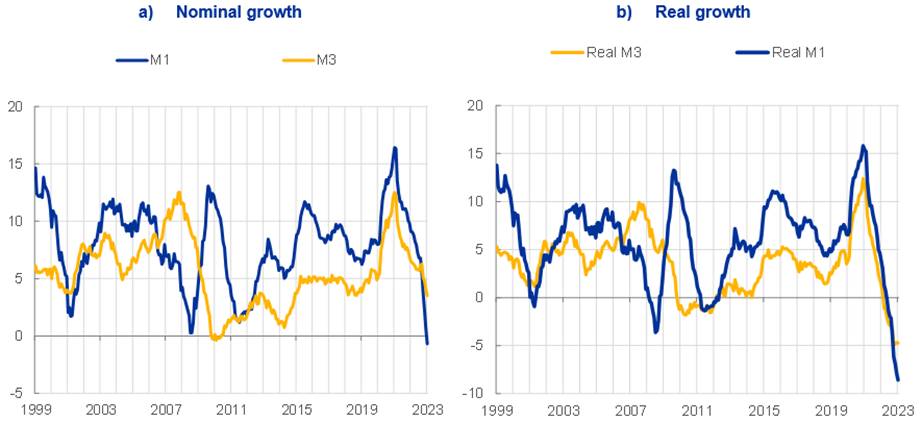
Sources: Panel a): ECB (BSI); panel b): ECB (BSI and ICP).
Notes: Solid lines show the annual growth rates of the index of notional stocks, i.e. a measure of flows normalised by outstanding amounts in the previous month. With this method, valuation changes and reclassifications are excluded from the computation of annual growth rates, and thus jumps in the annual growth series are avoided. Dotted lines show the annual growth rates of outstanding amounts. This method avoids the risk of distortion in the ratio of the money stock over price index that is implicit in the calculation of the real rates. In panel b), M3 and M1 are deflated by the HICP index. The latest observations are for January 2023.
Chart 14
Credit growth in the euro area
(three-month annualised percentage changes, seasonally adjusted)
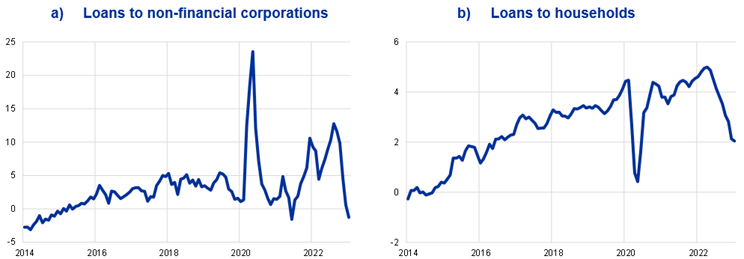
Source: ECB (BSI).
Notes: In panel a), MFI loans are adjusted for sales, securitisation and cash pooling activities. In panel b), MFI loans are adjusted for sales and securitisation. The latest observations are for January 2023.
Chart 15
Bank loans to the non-financial private sector in the euro area
(percentages of GDP)
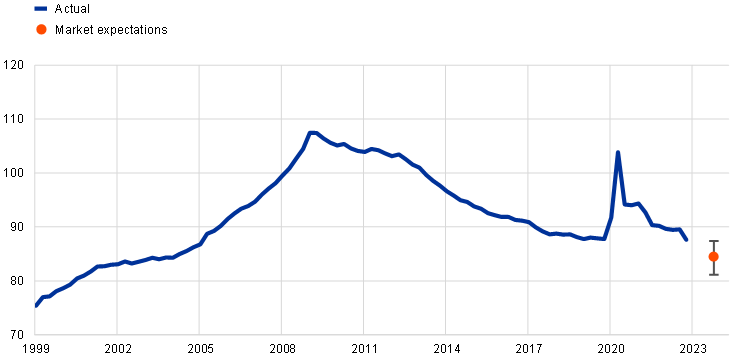
Sources: ECB (BSI, MNA), Refinitiv (I/B/E/S), ECB projections, individual banks’ financial statements and ECB calculations.
Notes: The orange marker shows the median forecast for year-end 2023, and the whiskers represent values within one standard deviation around the median (10th and 90th percentiles), as reported by market analysts and sourced through I/B/E/S. The distribution is weighted by realised loan volume for each bank as of year-end 2022 and based on an underlying sample of 143 forecasts covering 44 banks, submitted between 20 January and 10 March 2023. In each quarter, GDP is calculated by multiplying quarterly, seasonally adjusted flows by four; the figure for 2023 is based on the March 2023 ECB staff macroeconomic projections for the euro area. The latest observations are for the fourth quarter of 2022 for BSI and MNA, while market expectations refer to the fourth quarter of 2023.
The global tightening may also be amplified by the recent financial tensions in global banking markets. Aside from their impact on confidence, these tensions will make banks more sensitive to deposit outflows, inducing them to transfer the rate hikes more rapidly – and to a greater extent – to their customers on both sides of the balance sheet. For a while, banks may also become more prudent about lending and decide to retain cash as a precautionary measure. In the euro area, our bank lending survey[22] was already pointing to a tightening of lending standards for firms and households before the recent tensions, and this tightening may aggravate the drop in credit growth in the coming months.
In addition, major central banks have been simultaneously raising rates and reducing the supply of liquidity through quantitative tightening policies. This could make the policy adjustment bumpier. There is no reliable experience we can draw on to examine the combined effects of rate hikes and quantitative tightening. It is hard to assess how a contraction of the balance sheet of the central bank affects financial markets – especially if it happens in conjunction with an abrupt increase in interest rates.[23] The liability-driven investment crisis in the United Kingdom and the crisis of Silicon Valley Bank in the United States suggest that sudden adjustments may have an impact on the transmission of monetary policy and even give rise to severe financial tensions.[24]
In the current context, weakening growth prospects and heightened uncertainty may lead investors to move from risky assets to risk-free assets. And when the supply of liquidity is contracting quickly, this may spur a “dash for cash”, reinforcing the effects of the sharp increase in policy rates and exacerbating financial vulnerabilities. In fact, in the United States, high quality liquid assets are unusually offering higher returns than risky assets (Chart 16) at a time when liquidity is being withdrawn from the system.
Chart 16
Inverse price/earnings ratio, six-month risk-free rate and excess reserves in the euro area and the United States
(left-hand scale: percentage points, right-hand scale: EUR trillions)

Sources: Panel a): Refinitiv and ECB calculations; panel b): Refinitiv, Federal Reserve, and ECB calculations.
Notes: The inverse price/earnings ratio is a gauge of the earnings yield of holding stocks, shown here in comparison to risk-free rates. In panel a), excess liquidity is calculated as banks’ current account and deposit facility holdings minus their minimum reserve requirements. In panel b), excess reserves are calculated as reserves of depository institutions minus required reserves (the latter are set to zero in 2020). The latest observations in panel a) are 13 March 2023 for financial market data and 8 March 2023 for excess liquidity. The latest observations in panel b) are 13 March 2023 for financial market data and January 2023 (monthly data) for excess reserves.
As available liquidity shrinks, both in aggregate and for most banks, the supply of lending could also contract rapidly. Estimates by ECB staff suggest that banks with lower excess liquidity are more likely to reduce their supply of credit in response to policy rate hikes, and the increase in their lending rates is likely to be larger (Chart 17).
Chart 17
Response of loan supply and lending rates to a policy rate hike by level of excess liquidity
(percentage points of supply-driven loan growth (panel a) and change in lending rates (panel b) over three months for each percentage point increase in the deposit facility rate; size of bubbles equal to volumes of loans to firms)

Sources: Panel a): ECB (AnaCredit, iBSI, MOPDB) and ECB calculations; panel b): ECB (AnaCredit, iBSI, iMIR, MOPDB) and ECB calculations.
Notes: Supply-driven loan growth at the bank level is identified applying the methodology of Mary Amiti and David Weinstein to the euro area credit register (see Amiti, M. and Weinstein, D. (2018), “How Much Do Idiosyncratic Bank Shocks Affect Investment? Evidence from Matched Bank-Firm Loan Data”, Journal of Political Economy, Vol. 126, No 2, pp. 525-587. The chart reports coefficients from regressions of the supply-driven loan growth (panel a) and bank-level changes in new lending rates to firms (panel b) three months ahead on the level of excess liquidity interacted with the change in the deposit facility rate over the same period, distinguishing between observations before and after December 2021 and with the excess liquidity-over-assets ratio between the levels indicated on the x-axis. The specification includes bank and country time fixed effects and controls for bank assets. The size of the bubbles measures the outstanding amounts of loans to firms for banks belonging to each category. The latest observations are for November 2022.
Implications for the ECB’s monetary policy
So how should monetary policy operate in an environment characterised by high uncertainty, strong spillovers and financial vulnerabilities?
Adapting to the current environment
First, monetary policy must remain fully adaptable to changing developments, given the prevailing uncertainty, the lags with which it operates and the risk of sudden financial tensions. This requires a data-dependent approach that does not prejudge future policy decisions and that reflects the risks on both sides.
Second, our tightening must be calibrated prudently. This is because it is already having a strong impact on financing conditions and because we want to avoid undesirable financial volatility. And this prudent approach holds truer still as our policy rates move more firmly into restrictive territory, inflationary forces ease and the risks to the inflation outlook become balanced. At times like this, abrupt policy moves are not necessary.[25]
Third, in order to avoid financial tensions which could hamper our disinflationary policies, we should rely on our policy rate as the key instrument to steer our stance and we should be measured and predictable in the normalisation of our balance sheet. We should continuously monitor investors’ exposure to interest rate risk and liquidity risk and carefully analyse the impact that the decline in liquidity may have on the supply of credit.
We must stand ready to intervene in a timely manner to counter possible market dysfunctions. We have the instruments to adjust the provision of liquidity and ease collateral conditions as necessary, in line with what we have done during the pandemic. And we need to remain committed to our three lines of defence against financial fragmentation within the euro area.[26]
Finally, all policymakers should be tackling inflation on all fronts. It is not a task for central bankers alone. Thanks to public intervention, we had an unusual recession – one with high profits. This means that firms have the buffers to absorb a catch-up in labour costs without increasing prices in response, also in view of the fall in the cost of other inputs, like energy.
Persistently opportunistic profits should not put a dampener on disinflation. Profiteering strategies that increase inflation and the risk of second-round effects would trigger a monetary policy reaction. But other authorities should also intervene. The appropriate response to excess corporate profits is not more fiscal support to compensate consumers for high prices of goods and services. Rather, it is to intervene to prevent any abuse of market power.
Addressing spillovers
Let me now turn to how monetary policy should address spillovers.
We must take into account all the relevant information when taking decisions, and that includes developments outside the euro area. Given the global nature of the shocks we are facing, we need to consider how they are transmitted across markets and economies, alongside the potential spillovers from the policy response to those shocks. This is what we have done. And in response to tensions in international funding markets, we have worked with other major central banks to enhance the provision of US dollar liquidity via our standing liquidity swap line arrangements.[27]
At the same time, we need to tailor our policy response to the outlook for the euro area and avoid passively importing financing conditions from abroad through policy spillovers to interest rate expectations and long-term interest rates. We have the necessary autonomy to steer financing conditions in a way that reflects the differences between the euro area and other jurisdictions.[28]
We can reconcile these two objectives – factoring in spillovers but tailoring our policy to domestic conditions – if we calibrate our policy appropriately and communicate our reaction function clearly.
Our measures need to be calibrated in such a way that they achieve the appropriate domestic stance. To use a metaphor – if outside temperatures start falling after a period of hot weather, we have less need for air conditioning because temperatures inside will gradually cool, too. If we then apply this approach to our current situation, when calibrating our measures we should consider the restrictive impulse coming from the global tightening and from the vulnerabilities that are emerging in the financial sector abroad.
The clarity of our communication is also crucial, especially in view of the current financial tensions. In order to communicate our policy intentions clearly and consistently at a time when we must remain data-dependent and adapt to new developments, we need to set out a clear reaction function and stick to it.[29] Accordingly, in our latest monetary policy statement we emphasised that “The elevated level of uncertainty reinforces the importance of a data-dependent approach to our policy rate decisions, which will be determined by our assessment of the inflation outlook in light of the incoming economic and financial data, the dynamics of underlying inflation, and the strength of monetary policy transmission.”[30]
Conclusion
Let me conclude.
A string of shocks has created uncertainty for economies around the world. While the effects of some of these shocks are starting to unwind, it may be some time yet before we see volatility in activity and prices subside, and a new equilibrium settle in.
Notably, my remarks today have focused on the current economic situation. But we may well see longer-lasting changes to economic structures as supply chains are reconfigured to increase resilience to global shocks and align with shifting geopolitical strategies.
In the meantime, monetary policy must perform a difficult balancing act.
Faced with an exceptionally complex environment, we need to acknowledge the uncertainty prevailing in the economy. And we need to continuously assess the combined effect of our different policy instruments, the risks of non-linear effects and the spillovers from policies adopted elsewhere. This means our monetary policy should be data-dependent and adaptable. And it requires us to shape our communication on the basis of our monetary policy reaction function.
In a speech last month I summarised my thinking by saying that we do not want “to drive like crazy at night with our headlights turned off”.[31] The recent financial tensions have made this conviction even stronger.
The possible consequences that an incorrect calibration of monetary policy could have for financial stability and the transmission of monetary policy are discussed in Panetta, F. (2022), “Mind the step: calibrating monetary policy in a volatile environment”, keynote speech at the ECB Money Market Conference, Frankfurt am Main, 3 November.
Panetta, F. (2023), “Monetary policy after the energy shock”, speech at an event organised by the Centre for European Reform, the Delegation of the European Union to the United Kingdom and the ECB Representative Office in London, 16 February.
The risks of policy normalisation – in particular the interaction between rate hikes and quantitative tightening – are discussed in Panetta, F. (2022), “Normalising monetary policy in non-normal times”, speech at a policy lecture hosted by the SAFE Policy Center at Goethe University and the Centre for Economic Policy Research (CEPR), 25 May.
Panetta, F. (2021), “Monetary autonomy in a globalised world”, welcome address at the joint BIS, BoE, ECB and IMF conference on “Spillovers in a “post-pandemic, low-for-long” world”, 26 April.
The Global Supply Chain Pressure Index, developed by the Federal Reserve Bank of New York, decreased considerably in February 2023 and is now below its historical average. This decrease was broad-based across factors but driven mainly by a decline in European and Asian delivery times. This latest estimate suggests that global supply chain conditions have largely normalised.
See Chart 5 in Panetta, F. (2022), “Greener and cheaper: could the transition away from fossil fuels generate a divine coincidence?”, speech at the Italian Banking Association, 16 November.
The ECB Consumer Expectations Survey suggests that euro area consumer inflation expectations have reached a turning point. Median expectations for inflation three years ahead fell to 2.5% in January 2023, from 3.0% in the previous month.
Panetta, F. (2023), “Monetary policy after the energy shock”, op. cit.
Panetta, F. (2023), “Monetary policy after the energy shock”, op. cit.
Lagarde, C. (2023), “The path ahead”, speech at the ECB and its Watchers Conference, 22 March.
The resilience of profits started to be visible during the pandemic, when there was an unusual recession with an increase in unit profits (in contrast with past recessions), while fiscal support absorbed the economic shock.
High input price pressures facilitate increases in profit margins, as the extent to which increases in selling prices reflect the pass-through of increased costs or go beyond the cost increases and benefit profit margins is less clear in such an environment.
Supply-demand mismatches limit competition and enable profit-maximising companies to expand their profit margins without losing market shares.
In the euro area, all private domestic demand components contracted in the fourth quarter of 2022. Private domestic expenditure – the sum of private consumption and investment (excluding non-residential construction and Irish intellectual property products) – dropped by 0.8% quarter on quarter, amid declining real disposable income, lingering uncertainty and tighter financing conditions. In the United States, real private domestic final purchases – which includes private consumption, residential investment and business fixed investment – increased at a subdued annual rate of 0.2% in the fourth quarter of 2022.
Estimates suggest, however, that the reopening is already priced into commodity prices and that its impact on oil prices has been more than offset by ample supply and weak global demand.
With the United States representing over 25% of global consumption – about twice as much as either the euro area or China – and driving much of the growth in global spending on durable goods, the surge in US demand exacerbated pandemic-related bottlenecks worldwide. See Chart 8 in Broadbent, B. (2021), “Lags, trade-offs and the challenges facing monetary policy”, speech at Leeds University Business School, 6 December.
Panetta, F. (2021), “Patient monetary policy amid a rocky recovery”, speech at Sciences Po, 24 November.
ECB analysis finds that a tightening by the Federal Reserve System generates spillovers to euro area real activity and inflation that are comparable to the effects of this tightening on the US economy. Estimates are obtained based on a sample spanning 1991 to 2019, using high frequency-based US monetary policy shocks (sum of conventional, Odyssean forward guidance and quantitative easing) in monthly smooth local projections. For example, a one standard deviation US monetary policy tightening shock contracts US and euro area equity prices about equally by up to 0.75% over a two-year horizon. See Lane, P.R. (2023), “The euro area hiking cycle: an interim assessment”, speech at the National Institute of Economic and Social Research, 16 February.
A tightening in the United States also results in an appreciation of the US dollar, which increases pressure on other central banks to tighten in order to avoid the depreciation of their currencies against the dollar leading to a deterioration of their domestic inflation outlooks. This was particularly noteworthy in the context of the energy shock, because the price of energy commodity imports is often denominated in US dollars.
Dieppe, A. and Brignone, D. (2022), “Synchronised interest rate hikes, spillovers and risks to global growth”, VoxEU, 14 November; Panetta, F. (2022), “Mind the step: calibrating monetary policy in a volatile environment”, op. cit.; and Obstfeld, M. (2022), “Uncoordinated monetary policies risk a historic global slowdown”, Realtime Economics, Peterson Institute for International Economics, 12 September.
The decline in M1 largely reflects shifts away from the unusually large stock of overnight deposits towards other less-liquid but better-remunerated instruments. The sharp deceleration in M3 is driven by the run-off of the Eurosystem balance sheet and the sharp slowdown in credit.
ECB (2023), Euro area bank lending survey, January.
Panetta, F. (2022), “Normalising monetary policy in non-normal times”, op. cit.
These crises were triggered by specific events (the announcement of a fiscal package in the United Kingdom and a shift in sentiment among Silicon Valley Bank’s depositors – tech companies, venture capital and high net worth individuals – that exposed large unhedged interest rate risks).
Panetta, F. (2022), “Mind the step: calibrating monetary policy in a volatile environment”, op. cit.
The first of these is a measured approach to interest rate increases and balance sheet normalisation. The second is the flexibility embedded in our reinvestments under the pandemic emergency purchase programme. The third is the Transmission Protection Instrument.
The frequency of seven-day US dollar operations has been increased from weekly to daily. See ECB (2023), “Coordinated central bank action to enhance the provision of US dollar liquidity”, 19 March.
Panetta, F. (2021), “Monetary autonomy in a globalised world”, op. cit.
In the past, when concerns about having reached the lower bound were dominating discussions, forward guidance helped insulate the euro area from financial spillovers. But forward guidance is not suited to the current environment. See Panetta, F. (2023), “Monetary policy after the energy shock”, op. cit.
ECB (2023), “Monetary policy statement”, 16 March.
Panetta, F. (2023), “Monetary policy after the energy shock”, op. cit.
Banco Central Europeu
Direção-Geral de Comunicação
- Sonnemannstrasse 20
- 60314 Frankfurt am Main, Alemanha
- +49 69 1344 7455
- media@ecb.europa.eu
A reprodução é permitida, desde que a fonte esteja identificada.
Contactos de imprensa-
22 March 2023