
- Speech
- New York, 21 February 2020
The monetary policy toolbox: evidence from the euro area
Keynote speech by Philip R. Lane, Member of the Executive Board of the ECB, at the 2020 US Monetary Policy Forum
Introduction
I would like to thank Chicago Booth for inviting me to speak at the 2020 U.S. Monetary Policy Forum, sponsored by the Initiative on Global Markets at the University of Chicago Booth School of Business, New York, New York.[1]
The focus of this year’s US Monetary Policy Forum, the analysis of unconventional monetary policies, is relevant for many economies, including the euro area. That said, while central banks face many common challenges, the evolution of economic, financial and monetary conditions in the euro area was also specifically influenced by both the euro area sovereign debt crisis that followed the global financial crisis and the European policy responses to these crises. As a result, the euro area is at a different point in the monetary policy cycle than other jurisdictions.
The post-crisis monetary policy of the ECB shares many similarities with that of the Federal Reserve: having largely exhausted the conventional space for moving its policy instrument (the short-term policy rate), the ECB turned to a broad set of unconventional measures in pursuit of its statutory objective.[2] However, there are important differences between the unconventional measures taken by the Federal Reserve and the ECB. In particular, the ECB moved into negative territory with its policy rate, employed targeted refinancing operations to promote credit growth and customised its asset purchase programme (APP) to the specific context of the euro area. Our understanding of the propagation mechanisms of these measures and their efficacy in supporting the economy and the inflation process is steadily deepening.[3]
In my remarks today, I will discuss our experience with the non-standard measures in our monetary toolbox and explain our monetary policy reaction function in the current below-target inflation environment.[4] The nature of our reaction function is spelled out in our forward guidance, which provides a unified framework across our different policy instruments – with the guidance on the rate path at its centre – and facilitates automatic adjustment in market conditions in response to shocks that are assessed as influencing the future path of interest rates.
The case for unconventional measures in a low interest rate environment
Interest rates in advanced economies have been on a broad downward path for more than three decades and remain close to historical lows.[5] As has been highlighted in many studies, the drivers of this long-term pattern largely boil down to demographics, productivity and the elevated net demand for safe assets.[6] As a result, the real neutral interest rate (r*) has declined across advanced economies. For the euro area, recent Eurosystem estimates point to r* at zero or even below zero, which is a marked decline since the early 2000s (see Chart 1). Estimates of r* for the United States show a similar trend but remain at a higher level than in the euro area.[7]
While the factors that have reduced r* are beyond the control of the central bank, the fact that the level of r* is lower has significant implications for monetary policy: the short-term policy interest rate hits the zero bound more often and, when it does so, remains at the lower bound for a longer time. A recent ECB staff paper shows that, in a scenario where r* falls from 2 percent to zero, the incidence of hitting the zero bound almost doubles.[8]
Lower real rates reduce the available policy space to counter low inflation. This may increase the time it takes for inflation to return to target and this delay may be compounded if a prolonged period of low inflation also erodes inflation expectations.
Econometric estimates of euro area real neutral interest rate
(percentages per annum)

Sources: Brand, C., Bielecki, M. and Penalver, A. (eds.) (2019), “The natural rate of interest: estimates, drivers, and challenges to monetary policy”, Occasional Paper Series, No 217, ECB; and all works cited in footnote 7.
Notes: Ranges span point estimates across models to reflect model uncertainty and no other source of r* uncertainty. The dark shaded area highlights smoother r* estimates that are statistically less affected by cyclical movements in the real rate of interest than the other estimates depicted here.
The ECB’s monetary policy toolbox
The Governing Council’s monetary policy reaction function is laid out in our forward guidance on the path of our policy instruments. Together with the forward guidance on the rate path at the centre, this provides a coherent framework for the various non-standard measures which the ECB has deployed: negative interest rates, asset purchases and targeted long-term refinancing operations (TLTROs).
Forward guidance
Initially expressed in qualitative terms, the ECB’s rate guidance has evolved over time, with the current formulation made explicitly conditional on a set of criteria regarding the inflation outlook. The cross-country experience with forward guidance indicates that its effectiveness can differ considerably depending on the type of conditionality attached to the policy rate path. In particular, time-based guidance provided over relatively short horizons appears to be rather ineffective in reducing market uncertainty.[9] Conversely, the evidence indicates that rate forward guidance over long horizons, or state-based guidance, is more effective in reducing the sensitivity of asset prices to macroeconomic news.
The state-contingent formulation links the Governing Council’s expected interest rate path to at least two conditions regarding the inflation outlook. First, inflation has to “robustly converge to a level sufficiently close to, but below, 2 percent within our projection horizon.” Second, this convergence needs to be “consistently reflected in underlying inflation dynamics”. The first condition is forward-looking: inflation has to be seen to be converging to a level sufficiently close to 2 percent well before the end point of the horizon: this is the meaning of “robust convergence”. The second condition is backward-looking: we have to see the robust convergence in future inflation confirmed and verified in actual measures of underlying inflation.
Importantly, the decision we took last September has established a unified framework for our forward guidance across policy instruments that links the horizon of both our net asset purchases and reinvestments to our forward guidance on the rate path: net purchases are expected to continue until “shortly” before we start raising the key ECB rates; and reinvestments are expected to run “for an extended period of time past the date when we start raising the key ECB interest rates”. Whereas the forward guidance on the rate path acts on the expectations component of longer-term rates, the asset purchases especially affect term premia, as I will discuss in more detail later on.
Evidence suggests that the enhanced forward guidance we introduced last September is well understood by market participants. The interest rate lift-off dates in survey-based measures largely coincide with the time at which inflation expectations two years ahead – the horizon of the ECB/Eurosystem staff macroeconomic projections – are around levels close to, but below, 2 percent. This indicates that the link between our interest rate forward guidance and the inflation threshold is understood.
More than that, thanks to its state-contingent nature, our rate guidance provides an automatic stabilisation mechanism that steers rate expectations – and expectations about our asset purchases – as a function of the evolving inflation outlook. In practice, we have seen this automatic stabilisation function of our forward guidance operate effectively, with market expectations for a first increase of the policy rate accommodating short-term volatility in the inflation outlook. For example, the January 2020 Bloomberg survey pointed to a later lift-off date of the second quarter of 2022 (blue vertical line in Chart 2) in comparison with the Bloomberg survey of April 2019 (yellow vertical line in Chart 2), which coincided with the slight decline in Consensus Economics expectations for annual inflation in the euro area (yellow and blue diamonds in Chart 2).
Inflation as projected by Consensus Economics and survey-implied lift-off date
(percentage changes)
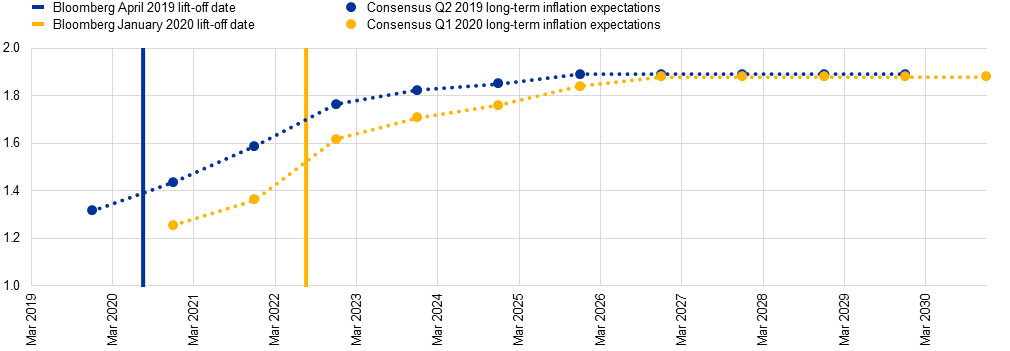
Sources: Consensus Economics and Bloomberg.
Notes: Vertical lines denote expected lift-off dates reported in the April and January Bloomberg surveys. Diamonds denote expectations for average annual inflation rates in each year between 2019 and 2029 reported in the Consensus Economics surveys. The latest observation is for January 2020.
In addition to serving as an automatic stabiliser for policy rate expectations, the interest rate forward guidance is also the anchor for expectations of the net asset purchase and reinvestment horizons, as these measures are tightly linked to the interest rate lift-off. Changes in the inflation outlook that trigger a reappraisal of the lift-off date should therefore also affect the expected end date of net asset purchases and reinvestments, thereby stabilising the long end of the yield curve.[10] In fact, this tight link is reflected in the positive co-movement between short and long-term interest rates in response to news that affects the macroeconomic outlook (Chart 3).
While the automatic stabilisation function embedded in the forward guidance accommodates any short-term volatility in the outlook, the Governing Council continues to stand ready to adjust all of its instruments, as appropriate, to ensure that inflation moves towards its aim in a sustained manner, in line with its commitment to symmetry.
Scatterplot of the contribution of demand factor to short-term rates (x-axis) versus long-term rates (y-axis).
(percentage points)
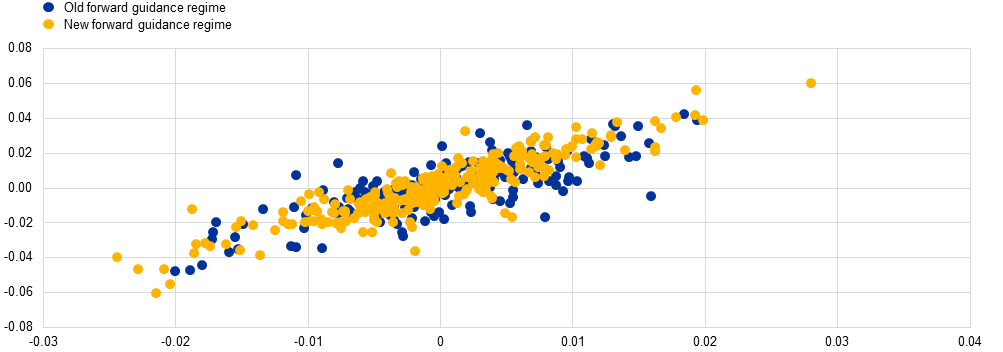
Source: ECB calculations.
Note: The latest observation is for 14 February 2020.
Overall, the available evidence suggests that the ECB’s rate forward guidance has been and continues to be an effective monetary policy tool and that the transmission of forward guidance to financial conditions and the economy has remained stable over time. In part, this reflects the strong explicit conditionality embedded in the ECB’s evolving rate forward guidance statement as well as the interaction with asset purchases and other instruments.[11]
Negative interest rates
Within our forward guidance framework, the negative interest rate policy has played a key role in enhancing this automatic stabilisation by lowering the effective lower bound. There was no playbook to guide the 2014 decision to push the deposit facility rate – which the ECB pays on bank excess reserves – into negative territory. Subsequent cuts, including the latest in September 2019, have brought the deposit facility rate to -0.5 percent.
A corollary of relaxing the lower bound constraint has been that the propagation of negative interest rates through the term structure of interest rates is qualitatively different and more powerful than traditional interest rate cuts occurring in positive territory. The difference comes from two effects.
The primary mechanism is the way in which expectations about the future path of monetary policy are reflected in market interest rates when the central bank reduces the overnight interest rate to very low levels. If the central bank reduces its policy rate to zero and makes it clear that it will not lower its policy rate any further, then this declared and self-imposed non-negativity restriction influences rate expectations among market participants: looking to the future, they will see rate increases as being more likely than rate decreases. As a result, the predictive density of the future rate path will tend to be skewed upward, and interest rates at longer maturities will tend to decline by less than the reduction of the policy rate.
By contrast, under a negative interest rate policy, where future rate cuts are possible, the distribution of rate expectations is more symmetric, putting downward pressure on longer-maturity interest rates. Rate expectations can even be skewed downwards if the negative rate policy is flanked by communication that the interest rate might be reduced further. In this vein, the ECB’s forward guidance has reinforced the negative interest rate policy by stating that the Governing Council expects the ECB’s key interest rates “to remain at their present or lower levels for an extended period of time”.
EONIA forward curve and its risk-neutral density: before the negative interest rate policy (left side) and after its introduction (right side)
|
(percentages per annum) 
Source: Rostagno et al., op. cit. Notes: Risk-neutral densities as of 29 January 2013 (left side) and 5 September 2014 (right side) derived from options on EURIBOR futures. The mean and the percentiles are shifted to the EONIA space by subtracting the EURIBOR3M-OIS3M spot spread. The forward curve distribution in January 2013 was rather steep and truncated in positive territory, which reflected the view of market participants that rates could not fall below zero and only increase. |
This mechanism is illustrated in Chart 4: once the deposit facility rate was brought to a negative level in June 2014 and further reduced in September 2014, the forward curve became markedly flatter and the distribution of expectations more symmetric, with a mild inversion over short to medium-term maturities and no truncation in positive territory (see Chart 4, right side).[12]
An additional mechanism through which negative rates affect lending conditions is by discouraging cash hoarding and providing an incentive to banks to rebalance towards an alternative use for their funds (even as rate expectations are constant). Evidence shows that the improving financing conditions stemming from negative interest rates are feeding their way into the real economy through increased bank loans.[13]
There is also evidence that negative rates have increased corporate investment: firms with large holdings of liquid assets that are exposed to negative deposit rates have increased investment compared with firms with small holdings of liquid assets that are less affected by negative deposit rates (see Chart 5).[14] This effect is economically significant and estimated to boost corporate investment by as much as 1 percentage point per annum.
Investment growth of firms exposed to negative deposit rates
(annual percentage changes)
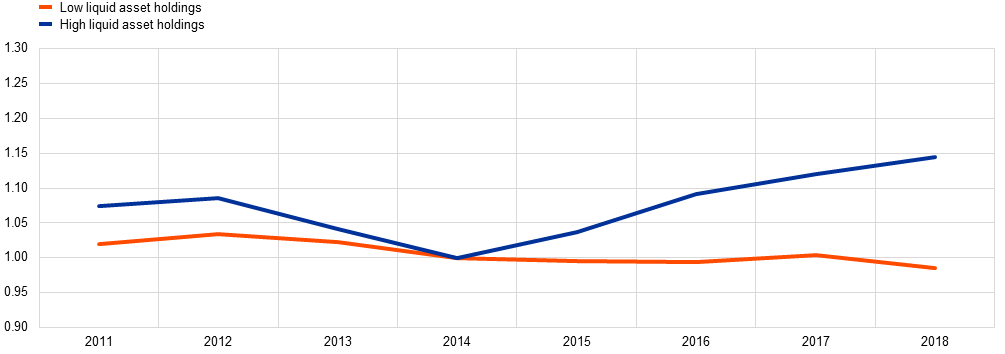
Source: Altavilla, C. et al., op. cit.
Notes: Average investment for corporate clients of banks whose average non-financial counterparty deposit rate has been negative at least once, distinguishing between firms with a ratio of current assets over total assets in the top decile (high liquid asset holdings, blue line) and in the bottom decile (low liquid asset holdings, red line) of the distribution. Investment orthogonal to firm fixed effects, normalised to 1 in 2014. The latest observation is for 2018.
That the effects of an interest rate cut are more powerful in negative territory can also be seen when considering the “footprint” on the term structure.[15] Using high-frequency financial market data (“tick data”) to identify monetary surprises, ECB analysis shows that the transmission is more powerful than that of a standard interest rate cut in positive territory, since its effect on the yield curve extends to longer maturities, with a maximum effect around medium-term maturities (see Chart 6).
Estimated effect of policy rate surprises: standard policy rate surprise (left side) and policy rate surprise in negative territory (right side)
(basis points)

Source: Based on Altavilla, C., Brugnolini, L., Gürkaynak, R. S., Motto, R. and Ragusa, R. (2019), “Measuring euro area monetary policy”, Journal of Monetary Economics, Vol. 108, pp. 162-179.
Note: Surprise impact normalised to 10 basis points for the six-month maturity.
Moreover, as banks tend to consider risk-free interest rates with short to medium-term maturities as the reference rates for pricing loans to non-financial corporations, the pronounced effects of the negative interest rate policy also propagate through the bank lending channel: our negative rate policy has contributed to a significant decline in lending rates to non-financial corporations since 2014, which in turn has translated into higher loan volumes channelled to the real economy.
The bank-based nature of the euro area economy lends itself to a swift transmission of interest rates to the economy. At the same time, there is a clear friction in the pass-through of negative rates to depositors, especially to retail customers (see Chart 7). Taken in isolation, this friction weighs on bank net interest income and profitability.
Share of deposits carrying a negative rate
(percentages)
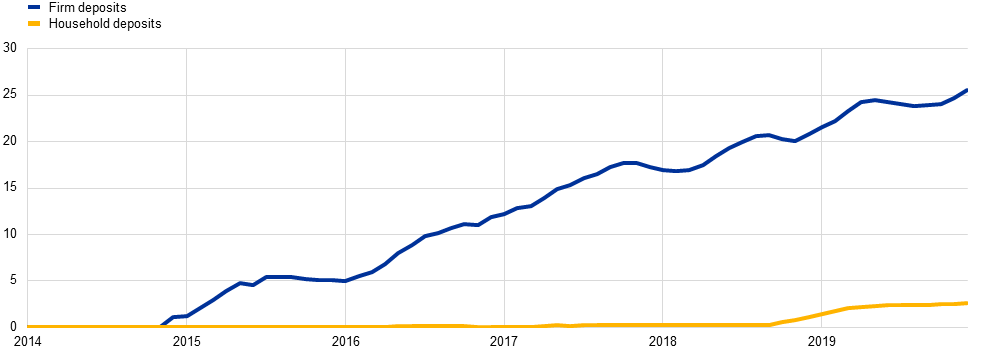
Sources: ECB and ECB calculations.
Notes: Deposit rates on outstanding amounts as reported by individual banks for each of the available product categories, weighted by outstanding amounts.
Household deposits also account for deposits held by non-profit institutions serving households. The latest observation is for December 2019.
That said, the overall impact of the negative interest rate policy extends beyond the mechanical effects on interest rate margins. Negative rates – especially in combination with the other elements in our policy package – support the overall level of economic activity. This leads to higher lending volumes and lower impairment provisioning, while interest rate cuts also generate capital gains on existing securities holdings and improve wholesale funding conditions for banks. From 2014 to 2018, the aggregate impact of non-standard measures was positive for the profitability of the banking system (see Chart 8).[16]
Bank return on assets since 2014 and impact of non-standard measures
In any event, the very substantial differences in return on equity across different regions with broadly similar monetary conditions (see Chart 9) suggest that other factors (such as market structure and efficiency) are more important in determining the overall profitability of the banking system.[17] Accordingly, any comprehensive analysis of the determinants of the profitability of the euro area banking system should not focus excessively on the mechanical effect of the limited pass-through of negative policy rates to retail deposit rates.
Annual bank return on equity
(percent)
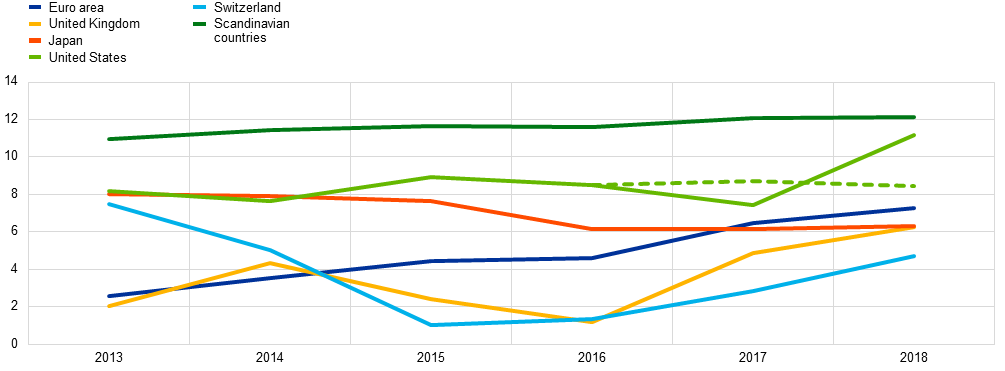
Sources: S&P MI (SNL Financial) and ECB calculations.
Notes: Dotted green line excludes the impact of changes in taxation in the United States. “Scandinavian countries” include Denmark, Norway and Sweden. The latest observation is for 2018.
Nonetheless, the Governing Council is closely monitoring the risk that the impact of negative rates on bank profitability may impair the transmission of monetary policy to the real economy. Moreover, the ECB decided last September to introduce a two-tier system for remunerating excess liquidity holdings, with the aim of supporting the bank-based transmission of monetary policy. The interest rate on such holdings is now tiered, with excess liquidity holdings up to six times the minimum reserve requirements receiving zero interest and holdings beyond that level remunerated at the deposit facility rate of -0.5 percent.
The implementation of the tiering policy has been smooth: on the one side, it has reduced the direct cost of negative interest rates for banks and thereby helped sustain the pass-through of low policy rates to bank lending rates, while on the other side, money market rates have continued to be well aligned with the policy rate, thereby preserving the positive contribution of negative rates to the accommodative stance of monetary policy.[18]
Finally, we are alert to the possibility that there may be a level for the policy rate below which a policy easing would have perverse effects and in fact lead to a tightening of bank credit conditions: the reversal rate.[19] The ongoing pass-through of easing measures to lower lending rates and continued credit growth indicates that the reversal rate is not currently binding for the euro area. While measured credit growth is decelerating, this reflects the demand for bank loans mirroring the slowdown in the economy, and there are no signs of supply-side restrictions due to banks seeking to retrench from lending. In fact, bank credit standards in the euro area have been either loosening or steady around very supportive levels since 2014. In line with this, since the introduction of negative rates, banks have consistently reported in the ECB’s bank lending survey that they view negative rates as supportive of credit creation.
Targeted longer-term refinancing operations
TLTROs are an effective tool for providing credit easing and are particularly useful if there is a risk of the bank-based transmission mechanism becoming impaired.
Banks can use TLTROs to refinance with the ECB over an extended horizon and at very favourable conditions, provided that they meet the lending targets set by the ECB. Under the second and third rounds of the programme (TLTRO II and III), borrowing rates in the TLTROs can be as low as the deposit facility rate – which is currently set at -0.5 percent.
TLTROs lower bank funding costs via two distinct channels – direct and indirect. The funding cost relief is direct for those banks that use TLTRO financing instead of more expensive market funding. In addition, the TLTROs have indirectly contributed to favourable funding conditions on capital markets through the scarcity effects generated by reduced bond issuance from banks that replace market-based funding with TLTRO borrowing.
The effectiveness of TLTROs can be analysed by comparing the change in lending rates between those banks that participated in the operations and those that did not. The comparison shows that participating banks granted significantly more favourable rates to their corporate clients than their non-participating counterparts, which suggests a sizeable easing of financing conditions for firms, especially in vulnerable countries (see Chart 10).
Lending rates to non-financial corporations of TLTRO bidders and non-bidders
(percentage points; deviations from September 2014)
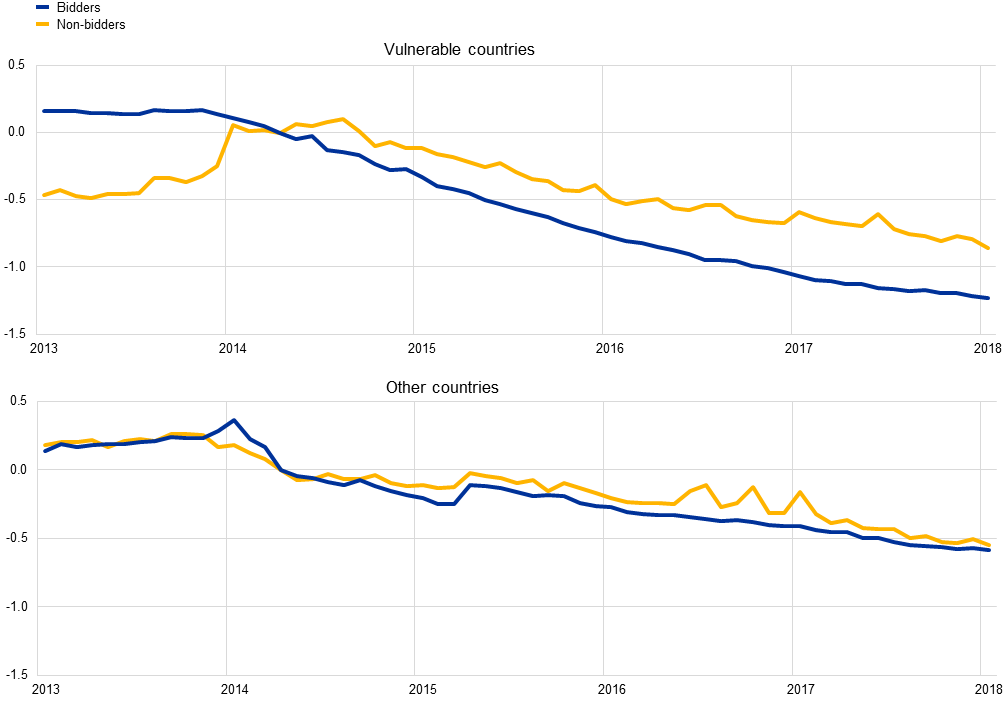
Sources: ECB individual monetary financial institution interest rate statistics and ECB calculations.
Notes: Non-financial counterparty lending rates are the rates on outstanding loans to non-financial corporations weighted by volume. The chart shows average rates across bidders and non-bidders in deviation from rates in September 2014. “Vulnerable countries” are Ireland, Greece, Spain, Italy, Cyprus, Portugal and Slovenia. “Other countries” are all the remaining euro area countries.
Asset purchase programme
Finally, by linking the horizon of the APP – both in terms of net purchases and the reinvestment policy – to the forward guidance on policy rates, expectations on the purchase horizon of the APP adjust in line with the inflation outlook and automatically regulate term premia.
The transmission of our asset purchases in the euro area has been similar to the transmission of other central banks’ asset purchases in their respective jurisdictions, with the most pronounced effects at longer maturities.[20] While negative interest rates and forward guidance have primarily been transmitted through the expectations component of interest rates, asset purchases have primarily operated through the term premium component. This is due to asset purchases affecting interest rates mainly by reducing the interest rate (or duration) risk borne by investors holding long-term bonds – the duration risk extraction channel. By purchasing securities with a relatively long maturity, the central bank frees up risk-bearing capacity among investors and fosters a rebalancing of their portfolio towards other, more risky, types of assets, including investment in productive capital.
In the euro area, our net asset purchases and reinvestment policy have led to substantial duration risk being withdrawn from the market, in the order of 20 percent of the duration-equivalent stock of current public debt in the four largest euro area economies (see Chart 11). Based on a term structure model that incorporates the duration channel, we can track the time-varying effect of the APP on term premia as expectations on the purchase horizon change over time. At present, the APP is estimated to be compressing euro area ten-year sovereign yields by more than 100 basis points (see Chart 12).
We are confident that the effects of our asset purchases continue to feed through to euro area financial conditions and support a more accommodative monetary policy stance. The experience we have built up over the last five years does not indicate that asset purchases entail diminishing returns over time. This is corroborated by recent research applied to the US experience which suggests that, once anticipation effects are taken into account, the later rounds of large-scale asset purchases undertaken by the Federal Reserve remained powerful.[21]
Outstanding quantity of duration: PSPP and other investors
Impact of PSPP on euro area sovereign term premia over time
The macroeconomic effect
The contribution of our measures to the overall easing of euro area financial conditions has been notable across the entire term structure. Overall, the combined effect of negative interest rates, forward guidance and the APP is estimated to have peaked at around 140 to 150 basis points in long-term rates between 2016 and 2018 (see Chart 13).
Impact of non-standard measures on the sovereign yield curve
These improved financing conditions have made a considerable contribution to the macroeconomic performance of the euro area. A counterfactual exercise indicates that, in the absence of our unconventional measures, growth, employment and inflation would have been considerably lower. More specifically, the estimated average annual contribution of the unconventional measures to euro area inflation is between 0.3 and 0.5 percentage points (see Chart 14). The estimated level of real GDP at the end of 2019 without the package of unconventional measures is between 2.5 and 3.0 percentage points lower than the observed level, and employment is estimated to be about 2.5 million lower in the absence of the measures.
No-measures counterfactual
(percentage points) Source: ECB calculations. Note: The boxplot depicts a range of assessments, comprising the Eurosystem staff assessment based on a suite of models and the assessment documented in Rostagno, M. et al., op. cit. |

By contrast, the role of fiscal policy in supporting the euro area economy has been limited (see Charts 15-17). While the current mildly expansionary fiscal stance is providing some support, the more fiscal policy contributes to boosting long-term growth potential and providing cyclical stabilisation, the quicker will be the effects of monetary policy interventions on inflation and the economy. In this regard, it is worth keeping in mind that the macroeconomic impact of fiscal policy is particularly strong in an environment in which inflationary pressures are muted and the expected interest rate path is not very steep.
Euro area fiscal stance and change in the output gap
Contributions to euro area real GDP growth
Government balances
Conclusion
Let me conclude. Globally, central banks have been confronted with large and persistent shocks stemming from the financial crisis and the long-term trend decline in the equilibrium real interest rate. These factors have constrained conventional monetary policy space and required a profound expansion of the policy toolbox in order to ensure the effectiveness of monetary policy.
Our forward guidance on interest rates, which makes the evolution of our policy rates contingent on the robust convergence of inflation to our aim, captures our monetary reaction function in the current environment of low inflation and low interest rates. Our forward guidance links the various unconventional monetary policy instruments together within a coherent framework and is proving effective in guiding adjustment in the expected path for policy rates and longer-term bond yields in response to the changing outlook.
As I have demonstrated, the ECB has been willing and able to calibrate the combination of its unconventional policy instruments in directions and on a scale that gives sizeable support to the economy and continues to support the convergence of inflation to our aim. At the same time, if fiscal policy were to play a more supportive role alongside monetary policy, it would lead to a faster return of inflation to our objective and contribute to raising the equilibrium real interest rate, thereby alleviating the constraints on monetary policy.
Finally, the long-term trends that are being discussed at this conference give all central bankers pause for thought in terms of their strategy and instruments. In this vein, we announced last month the launch of a comprehensive review of our monetary policy strategy, which we expect to be concluded by the end of the year.
- [1]I am grateful to John Hutchinson and Arthur Saint-Guilhem for their contributions to this speech.
- [2]For example, Ben Bernanke calculates that the combination of asset purchases and forward guidance can add about 3 percentage points of policy space for the United States, assuming a neutral nominal rate in the range of 2 to 3 percent, see Bernanke, B. (2020), “The New Tools of Monetary Policy”, presidential address at the American Economic Association Annual Meeting, January.
- [3]For a detailed discussion of the sources of complementarities across these instruments, see Lane, P. R. (2019), “Monetary policy and below-target inflation”, speech at the Bank of Finland conference on Monetary Policy and Future of EMU, 2 July.
- [4]For an assessment of the ECB strategy prior to and during the crisis, see Draghi, M. (2019), “Twenty years of the ECB’s monetary policy”, speech at the ECB Forum on Central Banking, Sintra, 18 June. For a more detailed assessment of the 20 years of ECB monetary policy, see also Hartmann, P. and Smets, F. (2019), “The first twenty years of the European Central Bank: monetary policy”, Working Paper Series, No 2219, ECB; and Rostagno, M., Altavilla, C., Carboni, G., Lemke, W., Motto, R., Saint Guilhem, A. and Yiangou, J. (2019), “A tale of two decades: the ECB’s monetary policy at 20”, Working Paper Series, No 2346, ECB.
- [5]Excellent discussions on the drivers behind the decline are provided by, among others, Rachel, L. and Summers, L. (2019), “On Falling Neutral Real Rates, Fiscal Policy, and the Risk of Secular Stagnation”, Brookings Papers on Economic Activity, BPEA Conference Drafts, March; and Brand, C., Bielecki, M. and Penalver, A. (2018), “The natural rate of interest: estimates, drivers, and challenges to monetary policy”, Occasional Paper Series, No 217, ECB.
- [6]For a discussion of how the post-crisis shift in risk appetite and regulatory reforms has contributed to the increased preference for safe assets, see Lane, P. R. (2019), “Determinants of the real interest rate”, speech at the National Treasury Management Agency, Dublin, 28 November.
- [7]See Ajevskis, V. (2018), “The Natural Rate of Interest: Information Derived from a Shadow Rate Model”, Working Paper Series, No 02, Latvijas Banka; Brand, C., Goy, G. and Lemke, W. (2020), “Natural Rate Chimera and Bond Pricing Reality”, DNB Working Paper Series, No 666, De Nederlandsche Bank; Brand, C. and Mazelis, F. (2019), “Taylor-rule consistent estimates of the natural rate of interest”, Working Paper Series, No 2257, ECB; Fiorentini, G., Galesi, A., Pérez-Quirós, G. and Sentana, E. (2018), “The Rise and Fall of the Natural Interest Rate”, Working Paper Series, No 1805, Center for Monetary and Financial Studies; Geiger, F. and Schupp, F. (2018), “With a Little Help from My Friends: Survey-Based Derivation of Euro Area Short Rate Expectations at the Effective Lower Bound”, Discussion Paper Series, No 27, Deutsche Bundesbank; Holston, K., Laubach, T. and Williams, J. C. (2017), “Measuring the Natural Rate of Interest: International Trends and Determinants”, Journal of International Economics, Vol. 108, Supplement 1, S59-S75; Jarociński, M. (2017), “VAR-based estimation of the euro area natural rate of interest”, mimeo, ECB; and Johannsen, B. K. and Mertens, E. (2018), “A Time Series Model of Interest Rates with the Effective Lower Bound”, BIS Working Papers, No 715, Bank for International Settlements.
- [8]See Coenen, G., Montes-Galdon, C. and Smets, F. (2020), “Effects of state-dependent forward guidance, large-scale asset purchases and fiscal stimulus in a low-interest-rate environment”, Working Paper Series, No 2352, ECB.
- [9]See Ehrmann, M., Gaballo, G., Hoffmann, P. and Strasser, G. (2019), “Can More Public Information Raise Uncertainty? The International Evidence on Forward Guidance”, Journal of Monetary Economics, Vol. 108, pp. 93-112. This paper reviews the experience of major central banks with deploying rate forward guidance based on different forms of conditionality – open-ended, time-based over short/long horizons and threshold-based – and provides an assessment of its effectiveness by comparing the impact on the responsiveness of bond yields to macroeconomic news.
- [10]Since the refinancing rate in the TLTRO programme is linked to the policy rate for the main refinancing operations, the attractiveness of TLTRO funding conditions also adjusts in response to these shifts in market expectations.
- [11]For example, in Zlobins, A. (2019), “Macroeconomic Effects of the ECB’s Forward Guidance”, Working Paper Series, No 03, Latvijas Banka, the author evaluates the macroeconomic effects of rate forward guidance in the euro area and analyses its interplay with asset purchases using a set of structural vector auto-regressions with both constant and time-varying parameters. His findings suggest that the ECB’s rate forward guidance has contributed to reducing yields significantly and raising activity and inflation, with evidence also suggesting that the introduction of the APP considerably enhanced the credibility of forward guidance.
- [12]The chart shows the 15th to 85th percentiles of the predictive density of future interest rate paths, which are generated using linear interpolation through risk-neutral option-implied distributions around the three-month EURIBOR at a 6, 9, 12 and 18-month horizon. More specifically, risk-neutral densities are derived by the ECB using options on EURIBOR futures for fixed expiration dates and then interpolated for fixed horizons. As usual, risk-neutral probabilities typically differ from actual or physical probabilities.
- [13]In particular, in Bottero, M., Minoiu, C., Peydro, J.-L., Presbitero, A. and Sette, E. (2019), “Negative Monetary Policy Rates and Portfolio Rebalancing: Evidence from Credit Register Data,” IMF Working Papers, No WP/19/44, International Monetary Fund, the authors find evidence, based on administrative credit data from Italy, that the negative interest rate policy has expansionary effects on credit supply – and hence the real economy – through a portfolio rebalancing channel.
- [14]See Altavilla, C., Burlon, L., Giannetti, M. and Holton, S. (2019), “Is there a zero lower bound? The effects of negative policy rates on banks and firms,” Working Paper Series, No 2289, ECB.
- [15]See my discussion in Lane, P. R. (2019), “The yield curve and monetary policy”, public lecture for the Centre for Finance and the Department of Economics at University College London, 25 November.
- [16]See Altavilla, C., Andreeva, D. C., Boucinha, M. and Holton, S. (2019), “Monetary policy, credit institutions, and the bank lending channel in the euro area”, Occasional Paper Series, No 222, ECB.
- [17]See de Guindos, L. (2019), “Challenges for bank profitability”, speech at the OMFIF City Lecture, London, 1 May.
- [18]The annual gross savings for banks from the two-tier system are estimated to amount to up to €4 billion in 2020 compared with the counterfactual projection if the system had not been introduced. These savings more than offset the additional gross excess liquidity charge of around €1 billion that resulted from the September cut of the deposit facility rate by 10 basis points.
- [19]See Brunnermeier, M. and Koby, Y. (2018), “The Reversal Interest Rate”, Working Paper Series, No 25406, National Bureau of Economic Research.
- [20]For a more detailed discussion of the channels of transmission of the APP and its impact on the euro area yield curve, see Lane, P. R. (2019), “The yield curve and monetary policy”, public lecture for the Centre for Finance and the Department of Economics at University College London, London, 25 November.
- [21]See Bernanke, B., op. cit.
- [22]See Eser, F., Lemke, W., Nyholm, K., Radde, S. and Vladu, A. L. (2019), “Tracing the impact of the ECB’s asset purchase programme on the yield curve”, Working Paper Series, No 2293, ECB.
Banco Central Europeo
Dirección General de Comunicación
- Sonnemannstrasse 20
- 60314 Frankfurt am Main, Alemania
- +49 69 1344 7455
- media@ecb.europa.eu
Se permite la reproducción, siempre que se cite la fuente.
Contactos de prensa