


- THE ECB BLOG
Fiscal policy: from free to affordable lunch
4 January 2023
Borrowing has become more expensive for governments. But despite rising interest rates, government debt can remain on a sound path. The ECB Blog discusses what constitutes a favourable balance between debt costs and economic growth.
Government borrowing rates have increased sharply on the back of high inflation and the normalisation of monetary policy. Investors have also become more averse to holding riskier assets. Moreover, they pay attention to the sustainability of government debt, especially in countries with large outstanding liabilities. Both aspects have contributed to higher sovereign bond spreads. Further downgrades to the economic outlook could exacerbate this trend. Yet, these developments are only one part of the story. Another aspect to consider is that higher inflation tends to improve some headline figures of fiscal sustainability. In particular, for a given amount of outstanding debt, a higher nominal GDP means that the debt-to-GDP ratio falls.[1]
This blog post assesses how these opposing factors affect public debt sustainability. What matters most is the different speeds at which debt servicing costs and nominal GDP increase in times of inflation. Higher borrowing rates only apply to newly issued debt (i.e. affect the marginal borrowing rate). Because of that, the average financing costs of euro area governments have remained relatively low, as governments have locked-in lower rates.[2] However, looking further ahead government borrowing costs will eventually increase as the debt stock is refinanced at higher interest rates. In addition to that the interest rates paid by governments on new debt depend also on the soundness of their fiscal position. Higher indebtedness can push up credit spreads to levels where debt dynamics deteriorate, even in the absence of other economic shocks.[3] Another aspect to consider is that governments need to find lenders when they refinance the flow of maturing debt. Experience has shown that when government access to capital markets deteriorates, the terms at which a country borrows can undermine its fiscal sustainability.[4]
A good balance between interest (i) and growth (g) helps to keep debt under control
One major determinant of public sector debt sustainability is how the cost of debt compares to the resources available to service it. As long as the nominal average interest rate on government debt (i) is smaller than the nominal GDP growth rate (g), a country’s government debt-to-GDP-ratio may remain stable even with a primary budget deficit.[5] This gap is widely known as the “interest-growth (i-g) differential”.
In the euro area, average government borrowing costs have been lower than GDP growth rates in recent years. And in spite of recent increases in market rates, average interest costs are still projected to remain below growth rates for some time to come (see Chart). There are two reasons for this. First, euro area governments have increased the maturity of their debt in recent years, and so it takes longer for higher market yields to affect the cost of the overall debt stock. Second, bond yields have risen by less than inflation so far, and high inflation also boosts nominal growth. This also increases nominal government revenues, making it easier to service the debt.
Chart
Growth rates are expected to exceed interest rates for the coming years. In the long run the interest rate-growth differential is sensitive to fiscal policy.
Past and projected i-g under different fiscal policy scenarios (percentage points)(projection solid lines: gradual fiscal consolidation, dashed lines: no fiscal consolidation)
Percentages
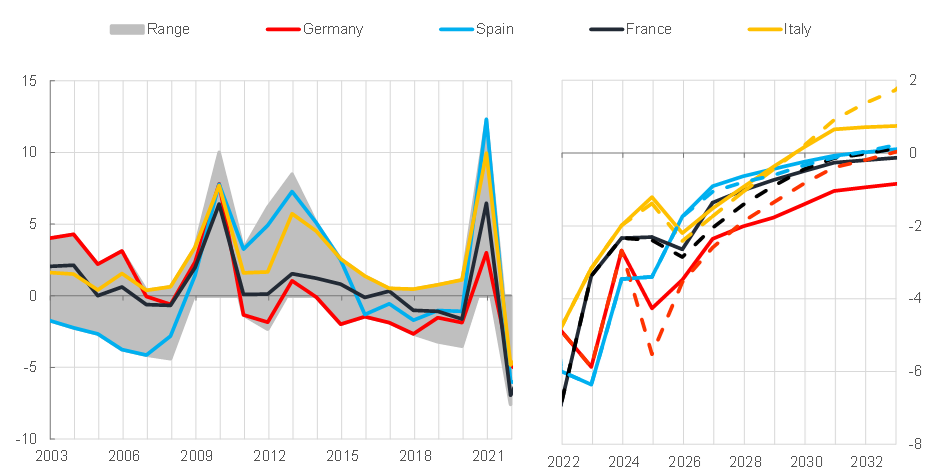
Source: Eurostat, ECB and ECB staff calculations
Notes: ‘Range’ the largest 11 euro area economies. Projections are derived from the current yield curve in the ‘sound fiscal policy’ scenario (baseline of the Eurosystem DSA; solid lines) while additionally accounting for fiscal feedback loops to i in the ‘no-policy-change’ scenario (dashed lines); g is the annual nominal annual growth rate; medium-term projections are based on BMPE (December 2022) in the two scenarios.
Over the medium term, however, both of these favourable effects are set to fade. Eventually, higher marginal borrowing rates will be passed on to the average cost of debt as the debt stock is rolled over (raising i), and inflation is expected to fall (lowering nominal growth, g). According to recent ECB staff projections, the i-g differentials of the largest four euro area economies will increase to pre-pandemic levels only by between 2025 and 2027.
Investors demand higher interest (i) for higher public debt levels
So, everything is fine and there is nothing to worry about when we think about debt sustainability? Well – it depends. In our baseline projections, we use today’s market-implied expectations about the future interest rate environment. The outlook for g corresponds to ECB staff’s projections of growth and inflation over the near- to long-run. But crucially, also the conduct of fiscal policy will affect the prospects for the i-g differential. Having nominal growth rates persistently higher than interest rates (negative i-g differentials) could potentially give rise to a fiscal 'free lunch', as it allows larger budget deficits in the near-term while the debt-to-GDP ratio can fall again over time.[6] But, this is only true if additional debt does not cause i to rise above g.[7]
Higher debt can worsen the balance between i and g by raising the supply of, and hence the yield on, government bonds, which ultimately raises the average interest cost. We have estimated this relationship for the euro area. A 10 percentage point rise in the debt-to-GDP ratio is consistent with a 20 basis points increase in yields – but only for issuers with a relatively low debt stock. For highly indebted countries it means an increase of 65 basis points. In other words, piling up more debt can make borrowing for governments more expensive (i).[8] Moreover, higher public debt can discourage private investment, leading to lower growth (g). The level of outstanding debt thus affects i-g.[9]
Favourable debt dynamics depend on sound fiscal policies.
This suggests that favourable i-g dynamics can only be expected in scenarios in which countries pursue a gradual return to sound fiscal positions (illustrated by the gradual fiscal consolidation scenario in the Chart). But if fiscal deficits stay elevated, the i-g dynamic is projected to become unfavourable. This is especially the case for euro area countries with high levels of debt. If further increasing, these debt levels can gradually raise the average borrowing cost, tighten borrowing conditions for firms and households, and reduce growth.
Subscribe to the ECB blogThe views expressed in each blog entry are those of the author(s) and do not necessarily represent the views of the European Central Bank and the Eurosystem.
-
The debt-to-GDP ratio is based on nominal GDP, whereas nominal GDP, in turn, is defined as GDP accounted at current prices. The measure of inflation implied in nominal GDP, the GDP deflator, is different from the inflation of the Harmonized Consumer Price Index (HICP), the inflation measure targeted by the ECB’s monetary policy. According to ECB staff projections conducted in December 2022, the HICP index is projected to increase at a rate that is higher than the GDP deflator. The difference between the two inflation measures can mainly be attributed to higher import prices which affect HICP inflation more directly than the GDP deflator. Consequently, inflation has had a weaker effect on the nominal debt-to-GDP ratio than suggested by HICP inflation prints and forecasts.
-
Over past years, with historically low interest rates, the euro area government sector has increasingly issued new debt at longer maturities to lock-in favourable financing conditions. For instance, public sector bonds issued in the four largest euro area economies have an average remaining maturity from 7 years (in Italy) to more than 8 years (in France). This implies that approximately 12 to 14 percent of the stock of government bonds in these countries redeems and needs refinancing each year. This compares to an average remaining maturity of the US Treasury market of only 5 years, implying a yearly refinancing need of roughly 20 percent of the marketable debt stock. In addition to these considerations, some jurisdictions have issued a non-negligible amount of either floating rate instruments (FRNs) and/or inflation-linked bonds and are hence more sensitive than others to the current environment or sharp rising interest and inflation rates.
-
See Atif R. Mian, Ludwig Straub, and Amir Sufi, 2022. "A Goldilocks Theory of Fiscal Deficits," NBER Working Papers 29707.
-
See e.g. Antonio Bassanetti, Carlo Cottarelli, Andrea F Presbitero, 2019. “Lost and found: market access and public debt dynamics,” Oxford Economic Papers, 71(2): 445-471 or Carmine Gabriele, Aitor Erce, Marialena Athanasopoulou, and Juan Rojas, 2017. "Debt Stocks Meet Gross Financing Needs: A Flow Perspective into Sustainability," ESM Working Papers No. 24.
-
The primary deficit is the difference between the government’s revenues and expenditures, excluding debt servicing costs.
-
See, for instance, Olivier Blanchard, 2019. “Public debt and low interest rates,” American Economic Review, 109(4): 1197–1229.
-
See Mian et al (2022)
-
This elasticity is labelled φ by Mian et al (2022) who argue that not i<g, but i<g-φ is the pre-condition for a fiscal “free lunch”. The higher elasticity found in the data arguably reflects the price of sovereign credit risk, which tends to be lower in jurisdictions with a lower debt stock.
-
Also see Checherita-Westphal and Domingues Semeano (2020). The paper provides a wide range of descriptive statistics on 𝑖−𝑔 for the euro area and other advanced economies. Based on panel BVAR analysis, the authors show that high-debt countries consistently present the highest (and a larger probability of positive) differentials.