
22 July 2020
RESEARCH BULLETIN NO. 73
How do financial markets react to monetary policy signals?
We map ECB policy communications onto yield curve changes and study the information flow on monetary policy decision dates. We find that different monetary policy measures exert effects on different segments of the interest rate term structure, with policy rate changes mostly influencing the short end of the curve and quantitative easing measures acting more on the long end. The impact of forward guidance policies, by contrast, reaches its peak at intermediate maturities. A very useful by-product of this work is the publicly available Euro Area Monetary Policy Event-Study Database (EA-MPD), containing intraday asset price changes.
How to map policy communications onto financial market effects
Mapping central bank communication onto yield curve movements is challenging: it is difficult to isolate the component of market participants’ expectations that is exclusively driven by policy actions. The European Central Bank (ECB) has a unique way of communicating its monetary policy decisions – first announcing the policy decision in a press release and then then explaining the policy decision further in a press conference. This offers a natural way of separating the financial market effects of the change in policy rates from the effects associated with other policy actions and communication, by employing intraday data. Past research, going back to Kuttner (2001) and Gürkaynak et al. (2005) for the United States and Brand et al. (2010) for the euro area, has focused on identifying the effect of monetary policy surprises on asset prices. In a nutshell, these studies collect data at different times on the same day, i.e. before and after a monetary policy decision, to isolate the effect of monetary policy.
The implicit assumption in many of the existing papers is that a policy meeting is perceived to convey a single policy message, for example about immediate policy rate changes, and that this is a constant feature of policy meetings through time. This implies that there has been little emphasis so far on the presence of multiple policy messages and their effects over the various maturities of the yield curve. Similarly, there has been little emphasis on the combination composition of policy instruments, and on the fact that the number and type of messages may change over time due to the introduction of new policy instruments.
In a recent paper Altavilla et al. (2019) make use of the newly constructed Euro Area Monetary Policy Event-Study Database (EA-MPD), to ask how many dimensions of policy action and communication market participants perceive in press releases and press conferences following Governing Council policy meetings. We show how to interpret policy surprises through the lens of the footprint they leave on the yield curve. The results dovetail with the general understanding of how the ECB policy communication is designed to operate.
Findings from the new Euro Area Monetary Policy Event-Study Database
High-frequency data, i.e. data collected at different times on the same day, are an essential input for studying the effects of monetary policy communication. Recent studies for the euro area analysing the effect of policy surprises on a limited number of asset prices include Andrade and Ferroni (2018), Cieslak and Schrimpf (2018), and Jarociński and Karadi (2020). These studies all required an enormous investment in preliminary data to identify the effect of policy surprises.
This section briefly introduces the new resource, the Euro Area Monetary Policy Event-Study Database (EA-MPD), developed in a recent study by Altavilla et al. (2019). The database makes available – and regularly updates – intraday asset price changes around ECB policy announcements for a wide range of assets.
Monetary policy announcements work differently in the euro area than in the United States. While in the United States the monetary policy decisions and the statement explaining the decisions are made public at the same time, the ECB announces the policy decision and the explanatory statement at different times. The press release containing the policy decisions (including, since March 2016, the policy decisions concerning non-standard measures) is released at 13:45 CET. It is then followed by a press conference that begins at 14:30 CET, when the ECB President reads a statement and conducts a Q&A session. The ECB press conference statement is similar to the US FOMC statement in providing a rationale for the policy decision, and presenting an outlook that market participants often find informative concerning the future course of monetary policy.
Using high-frequency intraday data, we measure changes in asset prices over three time windows: the press release window, the press conference window, and the window of both together, called the monetary event window.[2] The EA-MPD reports the asset price/yield changes we measure for the three event windows in separate worksheets.[3]
To provide an illustration of the intraday data, Chart 1 shows the two-year Overnight Index Swap (OIS) rate on four different monetary policy meeting dates – 4 July 2013, 4 September 2014, 3 December 2015 and 7 September 2017. We select the two-year rate as this maturity is sufficient for the rate to display movements in response to announcements of non-standard as well as standard monetary policy measures. The EA-MPD reports changes around the two vertical lines, denoting the times of the press release and the press conference. Chart 1 makes it clear why these two windows should be separated.
Examples of market reactions across different policy events

Note: The figure shows the intraday movement (percentage points on the y-axis, trading hours on the x-axis) in the two-year OIS rate during four selected monetary policy decision dates. The solid vertical line marks the publication of the press release; the dashed vertical line marks the beginning of the press conference.
The four panels in the chart are illustrative of the different situations in which monetary policy surprises may arise during the policy meeting day.
Panel (a) shows no reaction of the two-year OIS rate during the press release window but a reaction in the conference window. This episode corresponds to the first time ever that the ECB announced at its press conference formal forward guidance on the future path of its policy rates, by stating that policy rates were expected to remain at present or lower levels for an extended period of time.
Panel (b) shows a reaction in the press release window, with no further news affecting the OIS rate in the press conference window. This episode corresponds to the announcement in the press release of a cut in the ECB deposit rate.
Panel (c) depicts a policy date on which there are sizeable movements in both windows. This episode captures the financial markets’ disappointment following the ECB decision to increase the size of its quantitative easing (QE) programme and decrease the interest rate on the deposit facility. This was a clear deviation from survey expectations among financial analysts gathered ahead of the policy meeting. Markets were expecting a larger cut in the policy rate (accordingly the yields moved up during the press release window) as well as a larger increase in QE (the related disappointment reinforced the upward movement in yields during the press conference window).
Lastly, panel (d) shows a day on which there is no surprise, either in the press release or the conference windows. Policy dates like these are surprisingly rare – there is usually some news for the financial markets, especially in the press conference window.
The transmission of monetary policy surprises across the interest rate term structure
The study by Altavilla, Brugnolini, Gürkaynak, Motto and Ragusa (2019) makes use of the newly constructed EA-MPD, explained in the previous section, to investigate how financial markets react to policy actions and communications in the press release and press conference following ECB Governing Council policy meetings. It uses the sample running from January 2002 to September 2018. The EA-MPD is kept up-to-date and now includes monetary policy surprises up to June 2020.
In order to characterise the yield curve reaction to different policy announcements Altavilla, et al. (2019) employ a factor analysis. Factor analysis is a statistical technique that aims at reducing the information contained in a large number of variables into a limited set of underlying variables that are called factors. These factors are extracted so as to maximise the common variance from all variables. In our case, for example, we first collect the reaction of yields on the risk-free curve at various maturities to each official policy communication and then extract a few factors to characterise the typical response of these yields to policy events that share similarities.
Once estimated, we propose a structural identification of these factors and we find surprises that resemble policy rate change, forward guidance and QE policies. We find that in the period January 2002 to September 2018 market participants perceived the press release to contain a single piece of information (mainly related to policy rate changes). However the press conference was not unidimensional – there was never only one “communication” factor. Market participants always extracted two dimensions of information from the press conference and a third was added after the advent of QE. To understand what these factors were, and ultimately give an economic interpretation, we use the methods developed by Gürkaynak et al. (2005) and Swanson (2017).
Chart 2 shows that the estimated footprint that monetary policy measures leave on the yield curve varies across the two event windows. The press release window features a factor related to the surprise in the immediate setting of the policy rate, affecting short rates heavily and having little effect on long-term interest rates. We label it “target”, as this factor is similar to the behaviour of the target factor in the United States identified by Gürkaynak et al. 2005. In the press conference window, we find two statistically significant factors that have always been present, and the QE factor which became statistically significant after the announcement of the QE policy in January 2015.
The two factors that have always been present, even before forward guidance became an explicit ECB monetary policy tool, can be understood as both being forward guidance surprises, but with different flavours. It turns out that financial markets have always perceived a short-term and a longer-term forward guidance factor. We call the first factor, which has its peak effect around the six-month maturity and has little effect on long-term interest rates, “timing”. This is to differentiate it from the second factor, now commonly called “forward guidance”, which has a peak effect at two years and significantly affects long-term interest rates. For the QE factor, by contrast, the longer the maturity, the larger the effect. This is consistent with QE implementation in the euro area, where the average maturity of the securities bought has been about eight years.
We therefore find that there have always been multiple “communications”, even before explicit forward guidance and QE became part of the ECB toolkit. This raises the question: did the way asset prices respond to change after forward guidance became an explicit policy tool? Our work suggests that market responses to a given communication surprise have been fairly stable. That is, a forward guidance surprise has over time elicited more or less the same financial market response in different sub-samples – in terms of risk-free rates, sovereign yields, exchange rates – but there have been relatively more forward guidance surprises since the onset of the Global Financial Crisis.
The footprint of monetary policy actions on the yield curve
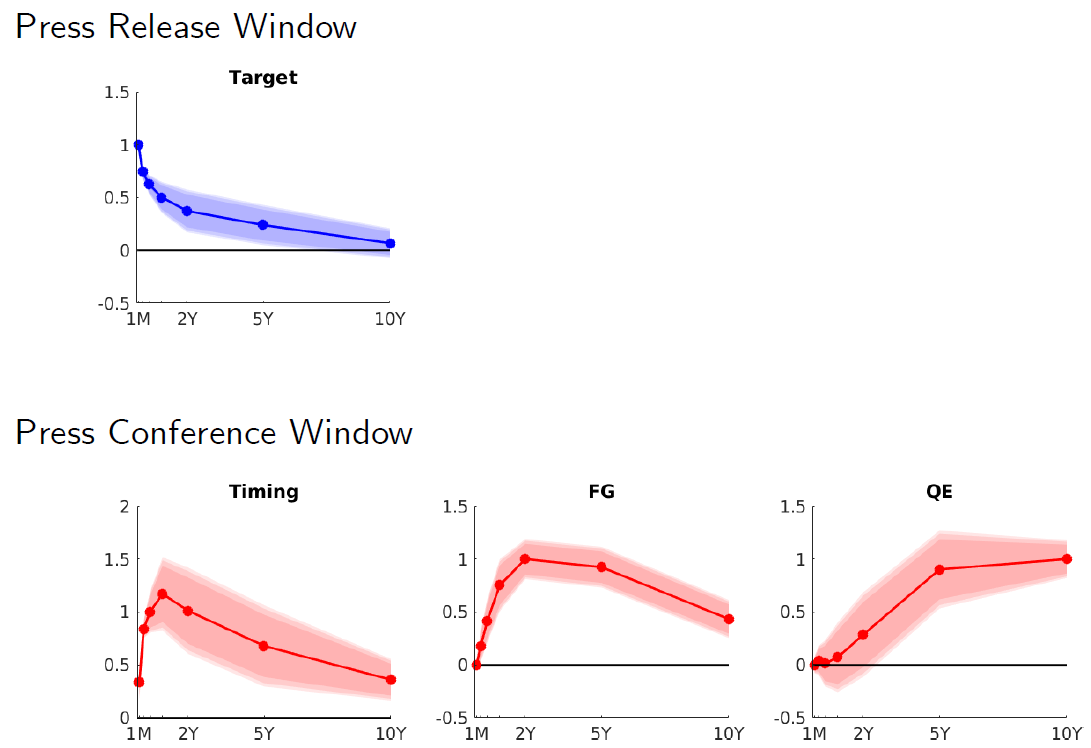
Note: The figure shows the typical reaction of yields at different maturities during the press release window (first row) and the press conference window (second row), in basis points. The “target” and “timing” factors are normalised to have a unit effect on the one-month and six-month OIS rates, respectively. The forward guidance and QE factors are normalised to have a unit effect on the two-year and on the ten-year yields, respectively. The shaded areas indicate the 90% confidence intervals.
Using the methodology on other, unofficial central bank communications
As shown in Altavilla et al. (2019) the methodology summarised in the previous sections is flexible enough to be easily generalised to the analysis of any policy communication, including policy speeches and market news. Financial markets react to many kinds of news about monetary policy and we can parse them according to the same dimensions we have identified for the Governing Council’s communication.
Two events illustrate the point. The first is a speech given by Mario Draghi on 27 June 2017, at the ECB Forum on Central Banking in Sintra, entitled “Accompanying the economic recovery”. The second is a Bloomberg news article by Jana Randow, Alessandro Speciale and Jeff Black that was released on 4 October 2016 and hinted at a decision on tapering by the ECB.
Given the estimated effect of each factor for the different surprises we now have in hand, we can ask which combination of factors best explains the observed market reaction. The answer is shown in Chart 3, where the magnitudes of the effects are shown as fractions of the average absolute value of each type of surprise. This makes each factor reading comparable to other readings of the same factor (but magnitudes cannot be made comparable across factors).
This proof of concept exercise shows that any policy-relevant news can be broken down into policy surprise factors once the initial factor extraction exercise is carried out. For example, we can now say that the Draghi speech was seen as a very large QE event – its size is twice the in-sample average for such surprises.
Surprise breakdown over non-Governing Council events
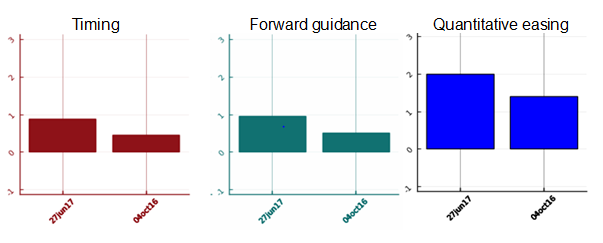
Note: The figures show the estimated factor decomposition into the timing, forward guidance and QE factors of the two monetary policy events not included in our sample. In each subplot the first bar is for the June 2017 Draghi speech and the second one is for the October 2016 Bloomberg news article.
Conclusions and policy implications
The two-stage nature of ECB policy news dissemination turns out to be helpful in identifying the market response to monetary policy announcements. Rather than assuming the presence of predefined surprises in different windows, we estimated and identified these, finding a multi-faceted information structure in the press conference window.
We find that in our sample (from January 2002 to September 2018) the target surprises are dominant in the announcement window, but that in the press conference window this factor does not even exist. In fact, in the press conference window news about the future path of policy was the main driver of yield changes until QE was introduced, with QE then adding a new factor.
Importantly, we estimate and identify the footprint that different monetary policy announcements leave on the yield curve. While changes in the policy interest rate mostly influence the short maturities of the curve, the impact of forward guidance policies reaches its peak at intermediate maturities. Quantitative easing measures, by contrast, exert their maximum impact at long maturities.
We also showed how to use the policy surprise factors we identified to analyse any policy communication, such as speeches or market news, and demonstrated that the EA-MPD is a useful resource for studying future rounds of monetary policy measures and assessing the relative effectiveness of the policies announced.[4]
References
Altavilla, C., Brugnolini, L., Gürkaynak, R., Motto, R. and Ragusa, G. (2019), “Measuring euro area monetary policy”, Journal of Monetary Economics, No 108, pp.162-179.
Andrade, P. and Ferroni, F. (2018), “Delphic and Odyssean Monetary Policy Shocks: Evidence from the Euro Area”, Federal Reserve Board of Chicago Working Papers, No. WP-2018-12.
Brand, C., Buncic, D. and Turunen, J. (2010), “The impact of the ECB monetary policy decisions and communication on the yield curve”, Journal of the European Economic Association, No 8, pp. 1266-98.
Cieslak, A. and Schrimpf, A. (2018), “Non-Monetary News in Central Bank Communication”, NBER Working Papers, No. 25032.
Gürkaynak, R., Sack, B., and Swanson, E. (2005), “Do actions speak louder than words? The response of asset prices to monetary policy actions and statements”, International Journal of Central Banking, No 1, pp. 55-93.
Jarociński, M., and Karadi, P. (2020), “Deconstructing Monetary Policy Surprises—The Role of Information Shocks”, American Economic Journal: Macroeconomics, No 12, pp. 1-43.
Kuttner, K., (2001), “Monetary policy surprises and interest rates: Evidence from the fed funds futures market”, Journal of Monetary Economics, No 47, pp. 523-44.
Swanson, E. (2017), “Measuring the effects of Federal Reserve Forward Guidance and Asset Purchases on Financial Markets”, NBER Working Papers, No. 23311.
- [1]The article was written by Carlo Altavilla (Head of Section, Monetary Analysis Division, Directorate General Monetary Policy, European Central Bank and CEPR), Luca Brugnolini, Refet S. Gürkaynak (Bilkent University), Roberto Motto (Head of Section, Monetary Policy Strategy Division, Directorate General Monetary Policy, European Central Bank) and Giuseppe Ragusa (University of Pisa). The authors gratefully acknowledge the comments of Marek Jarocinski, Alberto Martin and Louise Sagar. The views expressed here are those of the authors and do not necessarily represent the views of the European Central Bank or the Eurosystem.
- [2]In constructing the database, we first cleanse the data of misquotes – which were prevalent especially in the first years of the ECB operations – then report in the EA-MPD the changes from the pre-event quote to the post-event quote for each communication window. The quotes are the median prices/yields in each event interval, where we discretise the data by taking the last quote for each minute in the interval.
- [3]The market indicators covered are the rates on Overnight Index Swaps (OIS) with maturities of 1, 3 and 6 months and 1 to 10 years, 15 and 20 years, German Bunds with maturities of 3 and 6 months and 1 to 10 years, 15, 20 and 30 years, French, Italian, and Spanish sovereign bonds with maturities of 2, 5, and 10 years, the stock market price index and the stock price index comprising only banks, as well as the exchange rate of the euro.
- [4]We hope that the dataset, which we will update regularly, will encourage more research on monetary policy and its effects in the euro area. For example, the dataset could be useful in the study of the following questions, which continue to be important for academics and policymakers alike: the effects of monetary policy on markets in different euro area countries; how these differ according to the fundamentals of those countries; the central bank information effects, i.e. how central banks affect market beliefs about economic fundamentals; identifying VAR-based real effects; and the transmission of ECB policies to non-euro area countries.