
- Press release
- 8 January 2019
Euro area quarterly balance of payments and international investment position: third quarter of 2018
- The current account of the euro area showed a surplus of €376 billion (3.3% of euro area GDP) in the four quarters to the third quarter of 2018, compared with a surplus of €347 billion (3.1% of euro area GDP) a year earlier.
- As regards geographic counterpartsin the four quarters to the third quarter of 2018 the euro area current account recorded the largest bilateral surpluses vis-à-vis the United Kingdom (€147 billion, declining from €165 billion a year earlier) and the United States (€124 billion, increasing from €89 billion), while the largest deficit was registered vis-à-vis China (€67 billion, declining from €74 billion).
- At the end of the third quarter of 2018 the international investment position of the euro area recorded net liabilities of €593 billion (around 5% of euro area GDP), compared with net liabilities of €670 billion at the end of the previous quarter.
Current account
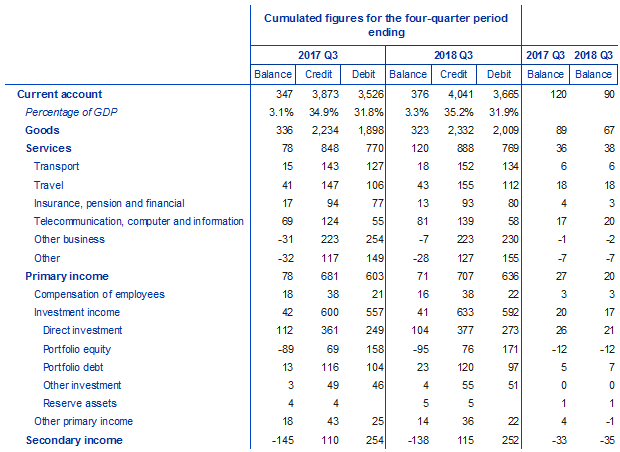
The current account of the euro area showed a surplus of €376 billion (3.3% of euro area GDP) in the four quarters to the third quarter of 2018, compared with a surplus of €347 billion (3.1% of euro area GDP) a year earlier (see Table 1). The increase in the current account surplus reflected a higher surplus for services (increase from €78 billion to €120 billion) and a lower deficit for secondary income (decrease from €145 billion to €138 billion). These developments were partly offset by declines in the surpluses for goods (from €336 billion to €323 billion) and primary income (from €78 billion to €71 billion).
The larger surplus in services resulted mainly from a decrease in the deficit for other business services (from €31 billion to €7 billion) and an increase in the surplus for telecommunication, computer and information services (from €69 billion to €81 billion).
The decline in the primary income surplus was due to small decreases in the surpluses of all its components, namely compensation of employees (from €18 billion to €16 billion), investment income (from €42 billion to €41 billion) and other primary income (from €18 billion to €14 billion), the latter mostly related to transactions with the EU institutions. The developments in investment income reflected mainly a decrease in the surplus for direct investment income (from €112 billion to €104 billion) and a larger deficit in portfolio equity income (from €89 billion to €95 billion), which were partly offset by a larger surplus for portfolio debt income (from €13 billion to €23 billion).
Current account of the euro area
(EUR billions, unless otherwise indicated; transactions during the period; non-working day and non-seasonally adjusted)
Source: ECBNote: “Equity” comprises equity and investment fund shares. Discrepancies between totals and their components may arise from rounding.
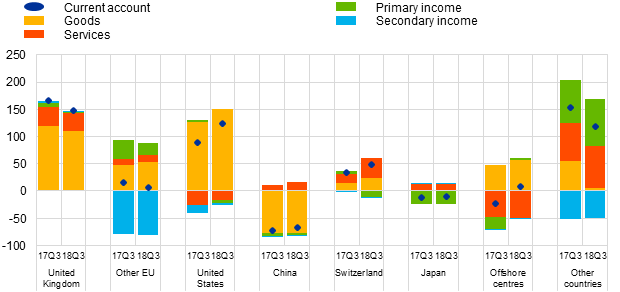
Data on the geographic counterparts of the euro area current account (see Chart 1) show that in the four quarters to the third quarter of 2018 the euro area recorded the largest surpluses vis-à-vis the United Kingdom (€147 billion, declining from €165 billion a year earlier), the United States (€124 billion, increasing from €89 billion), a residual group of other countries (€118 billion, declining from €152 billion), and Switzerland (€49 billion, increasing from €34 billion). The largest bilateral deficit in the euro area current account was recorded vis-à-vis China (€67 billion, declining from €74 billion). The current account balance vis-à-vis offshore centres moved from a deficit of €23 billion to a surplus of €9 billion in the period under review.
The most significant geographic changes in the goods balance in the four quarters to the third quarter of 2018 compared to the previous year were a decline in the goods surplus vis-à-vis other countries (from €55 billion to €5 billion) and an increase in the goods surplus vis-à-vis the United States (from €126 billion to €150 billion). In services, the surplus vis-à-vis Switzerland increased from €17 billion to €37 billion. Moreover, the primary income balance vis-à-vis offshore centres moved from a deficit of €22 billion to a surplus of €2 billion, while this balance switched from a surplus of €5 billion to a deficit of €11 billion vis-à-vis Switzerland.
Geographical breakdown of the euro area current account balance
(Four-quarter moving sums in EUR billions; non-seasonally adjusted)
Source: ECB.Notes: “Other EU” comprises EU Member States and EU institutions outside the euro area excluding the United Kingdom.
International investment position
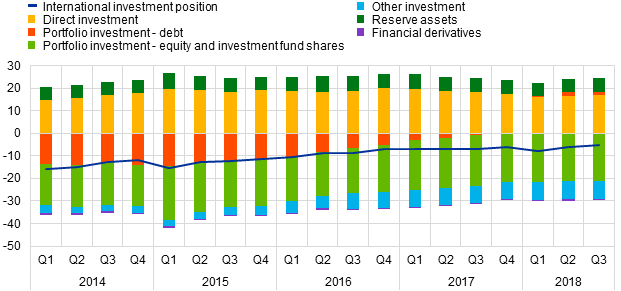
At the end of the third quarter of 2018 the international investment position of the euro area recorded net liabilities of €593 billion vis-à-vis the rest of the world (around 5% of euro area GDP), compared with net liabilities of €670 billion in the previous quarter (see Chart 2 and Table 2).
Net international investment position of the euro area
(Net outstanding amounts at end of period as a percentage of four-quarter moving sums of GDP)
Source: ECB.
This improvement of €77 billion mainly reflected higher net assets for direct investment (€1,928 billion, up from €1,907 billion) and portfolio debt (€191 billion, up from €161 billion) as well as lower net liabilities for portfolio equity (€2,407 billion, down from €2,428 billion).
International investment position of the euro area
(EUR billions, unless otherwise indicated; amounts outstanding at the end of the period, flows during the period; non-working day and non-seasonally adjusted)
Source: ECB.Note: “Equity” comprises equity and investment fund shares. Net financial derivatives are reported under assets. Discrepancies between totals and their components may arise from rounding.
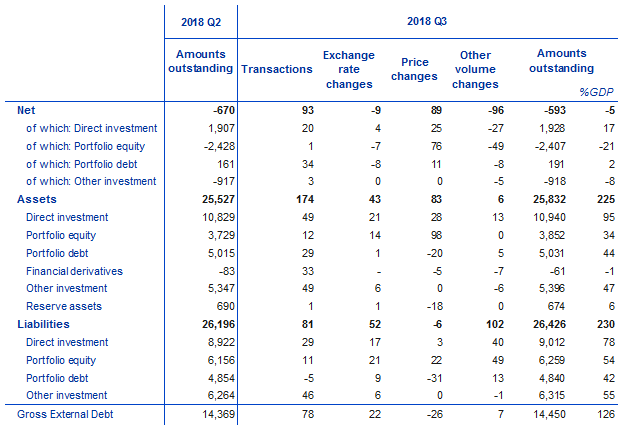
The improvement in the euro area’s net international investment position in the third quarter of 2018 was driven by transactions and net positive price changes, which were partly offset by net negative other volume changes and to a lesser extent net negative exchange rate revaluations (see Chart 3).
Net assets in direct investment and in portfolio debt increased primarily due to transactions and positive price changes (see Table 2), while lower net liabilities for portfolio equity resulted mainly from positive net developments in prices, particularly on the asset side. These developments were partly offset by negative net other volume changes, in particular for portfolio equity and direct investment.
At the end of the third quarter of 2018 the gross external debt of the euro area amounted to €14.5 trillion (around126% of euro area GDP), which represents an increase of €81 billion compared with the previous quarter.
Changes in the net international investment position of the euro area
(EUR billions; flows during the period)
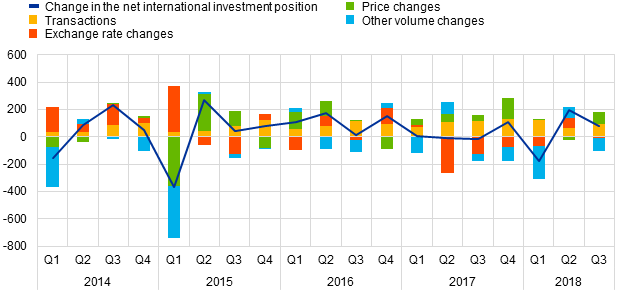
Source: ECB.Notes: Other volume changes mainly reflect reclassifications and data enhancements.
Data revisions
This press release incorporates revisions to the data for all the reference periods between the first quarter of 2017 and the second quarter of 2018. The revisions to direct investment and portfolio investment were particularly sizeable and reflect revised national contributions to the euro area aggregates, in particular for the Netherlands and Luxembourg as a result of incorporating newly available information.
Next press releases
- Monthly balance of payments: 18 January 2019 (reference data up to November 2018)
- Quarterly balance of payments and international investment position: 4 April 2019 (reference data up to the fourth quarter of 2018)
For media queries, please contact Philippe Rispal, tel.: +49 69 1344 5482.
Notes
- All data are neither seasonally nor working day-adjusted. Ratios to GDP (including in the charts) refer to four-quarter sums of non-seasonally and non-working day-adjusted GDP figures.
- Hyperlinks in the press release refer to data that may change with subsequent releases as a result of revisions.
Banque centrale européenne
Direction générale Communication
- Sonnemannstrasse 20
- 60314 Frankfurt am Main, Allemagne
- +49 69 1344 7455
- media@ecb.europa.eu
Reproduction autorisée en citant la source
Contacts médias