
Euro area quarterly balance of payments and international investment position (fourth quarter of 2017)
- The current account of the euro area showed a surplus of €387.6 billion (3.5% of euro area GDP) in 2017.[1]
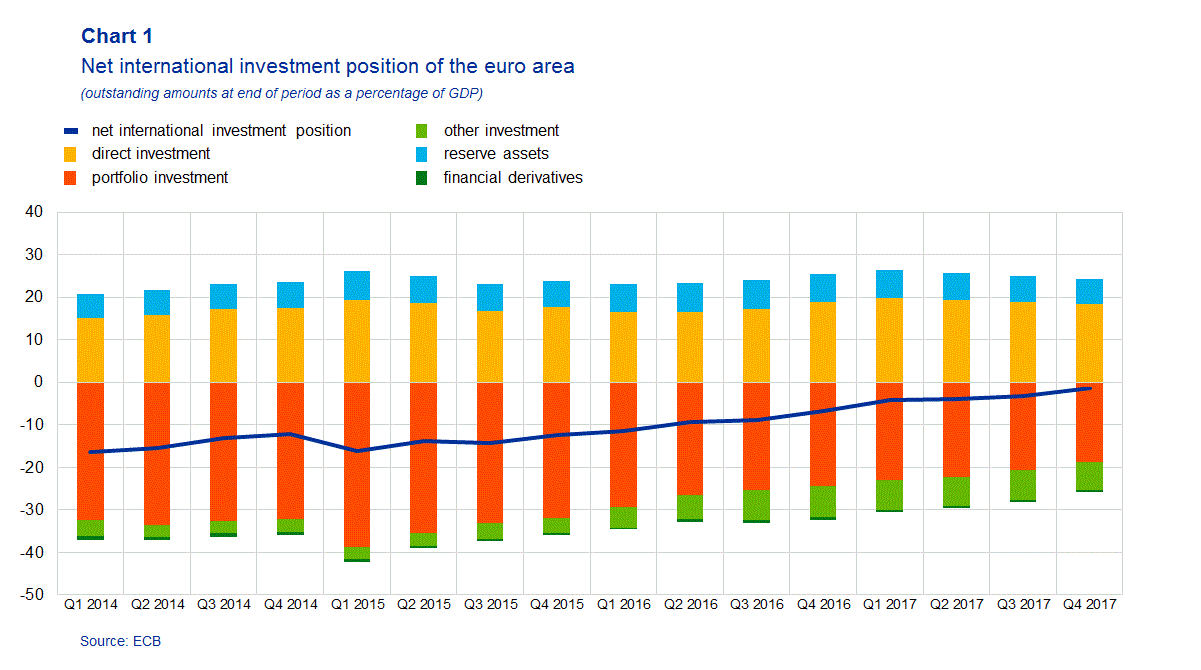
- At the end of 2017 the international investment position of the euro area recorded net liabilities of €150 billion (1.3% of euro area GDP).
Current account
The current account of the euro area showed a surplus of €133.2 billion in the fourth quarter of 2017, compared with €121.5 billion in the same quarter of 2016 (see Table 1). The increase in the current account surplus was due to larger surpluses for services (from €3.8 billion to €27.2 billion) and goods (from €96.0 billion to €99.2 billion), as well as a decrease in the deficit for secondary income (from €35.0 billion to €32.4 billion), which were partly offset by a decline in the surplus for primary income (from €56.7 billion to €39.1 billion).
The increase in the surplus for services resulted from improvements in all categories shown in Table 1, in particular from a decrease in the deficit for other business services (from €16.3 billion to €2.5 billion) and an increase in the surplus for travel (from €2.5 billion to €6.1 billion).
The decline in the primary income surplus was due to a decrease in the investment income surplus (from €34.3 billion to €24.1 billion), primarily owing to a decline in the surplus for direct investment income (from €43.2 billion to €31.5 billion), and a decrease in the surplus for other primary income (from €17.3 billion to €10.2 billion) related to transactions with the EU institutions.
In 2017 the current account of the euro area showed a surplus of €387.6 billion (3.5% of euro area GDP), almost unchanged from a surplus of €388.0 billion (3.6% of euro area GDP) in 2016. The overall stability in the current account surplus resulted from an increase in the surplus for services (from €39.5 billion to €94.7 billion) which was offset by decreases in the surpluses for goods (from €375.3 billion to €345.3 billion) and primary income (from €112.1 billion to €91.7 billion) as well as an increase in the deficit for secondary income (from €138.9 billion to €144.2 billion).
Geographical breakdown
The decrease in the surplus for the euro area goods account in 2017 compared with 2016 resulted mainly from a decline in the surpluses vis-à-vis other countries (from €52.3 billion to €11.4 billion) and the United Kingdom (from €127.2 billion to €115.6 billion), which was partly offset by an increase in the surplus vis-à-vis Switzerland (from €11.5 billion to €19.3 billion; see Table 2).
The rising surplus for services in 2017 was primarily due to an increase in the surplus vis-à-vis Switzerland (from €6.3 billion to €31.0 billion) and the United Kingdom (from €27.6 billion to €35.1 billion) as well as a decrease in the deficit vis-à-vis the United States (from €29.3 billion to €12.7 billion).
In 2017 non-euro area EU Member States accounted for around 31% of total euro area trade in goods and services, with the United Kingdom accounting for 13% of the total euro area trade. The euro area’s main trading partners in goods remained the United States for exports, closely followed by the United Kingdom (both accounting for approximately 13% of the total), and China for imports, accounting for 13% of the total (see Chart 2). As regards trade in services, the United Kingdom remained the largest recipient of euro area exports (accounting for 19% of the total) and the United States continued to be the largest source of euro area imports, accounting for 21% of the total.

International investment position
At the end of 2017 the international investment position of the euro area recorded net liabilities of €150 billion vis-à-vis the rest of the world (1.3% of euro area GDP; see Chart 1). This represented an improvement of €200 billion compared with the third quarter of 2017 (see Table 3).
This change resulted from lower net liabilities for portfolio investment (€2,095 billion, down from €2,295 billion), other investment (€724 billion, down from €768 billion) and financial derivatives (€51 billion, down from €57 billion). These movements were partly compensated by lower net assets for direct investment (€2,050 billion, down from €2,096 billion) and reserve assets (€670 billion, down from €675 billion).
The improvement in the euro area’s net international investment position in the fourth quarter of 2017 was driven by net positive transactions and price changes that were only partially offset by net negative exchange rate and other volume changes (see Chart 3). In portfolio investment, the decline in net liabilities resulted mainly from an increase on the asset side due to positive price changes and net purchases by euro area residents that were only partly compensated by negative exchange rate changes. Conversely, the decline in the net asset position for direct investment was mainly due to lower assets, resulting primarily from negative exchange rate changes that were larger than the net purchases by euro area residents. Portfolio investment and direct investment liabilities remained overall largely unchanged in the fourth quarter of 2017.
At the end of 2017 the gross external debt of the euro area amounted to €13.5 trillion (121% of euro area GDP), which represents a decrease of €226 billion compared with the third quarter of 2017, while net external debt decreased by €135 billion over the same period.

Geographical breakdown
At the end of 2017 the stock of euro area direct investment abroad (assets) was €10.6 trillion, 25% of which was invested in the United States and 20% in the United Kingdom (see Table 4). The stock of foreign direct investment in the euro area (liabilities) was €8.5 trillion, with 27% being investments from residents of the United States and 23% from offshore financial centres.
As regards portfolio investment, euro area holdings of foreign securities amounted to €8.5 trillion, largely reflecting holdings of securities issued by residents of the United States (accounting for 35% of the total), as well as by residents of the United Kingdom (16%). Non-residents’ holdings of securities issued by euro area residents stood at €10.6 trillion.
In other investment, euro area residents’ claims on non-residents amounted to €5.0 trillion, 33% of which were vis-à-vis residents of the United Kingdom and 19% vis-à-vis residents of the United States. Euro area other investment liabilities amounted to €5.7 trillion, with residents of the United Kingdom accounting for 33% of the total and residents of the United States for 14%.
Data revisions
This press release incorporates revisions to the data for all the reference periods between the first quarter of 2014 and the third quarter of 2017. The revisions to direct and portfolio investment for the period since the first quarter of 2015 are particularly sizeable and reflect improvements in the national contributions to the euro area aggregates.
Additional information
Time series data: ECB’s Statistical Data Warehouse (SDW).
Methodological information Next press releases:- Monthly balance of payments: 19 April 2018 (reference data up to February 2018).
- Quarterly balance of payments and international investment position: 4 July 2018 (reference data up to the first quarter of 2018).
Annexes
- Table 1: Current account of the euro area
- Table 2: Current and capital account of the euro area – geographical breakdown
- Table 3: International investment position of the euro area
- Table 4: International investment position of the euro area – geographical breakdown
For media queries, please contact Philippe Rispal, tel.: +49 69 1344 5482.
[1] All data are neither seasonally nor working day-adjusted. Ratios to GDP (including in the charts) refer to four-quarter sums of non-seasonally and non-working day-adjusted GDP figures.
Banque centrale européenne
Direction générale Communication
- Sonnemannstrasse 20
- 60314 Frankfurt am Main, Allemagne
- +49 69 1344 7455
- media@ecb.europa.eu
Reproduction autorisée en citant la source
Contacts médias