
Press briefing: Presentation of indicators of financial integration in the euro area
Presentation by Gertrude Tumpel-Gugerell, Member of the Executive Board of the ECB30 September 2005
Ladies and Gentlemen,
As the Vice-President has just illustrated, a well integrated financial system offers new opportunities for the banking sector, increases the efficiency of the euro area economy, contributes to a smooth and effective implementation of monetary policy and ultimately supports stronger and more sustainable non-inflationary economic growth. Against this background, the ECB has taken a proactive stance with regard to fostering European financial integration within its field of competence.
The report published today is a new initiative by the ECB. It provides an overall assessment, based on a series of indicators, of the degree of financial integration in the most important segments of the euro area financial markets, ranging from retail loans to wholesale equity trading.
These indicators will be regularly updated and published on the ECB’s website twice a year. The report will be produced on an annual basis with the aim of monitoring the progress of financial integration in the euro area.
In these reports, the range of indicators will be extended over time, in line with improvements in the availability of statistics and advances in research and general economic analysis. In particular, the addition of indicators for a number of important underlying factors of integration related to financial institutions and market infrastructures is envisaged.
Studying these underlying factors is of relevance if only because integration is generally lagging behind in the areas of retail banking and financial infrastructures. I would like to highlight this with just two examples. [Please note that the following examples are not derived from the indicators.]
First, there is a lack of integration in the European mortgage markets, which manifests itself in several ways. There is no European market in which borrowers can access the full range of mortgage products. Moreover, only a negligible portion of European mortgage credit is granted across borders, and the techniques for loan origination and servicing differ quite substantially from country to country. Given the size of the mortgage credit market, with an outstanding volume of around €4 trillion in the EU, the costs incurred through a lack of integration cannot be ignored.
Second, EU cross-border securities transaction costs are still much higher than domestic transaction costs. This is hindering the deepening and widening of the securities market, which may in turn lead to higher financing costs for firms. These higher costs can be effectively avoided by promoting the further integration of the market infrastructure.
Before turning to a review of the available integration indicators, let me briefly mention the overnight index swap market as a good example of the major role of the euro in enhancing financial market integration. Meanwhile, integration has been almost fully achieved in the money market and in the related interest rate derivatives markets. The euro overnight index swap market is one of the success stories, as it has become the largest swap market in the world, being – with a daily turnover of almost USD 300 billion[1] – nearly 50% larger than the equivalent US dollar segment.
Let me, then, broadly summarise the state of integration of the euro area financial markets as revealed by the ECB’s statistical indicators and contained in today’s publication.
Generally speaking, the market for a given financial instrument is considered fully integrated if all economic agents with the same relevant characteristics have equal access to this market, are subject to a single set of rules and are treated equally.
This definition underpins the measures proposed in the report. Two broad categories of indicator are considered: price-based and quantity-based. Price-based indicators measure discrepancies in asset prices on the basis of their geographic origin. In a perfectly integrated market, prices of assets with similar characteristics should be the same or at least largely influenced by common euro area factors. Quantity-based indicators are used to investigate the extent to which investors have internationalised their portfolios. They are a useful complement to price-based indicators, as in financially integrated markets investors will increase their holdings of non-domestic assets in order to fully reap the benefits of international diversification. In the report, the focus is on euro-denominated instruments and on price differences across euro area countries.
When analysing the development of the indicators over time, it is worth bearing in mind that in some markets progress in financial integration is not easily disentangled from the effects of the elimination of exchange rate risk and of the convergence of inflation expectations across euro area countries.
Slide 2: State of integration in the euro area
Integration is uneven across market segments (and is strongest in those segments closest to monetary policy). In general, integration:
is very strong in the money market;
has progressed significantly in government bond markets;
has improved for the corporate bond market;
is slow but progressing in the case of the equity market; and
is much less advanced in a range of banking market segments.
[SLIDE 2] As already mentioned by the Vice-President, the available evidence suggests that the degree of integration varies greatly from market segment to market segment. While the euro has undoubtedly played a very important role as a catalyst for financial integration in general, integration is most advanced in those market segments that are closer to the single monetary policy, notably the money market. The unsecured money market has been fully integrated since shortly after the introduction of the euro. The repo market is also highly integrated. Integration in bond markets has also progressed significantly. Government bond yields have converged considerably and are now driven mainly by euro area-wide shocks and news. The corporate bond market has witnessed exceptional growth since 1999 and is also fairly integrated, in the sense that the country of issuance is only of marginal importance in explaining yield differentials. Progress has also been made in the integration of euro area equity markets, in which equity returns are increasingly determined by common factors. However, as I mentioned earlier, banking markets are generally much less integrated.
Slide 3: Money Market
The cross-sectional dispersion of overnight lending rates disappeared following the introduction of the euro

Cross-country standard deviation of the average overnight lending rates among euro area countries (60-day moving average, basis points)
Sources: European Banking Federation and ECB calculations.
[SLIDE 3] The money market, broadly defined as the market for interbank short-term debt or deposits, consists of various segments. The financial integration of the money market can be analysed on the basis of the dispersion of lending rates offered by different banks in each market segment. This slide shows the cross-country standard deviation for the EONIA rate. This indicator obviously converged to close to zero immediately after the introduction of the euro and thereafter remained stable, suggesting a highly integrated unsecured money market.
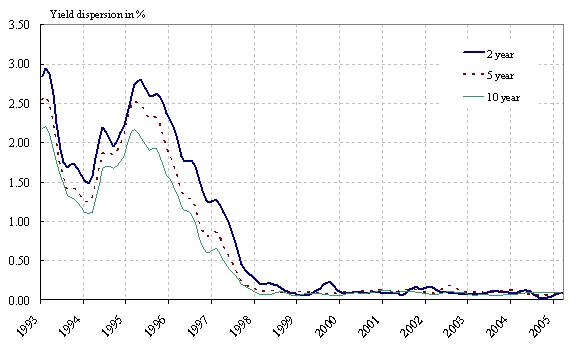
Slide 4: Government bond markets
Yield movements are now driven mainly by euro area-wide factors.
Local factors continue to have some influence. This may partly be explained by differences in liquidity and in perceived credit risks.
Source: ECB.
[SLIDE 4] Measures of integration in government bond markets are based on yield differentials with respect to a benchmark bond (e.g. the German bond for ten-year bonds and the French bonds for two and five-year bonds). Given comparable maturities and other relevant characteristics, yield spreads on government bonds can provide a direct measure of the degree of integration. A simple measure is to look at developments in the standard deviation of these spreads over time: the higher the degree of integration, the lower the dispersion. This picture shows the evolution over time of government yield spreads on German bonds (for ten-year bonds) and French bonds (for two and five-year bonds). The figure shows a significant drop in these indicators in the run-up to EMU, with these indicators then remaining close to zero from 2001 onwards (the year in which Greece joined EMU). The sharp decline in these indicators points to the fact that the euro area government bond market has reached a very high level of integration.
Slide 5: Corporate bond market
The corporate bond market has grown considerably since the advent of the euro.

Euro area corporate bond market: outstanding values per rating category (EUR billions).
Sources: Bloomberg and ECB calculations.
[SLIDE 5] It is widely recognised that the euro gave a major boost to the development of the corporate bond market in the euro area. This impressive development is clearly illustrated by this chart. With the introduction of the euro, the corporate bond market grew almost fivefold, from around €200 billion in 1999 to some €900 billion in 2005.
Slide 6: Equity market
Since the end of the 1990s it has been as important to diversify an equity portfolio along sectoral as along country lines.
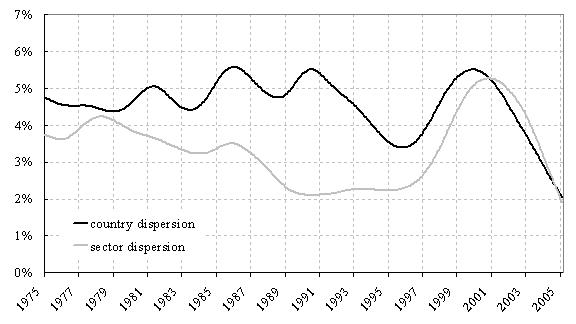
Hodrick-Prescott filtered country and sector dispersions of equity returns in euro area countries.
Sources: Thomson Financial Datastream and ECB calculations.
[SLIDE 6] As far as the equity market is concerned, the more integrated the market, the greater the benefits of diversification through sector-based as opposed to country-based equity investment strategies. In this slide, we plot the country and sector dispersions of monthly equity returns over time. The country dispersion is higher than the sector dispersion for almost the entire sample. The difference between country and sector dispersions narrowed in the late 1990s, and the sector dispersion even slightly exceeded the country dispersion from 2001 onwards, suggesting a possible shift in the asset allocation paradigm from country-based to sector-based strategies. However, both country and sector dispersions have shown a strong decrease in the last few years. Obviously, this complicates any interpretation of the results in terms of the advantage of sector diversification relative to country diversification.
Slide 7: Equity market
Greater importance of euro area shocks in explaining equity returns.
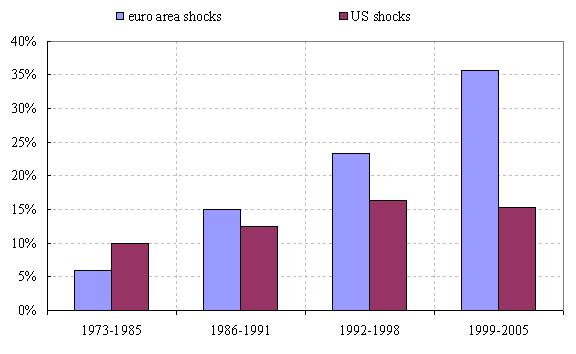
Proportion of variance of euro area equity market returns explained by euro area and US shocks.
Sources: Thomson Financial Datastream and ECB calculations.
[SLIDE 7] Alternative indicators of financial integration in equity markets can be derived from factor models. On the assumption that equity returns in the euro area countries react to both a local and a global factor (proxied respectively by shocks in aggregate euro area and US equity markets), it is possible to estimate the intensity with which euro area and global shocks are transmitted to national equity markets. Ceteris paribus, a higher spillover intensity suggests a higher degree of equity return co-movements across countries (i.e. a higher degree of integration). This chart looks at the proportion of the total domestic equity volatility that can be explained by euro area-wide and US shocks respectively (“variance ratios”). A higher variance ratio that can be associated with euro area-wide changes is an indication of a more integrated euro area equity market, signalling that national stock market returns are increasingly driven by common news. The variance ratios have increased over the past 30 years with respect to both euro area-wide and US shocks, although the increase has been strongest in the case of the former type of shocks. This suggests that regional euro area integration has proceeded more quickly than worldwide integration. However, the as yet relatively low level of variance attributable to euro area-wide factors (around 35%) reveals that local shocks are still relatively important, indicating that further integration is possible.
Slide 8: Banking market
Cross-border retail bank lending activity in the euro area remains very limited.
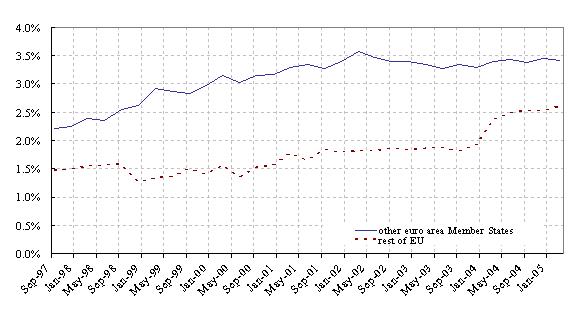
Percentage share of loans granted by euro area MFIs to non-MFI counterparties in other euro area countries and non-euro area EU Member States.
Source: ECB.
[SLIDE 8] Coming to the last market under investigation, integration in the retail bank market can be partly assessed by looking at the share of cross-border activity in the total lending activity of MFIs. Cross-border retail bank lending activity in the euro area remains very limited (around 3.5% of the total), suggesting a fragmented retail banking market.
Slide 9: Banking market
Retail rate differentials across countries differ according to product
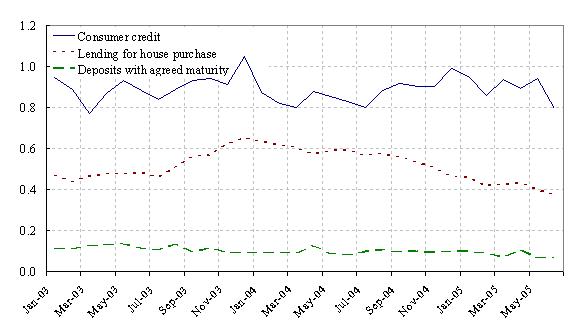
Cross-country standard deviation of MFI interest rates: loans to households and deposits with an agreed maturity.
Source: ECB.
[SLIDE 9] This last chart suggests that cross-country dispersion of bank interest rates has remained relatively high (as compared, for example, with the government bond market) since January 2003. However, this may not only be due to incomplete integration. The ECB, together with the NCBs, is undertaking a comprehensive analysis of cross-country interest rate dispersion.
We are now at your disposal for questions.
-
[1] See BIS Triennial Survey 2004, published in March 2005.
Banque centrale européenne
Direction générale Communication
- Sonnemannstrasse 20
- 60314 Frankfurt am Main, Allemagne
- +49 69 1344 7455
- media@ecb.europa.eu
Reproduction autorisée en citant la source
Contacts médias