
ECB staff macroeconomic projections for the euro area, March 2024
1 Overview
The euro area economy stagnated at the end of 2023 amid tight financing conditions, subdued confidence and past competitiveness losses. Incoming information suggests a slower recovery in the short run than was foreseen in the December 2023 projections. Nevertheless, economic growth is projected to gradually pick up during this year as real disposable income rises, amid declining inflation and robust wage growth, and as the terms of trade improve. With the current shipping disruptions in the Red Sea unlikely to cause significant renewed supply constraints, export growth is expected to catch up with strengthening foreign demand. Over the medium term the recovery is seen to also be supported by the gradual fading of the impact from the ECB’s monetary policy tightening. Overall, annual average real GDP growth is expected to be 0.6% in 2024, and to strengthen to 1.5% in 2025 and 1.6% in 2026. Compared with the December 2023 projections, the outlook for GDP growth has been revised down for 2024, owing to carry-over effects from past negative data surprises and weaker incoming forward-looking information, it is unrevised for 2025 and has been revised slightly up for 2026.[1]
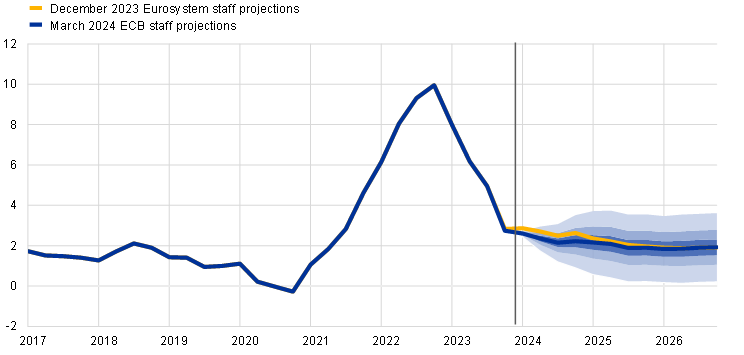
Inflation is projected to moderate further owing to the ongoing easing of pipeline pressures and the impact of monetary policy tightening, albeit at a more modest pace than seen in 2023. Pipeline price pressures should continue to fade with the shipping disruptions in the Red Sea expected to have only a limited upward impact. As energy prices decline, strong labour cost developments should be the dominant driver of inflation in the Harmonised Index of Consumer Prices (HICP) excluding energy and food. Nominal wage growth is set to remain elevated, driven by persistent tightness in the labour market, but it should gradually ease over the projection horizon as upward impacts from inflation compensation fade. A recovery in productivity growth should support the moderation in labour cost pressures. Profit growth is set to weaken over the projection horizon and provide a buffer to the pass-through of labour costs. Overall, annual average headline HICP inflation is expected to decrease from 5.4% in 2023 to 2.3% in 2024, 2.0% in 2025 and 1.9% in 2026. Given the weak outlook for energy inflation, headline inflation is expected to remain below HICP inflation excluding energy and food throughout the projection horizon. Compared with the December 2023 projections, HICP inflation has been revised down for 2024 and 2025, mainly owing to the direct and indirect effects from lower assumptions for energy commodity prices and lower labour cost pressures, and is unrevised for 2026.
Table 1
Growth and inflation projections for the euro area
(annual percentage changes)
March 2024 | December 2023 | ||||||||
|---|---|---|---|---|---|---|---|---|---|
2022 | 2023 | 2024 | 2025 | 2026 | 2023 | 2024 | 2025 | 2026 | |
Real GDP | 3.4 | 0.5 | 0.6 | 1.5 | 1.6 | 0.6 | 0.8 | 1.5 | 1.5 |
HICP | 8.4 | 5.4 | 2.3 | 2.0 | 1.9 | 5.4 | 2.7 | 2.1 | 1.9 |
Notes: Real GDP figures refer to annual averages of seasonally and working day-adjusted data. Historical data may differ from the latest Eurostat publications owing to data releases after the cut-off date for the projections. Data are available for downloading, also at quarterly frequency, from the Macroeconomic Projection Database on the ECB website.
2 Real economy
Economic activity in the euro area stagnated in the fourth quarter of 2023, likely owing to small positive contributions from domestic demand and net exports being offset by continued destocking (Chart 1).[2] Eurostat’s flash estimate of quarterly growth in the fourth quarter of 2023 was 0.0%, slightly below the figure of 0.1% entailed in the December 2023 projections. Euro area industrial production excluding construction was flat in the fourth quarter of 2023, with an increase in December suggesting a possible turnaround. In contrast, construction output and retail sales continued their downward trends and services production turned negative towards the end of last year. While exports continued to slightly underperform foreign demand, some estimated destocking, which likely continued at the end of 2023,[3] translated into weak imports. Thus, the negative contribution from changes in inventories would have offset the slight increases in domestic demand and net trade.
Chart 1
(quarter-on-quarter percentage changes, seasonally and working day-adjusted quarterly data)
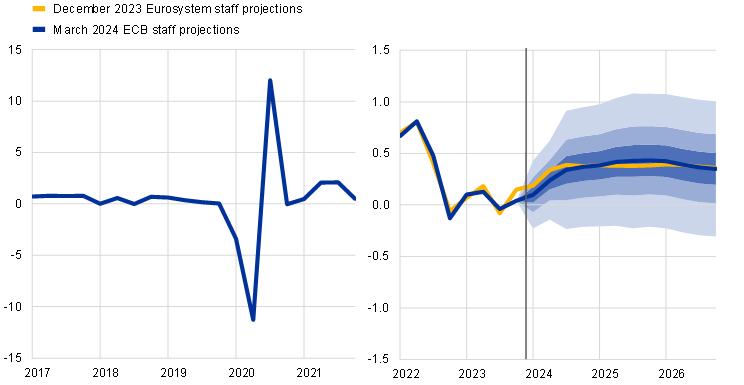
Notes: Historical data may differ from the latest Eurostat publications. The vertical line indicates the start of the current projection horizon. The ranges shown around the central projections provide a measure of the degree of uncertainty and are symmetric by construction. They are based on past projection errors, after adjustment for outliers. The bands, from darkest to lightest, depict the 30%, 60% and 90% probabilities that the outcome of real GDP growth will fall within the respective intervals. For more information, see Box 6 of the March 2023 ECB staff macroeconomic projections for the euro area.
Real GDP growth is expected to remain subdued in early 2024, amid waning tailwinds and tight financing conditions, before strengthening thereafter, supported by increasing household income, government consumption and foreign demand. The boost to activity from the post-pandemic reopening of the economy has faded, while the drag from tight financing conditions and elevated consumer uncertainty remains significant. Forward-looking survey indicators remained in contractionary territory on average in the first two months of 2024. Nevertheless, declining inflation and robust wage growth, in the context of a still tight labour market, should underpin households’ purchasing power in the first half of this year. Activity is therefore expected to be supported mainly by private consumption. Growth should pick up slightly further in the second half 2024, driven by rising private consumption, amid increases in real disposable income and an expected recovery in confidence. Government consumption is also projected to increase in the course of 2024, partly reflecting lagged inflation compensation in public sector wages, while exports should further catch-up with foreign demand. Over the medium term, real GDP growth is expected to strengthen further to rates marginally above the pre-pandemic average, supported by increasing real incomes, strengthening foreign demand and less drag from monetary and fiscal policies (Table 2). The withdrawal of fiscal support measures introduced since 2022 to compensate for high inflation and energy prices will have a small negative impact on growth in 2024-26, but the overall fiscal stance will be broadly neutral in 2025-26.
Financing conditions, especially high interest rates, are expected to continue to have a strong negative impact on growth, which will fade only gradually over the projection horizon. The impact of the monetary policy measures taken since December 2021 continues to feed through to the real economy, affecting the growth outlook, particularly for 2024.[4] In addition, credit supply conditions have tightened significantly since the end of 2022, although the pace of the tightening has moderated recently as reported in the ECB’s latest euro area bank lending survey. The negative credit supply effects are assumed to affect mostly business and housing investment, and, to a lesser extent, private consumption. On the basis of market expectations regarding the future path of interest rates (Box 1), the negative impact of monetary policy and credit supply conditions on economic growth is expected to start gradually fading during 2024, although there is still considerable uncertainty surrounding the precise timing and magnitude of this impact. Therefore, part of the projected increase in GDP growth over the medium term relates to the fading of these dampening effects.
Compared with the December 2023 projections, real GDP growth has been revised down by 0.2 percentage points for 2024, it is unrevised for 2025 and has been revised up by 0.1 percentage points for 2026. The revisions for 2024 reflect the carry-over effects from recent weaker than expected data outturns for 2023 and a downward revision to quarterly GDP growth in the short term, as survey indicators remain subdued. The more negative than expected outturns, including for forward-looking indicators from business and household surveys, imply downward revisions to domestic demand, which are partly counterbalanced by small upward revisions to net trade. The reduced drag from financing conditions and lower commodity prices have led to small upward revisions to private consumption and to investment in 2026.
Table 2
Real GDP, labour markets and trade projections
(annual percentage changes, unless otherwise indicated)
March 2024 | December 2023 | ||||||||
|---|---|---|---|---|---|---|---|---|---|
2022 | 2023 | 2024 | 2025 | 2026 | 2023 | 2024 | 2025 | 2026 | |
Real GDP | 3.4 | 0.5 | 0.6 | 1.5 | 1.6 | 0.6 | 0.8 | 1.5 | 1.5 |
Private consumption | 4.2 | 0.5 | 1.2 | 1.6 | 1.5 | 0.5 | 1.4 | 1.6 | 1.4 |
Government consumption | 1.6 | 0.2 | 1.3 | 1.4 | 1.2 | 0.1 | 1.1 | 1.3 | 1.2 |
Gross fixed capital formation | 2.8 | 0.8 | -0.6 | 1.6 | 2.3 | 1.3 | 0.4 | 1.8 | 2.1 |
Exports1) | 7.4 | -0.7 | 1.0 | 2.9 | 3.2 | -0.4 | 1.1 | 2.9 | 3.0 |
Imports1) | 8.1 | -1.3 | 1.0 | 3.1 | 3.2 | -0.9 | 1.7 | 3.1 | 3.0 |
Employment | 2.3 | 1.4 | 0.5 | 0.3 | 0.4 | 1.4 | 0.4 | 0.4 | 0.4 |
Unemployment rate (percentage of labour force) | 6.7 | 6.5 | 6.7 | 6.6 | 6.6 | 6.5 | 6.6 | 6.5 | 6.4 |
Current account balance (percentage of GDP) | -0.6 | 1.8 | 3.2 | 3.2 | 3.1 | 1.2 | 1.0 | 1.0 | 1.1 |
Notes: Real GDP and components refer to seasonally and working day-adjusted data. Historical data may differ from the latest Eurostat publications owing to data releases after the cut-off date for the projections. Data are available for downloading, also at quarterly frequency, from the Macroeconomic Projection Database on the ECB website.
1) This includes intra-euro area trade.
Turning to the components of real GDP, real private consumption is expected to be the main driver of economic growth, supported by robust real income growth and improving consumer confidence. Private consumption is estimated to have increased in the last quarter of 2023. Consumer spending is projected to strengthen gradually over the coming quarters, reflecting the decline in inflation and the continued overall resilience in the labour market. Moreover, declining uncertainty and improving consumer confidence are expected to provide additional support to private consumption, which should grow in 2025-26 at annual rates well above the pre-pandemic average. Private consumption growth has been revised down by 0.2 percentage points for 2024 compared with the December 2023 projections, mainly on account of weaker than expected dynamics in the first half of the year. It has been revised up marginally for 2026 in the context of expectations of a somewhat faster normalisation of households’ spending behaviour, which is reflected in a slightly more pronounced decline in the household saving ratio.
Real disposable income is estimated to have increased in 2023 and is projected to strengthen further over the coming years, reflecting falling inflation and robust wage growth, while savings are expected to remain elevated throughout the projection horizon. Real disposable income likely recovered in 2023, driven by strong labour and non-labour income growth and declining inflation. Non-labour income (for example, income from self-employment and from financial assets), together with strong wage growth, is expected to support households’ purchasing power in the near term. The saving ratio should remain elevated in 2024 reflecting still high uncertainty and strong incentives to save owing to high interest rates and tighter credit access, coupled with still rising non-labour income (given the high propensity of consumers to save this type of income). From 2025, as uncertainty and inflationary pressures recede and consumer spending behaviour gradually normalises, the household saving ratio should edge down. However, it is projected to remain above its pre-pandemic level throughout the projection horizon as higher interest rates counterbalance households’ desire to normalise their saving behaviour after the pandemic. The stock of accumulated savings is unlikely to provide support to consumption growth as it is concentrated among wealthy households and mostly held in the form of illiquid assets. High inflation rates in the past have also had a dampening effect on the real stock of savings.
Box 1
Technical assumptions about interest rates, commodity prices and exchange rates
Compared with the December 2023 projections, the technical assumptions include lower interest rates, lower energy prices and a slight depreciation of the euro. The technical assumptions about interest rates and commodity prices are based on market expectations, with a cut-off date of 9 February 2024. Short-term interest rates refer to the three-month EURIBOR and market expectations are derived from futures rates, while ten-year government bond yields are used to proxy long-term interest rates.[5] The assumptions for both short-term and long-term interest rates have been revised down by around 20 to 40 basis points over the projection horizon.
Table
Technical assumptions
March 2024 | December 2023 | |||||||
|---|---|---|---|---|---|---|---|---|
2023 | 2024 | 2025 | 2026 | 2023 | 2024 | 2025 | 2026 | |
Three-month EURIBOR (percentage per annum) | 3.4 | 3.4 | 2.4 | 2.4 | 3.4 | 3.6 | 2.8 | 2.7 |
Ten-year government bond yields (percentage per annum) | 3.1 | 2.9 | 3.0 | 3.2 | 3.2 | 3.2 | 3.3 | 3.4 |
Oil price (in USD/barrel) | 83.7 | 79.7 | 74.9 | 72.2 | 84.0 | 80.1 | 76.5 | 73.6 |
Natural gas prices (EUR/MWh) | 41 | 30 | 32 | 30 | 42 | 47 | 44 | 37 |
Wholesale electricity prices (EUR/MWh) | 103 | 74 | 78 | 71 | 105 | 117 | 111 | 98 |
Non-energy commodity prices, in USD (annual percentage change) | -12.5 | 0.6 | 2.0 | 0.1 | -13.2 | -2.3 | 2.4 | 1.7 |
EU Emissions Trading System allowances (in EUR/tonne) | 83.7 | 58.6 | 60.0 | 61.8 | 84.0 | 78.4 | 82.0 | 85.2 |
USD/EUR exchange rate | 1.08 | 1.08 | 1.08 | 1.08 | 1.08 | 1.08 | 1.08 | 1.08 |
Euro nominal effective exchange rate (EER41) (Q1 1999 = 100) | 121.8 | 123.1 | 123.1 | 123.1 | 121.9 | 123.5 | 123.5 | 123.5 |
Note: Data are available for downloading from the Macroeconomic Projection Database on the ECB’s website.
The technical assumptions for oil prices have been revised slightly down since the December 2023 projections, and strongly down for wholesale gas and electricity prices.[6] The downward revision to oil prices reflects weak global oil demand, high oil supply from the United States and a global oil supply surplus in 2024 of 0.5% of global demand as projected by the International Energy Agency. This surplus is projected despite OPEC+ announcing, at the end of November 2023, a cut in the oil supply for the first quarter of 2024. These factors outweighed upward oil price pressures stemming from supply risks linked to the political instability in the Middle East, including the attacks on ships in the Red Sea and Gulf of Aden, which have intensified recently. Overall, the oil futures curve has shifted downwards since the December 2023 projections (by 0.5% for 2024 and around 2% for 2025 and 2026) and remains downward-sloping. Gas prices have been revised down more substantially. Despite a period of colder temperatures in Europe in early 2024, gas consumption remained below historical norms owing to low industrial activity but also to behavioural changes of a more persistent nature among consumers after the period of high gas prices. Overall, the gas futures curve has shifted downwards since the December projections (by about 30% on average over 2024-26). Electricity futures have been revised down by similar magnitudes. For carbon emissions allowances on the EU Emissions Trading System, price futures stand around 27% below their December projection path and are assumed to remain broadly stable over the projection horizon.
The non-energy commodity price assumptions have been revised up for 2024 and down for 2025 and 2026 since the December 2023 projections, amid near-term tightness in international markets for both metals and food commodities. The upward revision for 2024 is driven by higher metal prices – mainly following from an expected deficit in the global market for copper – but also by higher food commodity prices owing mainly to sharp increases in cocoa prices caused by severe supply disruptions in West Africa. These upward pressures on prices are assumed to fade gradually over the projection horizon.
Bilateral exchange rates are assumed to remain unchanged over the projection horizon, at the average levels prevailing in the ten working days ending on the cut-off date. This implies an exchange rate of USD 1.08 per euro over the projection horizon, which is 0.3% lower than assumed in the December 2023 projections. The assumption for the effective exchange rate of the euro implies a depreciation of 0.3-0.4% compared with the assumption in the December 2023 projections.
Housing investment is projected to fall further in 2024, before recovering in 2025 and 2026 as tight financing conditions gradually ease and household incomes grow robustly. Housing investment likely fell again in the final quarter of 2023, following contractions in the previous two quarters. It is expected to continue its downward trend in 2024 owing to the considerable tightening of financing conditions in the past, including the sharp rise in mortgage interest rates and the tightening of bank lending standards. However, as financing conditions gradually improve, household income grows robustly and confidence recovers, housing investment is projected to pick up again from 2025 and grow at a faster pace in 2026.
Business investment is expected to remain weak in 2024 before gradually picking up in line with improving financing conditions, stronger demand and crowding-in effects from the Next Generation EU (NGEU) programme. Euro area business investment is estimated to have contracted sharply in the final quarter of 2023, falling far more than previously anticipated. This surprise reflects, first a faster than expected winding-down of order backlogs and firms’ internal financing buffers, which had previously countered the drag from tighter financing conditions, and second, delayed NGEU disbursements, which postponed potential crowding-in effects. Overall, euro area business investment is expected to contract in 2024 (in contrast to the modest growth anticipated in the December 2023 projections), but to increase in 2025 and 2026. This recovery over the medium term reflects the gradually diminishing drag from adverse financing conditions, as well as ongoing private sector efforts to enhance green and digital investments, together with strengthening domestic and foreign demand.
Box 2
The international environment
Global economic growth moderated at the turn of the year as monetary policy tightening continued to be transmitted through the economy.[7] Global growth is projected to decline slightly to 3.4% this year, compared with the 3.5% estimated for 2023. This softening reflects the impact of fading tailwinds, such as the depletion of excess savings and the gradually cooling labour market, which supported consumer spending in advanced economies previously. Global growth is projected to slow to 3.2% annually over 2025-26, slightly below the average over the last decade. In the United States, growth is expected to weaken this year with the ongoing adjustment in the labour market and the transmission of tight monetary policy and bank lending standards. In China, consumer spending remains subdued against the backdrop of the weak real estate market. Compared with the December 2023 projections, global growth has been revised up for this year, largely on account of upside data surprises in major economies, particularly the United States, in late 2023.
Global trade is projected to recover and to start growing more in line with global economic activity in the medium term. Following a period of weak global trade dynamics amid the post-pandemic rebalancing of demand from goods to services, the latest data indicate a rebound, albeit smaller than previously expected. Traffic disruptions in the Red Sea area are assessed to have only limited impact on the baseline projection for global trade. Suppliers’ delivery times lengthened only slightly at the global level in January, remaining well below the levels seen from 2021 to 2022, when global supply chains were under severe strain. A number of mitigating factors are at play. First, spare shipping capacity seems ample, as global demand for goods is relatively subdued and the world’s cargo vessel fleet has expanded. Second, the degree of congestion at ports around the world remains broadly unchanged, signalling their capacity to cope with rerouted vessels. Finally, manufacturers’ high stocks of inventories are cushioning the impact of longer delivery times on production. However, risks to global trade and inflation would increase if the disruptions in the Red Sea area were to escalate and be much more persistent (see Box 3). Overall, global trade is expected to grow by 2.8% this year, by 3.1% in 2025 and 3.2% in 2026, broadly unchanged from the previous projections. Despite the projected recovery and a return to a historical unitary trade elasticity vis-à-vis global growth by 2025, global trade is expected to remain below its historical trend level. This reflects the impact of the ongoing structural changes in trade relations caused by rising geopolitical tensions. Euro area foreign demand is estimated to have increased by just 0.6% in 2023, a slightly weaker pace than foreseen in the previous projections. Foreign demand is expected to recover, but more gradually than foreseen in the December 2023 projections. It is being held back by weaker import growth in some of the euro area’s main trading partners, including the United Kingdom and central and eastern European countries. Additionally, a slower recovery of imports in these countries at the turn of the year implies a more gradual recovery of euro area foreign demand this year. Thereafter, revisions to euro area foreign demand are minor.
Table
The international environment
(annual percentage changes)
March 2024 | December 2023 | |||||||
|---|---|---|---|---|---|---|---|---|
2023 | 2024 | 2025 | 2026 | 2023 | 2024 | 2025 | 2026 | |
World real GDP (excluding the euro area) | 3.5 | 3.4 | 3.2 | 3.2 | 3.3 | 3.1 | 3.2 | 3.2 |
Global trade (excluding the euro area)1) | 1.2 | 2.8 | 3.1 | 3.2 | 1.1 | 3.0 | 3.0 | 3.2 |
Euro area foreign demand2) | 0.6 | 2.4 | 3.1 | 3.2 | 0.8 | 2.6 | 2.9 | 3.1 |
World CPI (excluding the euro area) | 4.9 | 4.1 | 3.2 | 2.8 | 5.0 | 4.4 | 3.4 | 2.9 |
Export prices of competitors in national currency3) | -0.7 | 2.5 | 2.7 | 2.6 | -0.3 | 3.2 | 2.7 | 2.6 |
Note: Data are available for downloading from the Macroeconomic Projection Database on the ECB website.
1) Calculated as a weighted average of imports.
2) Calculated as a weighted average of imports of euro area trading partners.
3) Calculated as a weighted average of the export deflators of euro area trading partners.
Annual headline inflation at the global level is projected to decline over the projection horizon, while growth in the prices of euro area competitors’ exports is projected to turn positive this year. World headline consumer price index (CPI) inflation stood at 4.9% in 2023 and is projected to decline gradually to 4.1% in 2024, 3.2% in 2025 and 2.8% in 2026. While disinflation towards central banks’ targets is projected to proceed gradually in advanced economies, in emerging market economies inflation is expected to pick up slightly this year before declining again. This pattern reflects projected rising inflation in some major economies, such as China, Russia and Türkiye. Euro area competitors’ export prices (in national currencies and in annual terms) declined in the last three quarters of 2023 as commodity prices fell and domestic and foreign pipeline pressures eased significantly. With the impact of these factors fading, growth in competitors’ export prices is projected to turn positive again in 2024. Compared with the December 2023 projections, the growth rate has been revised down slightly for 2024, amid lower pipeline pressures and slightly lower energy commodity prices.
Euro area trade should improve, although remaining subdued by historical standards. Euro area real exports continued to retrench in the third quarter of 2023, but are estimated to have rebounded in the fourth quarter. They are expected to grow over the projection horizon broadly in line with developments in foreign demand. In this regard, the baseline projection does not include significant effects from the disruptions in the Red Sea which are expected to be short-lived (see Box 2 regarding the baseline, and Box 3 regarding a scenario of an escalation of the disruptions). Compared with the December 2023 projections, the export market share for the euro area is somewhat higher over the projection horizon; nevertheless, it is expected to remain well below pre-pandemic levels owing to the competitiveness challenges related to the past appreciation of the euro and to the past energy shocks. Imports surprised on the downside in the third quarter of 2023, and in the short term they are expected to grow more modestly than foreseen in the December 2023 projections, owing to weakness in the trade-intensive components of demand, such as investment. Thereafter, imports are projected to recover in line with the gradual recovery in domestic demand. Overall, net trade – which has been stronger than expected in recent data – is projected to remain somewhat higher in the short term; the contribution to GDP is projected to turn broadly neutral in 2024 and 2025, and to slightly support growth in 2026 (Chart 2). The terms of trade are projected to continue to improve in the short term, mostly as a result of lower import prices, reflecting the fall in energy prices. This translates into a higher current account balance, which from 2024 is projected to return to levels prevailing before the energy crisis.
Chart 2
Euro area real GDP – decomposition into the main expenditure components
(annual percentage changes, percentage point contributions)
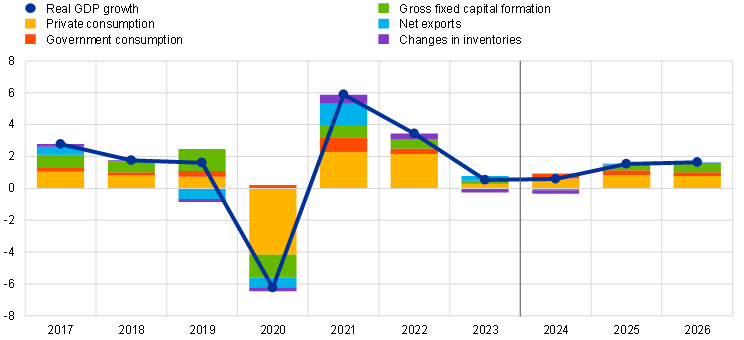
Notes: Data are seasonally and working day-adjusted. Historical data may differ from the latest Eurostat publications owing to data releases after the cut-off date for the projections. The vertical line indicates the start of the projection horizon.
The labour market remains resilient, although it is cooling somewhat as employment growth is expected to rebalance from the strong growth recorded in 2023. Broadly similar to the December 2023 projections, growth in total employment is expected to decline from 1.4% in 2023 to 0.5% in 2024 and to stabilise at 0.3% and 0.4% in 2025 and 2026 respectively (Chart 3). Labour productivity growth is expected to strengthen over the projection horizon, but productivity levels in 2026 are seen to remain significantly below the long-term linear trend. The unemployment rate is expected to show a slight hump-shaped profile: responding to weak economic activity with a lag, it is seen to increase to 6.7% in 2024 and to decrease thereafter to 6.6% in 2025 and 2026. The unemployment rate has been revised up by 0.1 percentage points for 2024 and 2025, and by 0.2 percentage points for 2026.
Chart 3
The euro area labour market
(percentage of labour force (left-hand scale), annual percentage changes (right-hand scale))
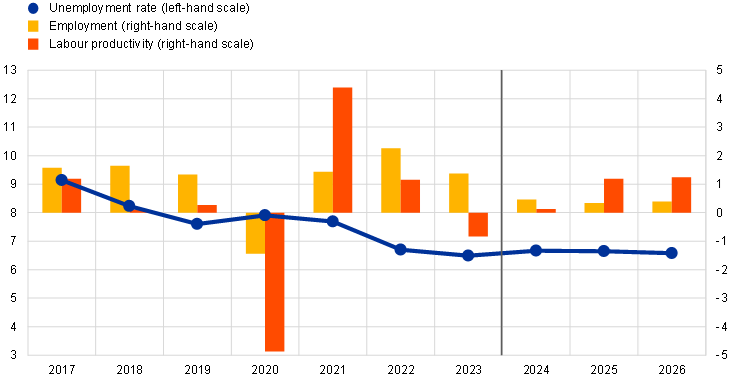
Note: The vertical line indicates the start of the projection horizon.
Box 3
Scenario analysis of a potential escalation of the disruptions in the Red Sea area
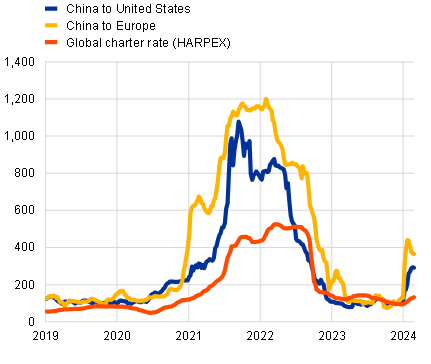
This scenario analyses the risks to the March 2024 baseline projections stemming from more protracted shipping disruptions in the Red Sea and the Gulf of Aden. Following repeated attacks by Houthi rebels on cargo vessels passing through the Bab-el-Mandeb Strait (i.e. the southern entry point to the Red Sea for vessels heading for the Suez Canal), transit volumes have dropped by about 70% since the beginning of December 2023 (Chart A, panel a).[8] The March 2024 baseline projections assume shipping disruptions to be rather short-lived and their effects to be contained (Box 2). This box looks at a scenario of more severe and protracted disruptions until the end of the third quarter, with a de facto closure of the Suez Canal, while a gradual normalisation takes place in the fourth quarter of 2024. The scenario assumes that the conflict does not escalate to include major oil-producing countries (e.g. Iran), resulting, for example, in a partial closure of the Strait of Hormuz.[9] The latter would have greater economic effects given that a significant volume of oil trade takes place via this route (about 20%).
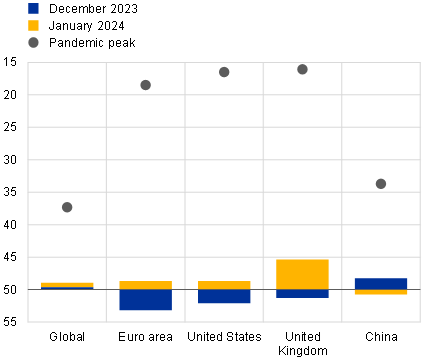
The Red Sea disruptions observed so far can affect the global economy through higher shipping costs, increasing oil prices and lower trade, but as yet effects appear to be limited. About 12% of global crude oil shipments and 10% of all global seaborne trade by volume pass through the Suez Canal. Shipping disruptions can have multiple undesired effects. First, delays in oil shipments may lead to higher oil prices because of tighter global oil supply. However, after a short period of volatility, the Brent crude oil spot price has fallen and is currently below the level recorded after the first Houthi attacks.[10] This is because oil tankers transiting the region are largely unaffected and only a few oil companies have suspended operations in the area (Chart A, panel b).[11],[12] Second, global trade volumes and shipping costs are affected, since journeys between Asia and Europe are about 30% longer owing to shipping rerouting around the Cape of Good Hope, with rising demand for global container shipping capacity. As a result, higher transportation costs could feed into higher consumer prices. Since the start of the Houthi attacks, freight costs for shipping containers have indeed significantly increased along specific routes but remain well below the highs recorded in 2021 and 2022 (Chart A, panel c). Third, shipping delays could disrupt production via the reduced availability of raw materials and intermediate inputs, especially in industries relying on “just-in-time” supply chains. In January 2024 the Purchasing Managers’ Indices (PMIs) for suppliers’ delivery times rose for countries more exposed to the shipping disruptions, but remained significantly below their 2021 and 2022 levels (Chart A, panel d). Finally, while disruptions along critical maritime routes like the Red Sea might amplify uncertainty in global markets, the VIX Index, a proxy for financial market uncertainty, remains below the level registered on the day of the first Houthi attacks (Chart A, panel b).
Chart A
Developments in key indicators for shipping
a) Marine transit volumes | b) Oil price and financial market volatility |
(indices; November, 2023 = 100) | (indices) |
|
|
c) Shipping prices | d) PMI suppliers’ delivery times |
(indices; 5 November 2023 = 100) | (diffusion indices) |
|
|

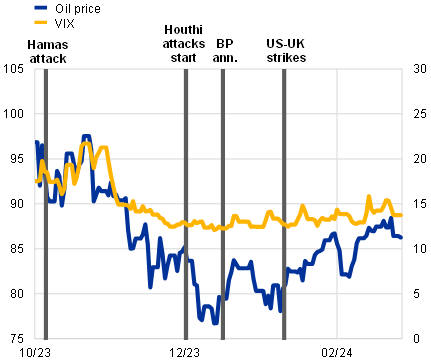
Sources: IMF PortWatch, Bloomberg, Haver Analytics, HARPEX (Harper Petersen Charter Rates Index), Freightos Baltic Index (FBX), S&P Global and ECB staff calculations.
Notes: In panel a), marine transit volumes are calculated as seven-day moving averages where the minimum-maximum range reports the historic evolution of shipped volumes from 2019 to 2022, and in relation to shipped volumes on 1 December in a given year. In panel b) BP ann. refers to the announcement by British Petroleum that it would suspend shipments through the Red Sea. In panel d), an inverted scale is used, where the lowest readings for the PMI for suppliers’ delivery times were recorded in April 2022 for global data (excluding the euro area), July 2021 for the United States, May 2021 for the euro area and April 2020 for both China and the United Kingdom. The latest observations are for 11 February 2024 (marine transit volumes), 26 February 2024 (oil prices and VIX volatility index) and 23 February 2024 (shipping prices).
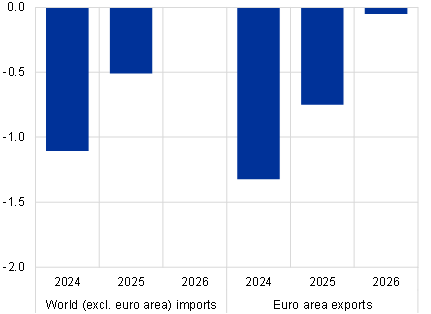
Model-based estimates suggest that the repercussions from escalated shipping disruptions for global and euro area trade are likely to be contained. The effects of a scenario of more prolonged shipping disruptions on trade volumes are quantified using vector autoregressive (VAR) models for global and euro area trade. Shipping disruptions are proxied by the Federal Reserve Bank of New York’s Global Supply Chain Pressure Index (GSCPI), and we exploit the obstruction of the Suez Canal caused by the container ship “Ever Given” in 2021 to calibrate the supply chain disruptions associated with a blockade of this maritime gateway.[13],[14] In this scenario, global trade growth would decrease by 1.1 percentage points in 2024 and by 0.5 percentage points in 2025 compared with the March 2024 projections baseline, with no impact in 2026 (Chart B, panel a). These effects reflect a higher usage of shipping capacity and a run-down of inventories in view of longer trade disruptions, but also a decline in trade in response to more persistent increases in shipping prices.[15] The impact on euro area trade is larger. Compared with the baseline, euro area export growth would be 1.3 percentage points lower in 2024 and 0.8 percentage points lower in 2025. This reflects a relatively higher exposure of the euro area to disruptions in the Suez Canal, but also the relatively higher trade openness and global value chain integration of the euro area.
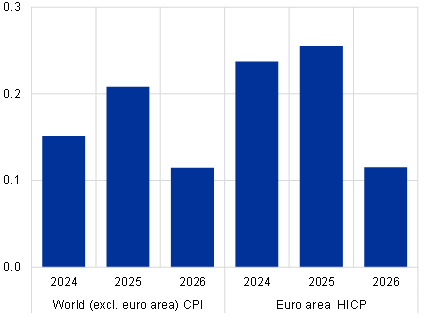
In the escalation scenario, euro area inflation would be around 0.25 percentage points above the baseline in both 2024 and 2025, but the impact would be smaller in 2026. The inflationary impact of higher shipping costs is contained as maritime trade costs make up only a small share of total input costs. In addition, a full pass-through of higher input prices to consumer prices appears unlikely, given the current relative weakness in demand and the ability of companies to absorb part of the higher costs in profit margins. Nevertheless, model-based estimates suggest that, in the escalation scenario, global inflation would increase by 0.15 percentage points in 2024 and by 0.20 percentage points in 2025 above the baseline. The slightly stronger impact in 2025 relates to the fact that changes in spot rates for shipping costs feed through to contractual rates with a lag, as the latter are negotiated periodically. Given the larger exposure of the euro area to the disruptions, euro area HICP inflation would register a more sizeable impact of around 0.25 percentage points (compared with the baseline) in both 2024 and 2025 (Chart B, panel b). The impact on euro area inflation in 2026 would be small as reopening effects would partially compensate the lagged pass-through of shipping costs to inflation.
Chart B
Impact on global and euro area trade and inflation under the escalation scenario
a) Trade flows | b) Consumer prices |
(deviation from baseline growth rates, percentage points) | (deviation from baseline growth rates, percentage points) |
 |  |
Source: ECB staff calculations.
3 Fiscal outlook
The euro area fiscal stance is projected to continue tightening in 2024, and to level off in later years (Table 3). The partial withdrawal of energy and inflation support measures is estimated to have resulted in a tightening of the fiscal stance (which is defined as the change in the cyclically adjusted primary balance[16]) in 2023 and a more significant tightening is expected in 2024. In 2025, the fiscal stance is projected to tighten only slightly on account of a further scaling-down of the remaining energy support measures and increases in direct taxes and social security contributions, partly compensated by limited increases in government investment and consumption. The fiscal stance is projected to be neutral in 2026. Compared with the December 2023 projections, the euro area fiscal stance remains broadly unchanged, as (rather limited) revisions at the country level and between various fiscal instruments largely cancel each other out.
Table 3
Fiscal outlook for the euro area
(percentage of GDP)
March 2024 | December 2023 | ||||||||
|---|---|---|---|---|---|---|---|---|---|
2022 | 2023 | 2024 | 2025 | 2026 | 2023 | 2024 | 2025 | 2026 | |
Fiscal stance (adjusted for NGEU grants)1) | 0.5 | 0.3 | 0.7 | 0.1 | 0.0 | 0.3 | 0.7 | 0.1 | 0.1 |
General government budget balance (percentage of GDP) | -3.6 | -3.2 | -2.9 | -2.8 | -2.8 | -3.1 | -2.8 | -2.7 | -2.6 |
Structural budget balance (percentage of GDP)2) | -3.5 | -3.2 | -2.6 | -2.6 | -2.7 | -3.2 | -2.7 | -2.6 | -2.7 |
General government gross debt (percentage of GDP) | 90.9 | 88.3 | 88.5 | 88.5 | 88.6 | 88.7 | 88.3 | 88.1 | 88.1 |
Note: Data are available for downloading from the Macroeconomic Projection Database on the ECB website.
1) The fiscal policy stance is measured as the change in the cyclically adjusted primary balance net of government support to the financial sector. The figures shown are also adjusted for expected grants under the Next Generation EU (NGEU) programme on the revenue side. A negative figure implies a loosening of the fiscal stance.
2) Calculated as the government balance net of transitory effects of the economic cycle and measures classified under the European System of Central Banks definition as temporary.
The euro area budget balance is set to improve over the projection horizon, but by less than was foreseen in the December 2023 projections, while the debt ratio is projected to follow a slight upward trend. The budget deficit is projected to decline in 2024 to 2.9% of GDP and to remain below the 3% reference value for the rest of the projection horizon. In 2026 the budget deficit is projected to be 0.8 percentage points below the 2022 figure. This is mainly due to a decrease in the cyclically adjusted primary deficit in 2023-25 which is seen to outweigh an increase in interest payments. Compared with the December 2023 projections, the somewhat higher deficit over the projection horizon stems from a deterioration in the cyclical component, which is partly compensated by downward revisions to interest payments that reflect more favourable financing conditions. The euro area debt-to-GDP ratio is estimated to have declined to 88.3% in 2023, but is projected to increase slightly by 2026, driven by primary deficits and expected positive deficit-debt adjustments, which are seen to be partly compensated by negative interest rate-growth differentials. After a favourable base effect from 2023, the debt-to-GDP ratio has been revised upwards over the projection horizon compared with the December 2023 projections, mostly on account of higher primary deficits.
4 Prices and costs
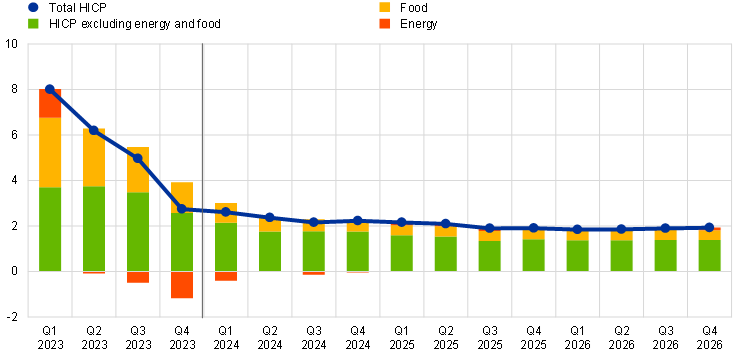
Headline HICP inflation is projected to significantly decline from 5.4% in 2023 to 2.3% in 2024 and then to fall further to 2.0% in 2025 and 1.9% in 2026 (Chart 4). Over the next few quarters, headline HICP inflation is expected to continue declining, though more gradually than before, exhibiting some volatility related to the base effects from the energy component and the timing of Easter this year.[17] A base effect-driven rebound in the annual rate of change in the energy component during the course of 2024 (Chart 5) is expected to partly offset the further moderation in HICP inflation excluding energy and food (HICPX) and in food inflation. Thereafter, the gradual decline in headline HICP inflation mainly reflects further moderation in HICPX inflation, as food and energy inflation rates are seen to move broadly sideways (Chart 6).
Chart 4
Euro area HICP inflation
(annual percentage changes)
Notes: The vertical line indicates the start of the current projection horizon. The ranges shown around the central projections for HICP inflation are based on past projection errors, after adjustment for outliers. The bands, from darkest to lightest, depict the 30%, 60% and 90% probabilities that the outcome of HICP inflation will fall within the respective intervals. For more information, see Box 6 of the March 2023 ECB staff macroeconomic projections for the euro area.
Chart 5
Cumulative impact of base effects from the energy component on headline HICP inflation from January 2024
(percentage points)
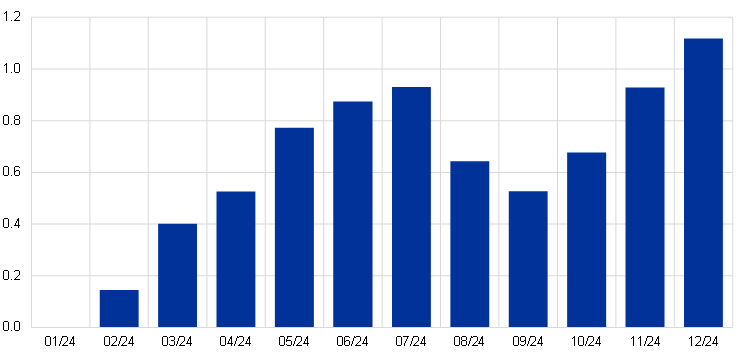
Sources: Eurostat and ECB calculations.
Notes: Base effects refer to the impact on changes in the annual inflation rate owing to exceptional price movements 12 months ago relative to a long-term average month-on-month rate. The cumulative impact of base effects is shown relative to a specific reference month. For example, energy base effects would imply a 0.8 percentage point increase in headline HICP inflation in May 2024 compared with the inflation rate in January 2024.
Energy inflation is projected to remain in negative territory for most of 2024, with some volatility related to base effects, before settling at rates close to zero in 2025 and early 2026, with renewed increases towards the end of the projection horizon. Following the drop in autumn 2023 energy inflation is expected to return to slightly positive territory by the end of 2024 owing to upward base effects, the unwinding of government energy compensation measures and the effects of the implementation of climate change measures in some countries. Between January and December 2024 upward base effects account for the expected swing in energy inflation, with the impact being partly offset by lower commodity prices. In addition, changes in energy and inflation compensatory fiscal measures from December 2023 are estimated to have an upward impact of 0.3 percentage points on headline inflation in 2024. This is marginally lower than expected in the December 2023 projections owing to changes in the timing and the extent of the reversal of these measures in some countries. Once the upward base effects and the impact from the withdrawal of energy-related fiscal measures fade, slightly downward-sloping energy commodity price futures curves, coupled with upward impacts from some climate transition fiscal measures, imply HICP energy inflation rates close to zero in 2025 and 2026.
Food inflation is expected to decline strongly from 10.9% in 2023 to an average of 3.2% in 2024 because of receding pipeline pressures emanating from earlier input cost surges, before settling at 2.3% in 2025 and 2026. After strong declines in the first quarter of 2024, the annual inflation rate for food prices is envisaged to moderate more gradually for the rest of the year, owing to easing pipeline pressures in view of the decreases in energy and food commodity prices. On the other hand, continued dynamic labour cost pressures are envisaged to prevent a stronger unwinding and their delayed impact will sustain food inflation in the last two years of the projection horizon.
Chart 6
Euro area HICP inflation – decomposition into the main components
(annual percentage changes, percentage points)
Note: The vertical line indicates the start of the current projection horizon.
HICPX inflation is expected to continue declining as pipeline pressures fade, but at a more gradual pace than in the recent past as high labour cost pressures gradually feed through (Chart 7). HICPX inflation is expected to decline from 3.7% in the fourth quarter of 2023 to 2.5% in the fourth quarter of 2024 as the upward impacts from supply bottlenecks, post-pandemic reopening effects and indirect effects from past increases in energy and food prices fade, and as the downward impact from monetary policy tightening continues to feed through. The projections include negligible impacts from the Red Sea shipping disruptions on goods inflation, consistent with the assumption of a quick resolution of the tensions and the fact that shipping costs are often based on longer-term contracts.[18] Thereafter, HICPX inflation is projected to average 2.1% and 2.0% in 2025 and 2026 respectively, reflecting fading impacts from earlier pipeline pressures and supply bottlenecks, the normalisation of demand after post-pandemic reopening effects, and the monetary policy tightening. A faster unwinding is seen to be hindered by declining but still elevated upward pressures from labour cost developments which are partially buffered by profit margins.
Chart 7
Euro area HICP inflation excluding energy and food
(annual percentage changes)
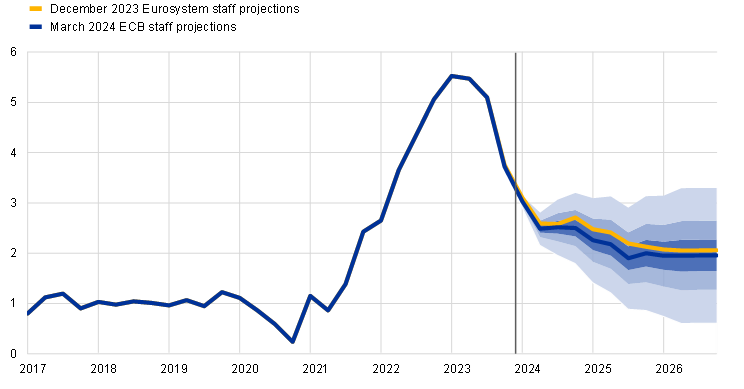
Notes: The vertical line indicates the start of the current projection horizon. The ranges shown around the central projections for HICPX inflation are based on past projection errors, after adjustment for outliers. The bands, from darkest to lightest, depict the 30%, 60% and 90% probabilities that the outcome of HICPX inflation will fall within the respective intervals. For more information, see Box 6 of the March 2023 ECB staff macroeconomic projections for the euro area.
Compared with the December 2023 projections, the outlook for headline HICP inflation has been revised down by 0.4 percentage points for 2024 and 0.1 percentage points for 2025, and is unrevised for 2026, while HICPX inflation has been revised down over the entire projection horizon. The downward revision to HICP inflation in 2024 is mainly due to the energy component, which is expected to be lower owing to recent data surprises and lower energy commodity prices. Indirect effects from lower energy prices are expected to gradually feed through. This, together with the weaker growth outlook and lower growth in unit labour costs, leads to downward revisions to HICPX inflation over the projection horizon. Headline inflation in 2026 is unrevised as a result of upward revisions to energy inflation owing to the more upward-sloping oil and gas price futures curves, which offset the downward revisions to the food and HICPX inflation rates.
Table 4
Price and cost developments for the euro area
(annual percentage changes)
March 2024 | December 2023 | ||||||||
|---|---|---|---|---|---|---|---|---|---|
2022 | 2023 | 2024 | 2025 | 2026 | 2023 | 2024 | 2025 | 2026 | |
HICP | 8.4 | 5.4 | 2.3 | 2.0 | 1.9 | 5.4 | 2.7 | 2.1 | 1.9 |
HICP energy | 37.0 | -2.0 | -1.6 | 0.5 | 0.6 | -1.9 | 1.2 | 0.3 | -0.1 |
HICP food | 9.0 | 10.9 | 3.2 | 2.3 | 2.3 | 10.9 | 3.2 | 2.5 | 2.3 |
HICP excluding energy | 5.1 | 6.3 | 2.7 | 2.2 | 2.0 | 6.3 | 2.8 | 2.4 | 2.1 |
HICP excluding energy and food | 3.9 | 4.9 | 2.6 | 2.1 | 2.0 | 5.0 | 2.7 | 2.3 | 2.1 |
HICP excluding energy, food and changes in indirect taxes1) | 3.9 | 4.9 | 2.6 | 2.1 | 2.0 | 5.0 | 2.7 | 2.3 | 2.1 |
GDP deflator | 4.6 | 5.9 | 2.9 | 2.3 | 1.9 | 5.6 | 2.9 | 2.5 | 1.9 |
Import deflator | 17.5 | -3.0 | -0.4 | 2.4 | 2.2 | -2.9 | 1.0 | 2.3 | 2.0 |
Unit labour costs | 3.3 | 6.2 | 4.4 | 2.3 | 1.7 | 6.1 | 4.1 | 2.6 | 2.0 |
Compensation per employee | 4.5 | 5.3 | 4.5 | 3.6 | 3.0 | 5.3 | 4.6 | 3.8 | 3.3 |
Labour productivity2) | 1.2 | -0.8 | 0.1 | 1.2 | 1.2 | -0.8 | 0.4 | 1.1 | 1.2 |
Notes: The GDP and import deflators, unit labour costs, compensation per employee and labour productivity refer to seasonally and working day-adjusted data. Historical data may differ from the latest Eurostat publications owing to data releases after the cut-off date for the projections. Data are available for downloading, also at quarterly frequency, from the Macroeconomic Projection Database on the ECB website.
1) The sub-index is based on estimates of actual impacts of indirect taxes. This may differ from Eurostat data, which assume a full and immediate pass-through of indirect tax impacts to the HICP.
2) Measured as real GDP per person employed.
Nominal wage growth is projected to gradually decline, but to remain elevated, allowing for a catch-up of real wages to levels prevailing before the inflation surge, by 2025. Growth in compensation per employee is estimated to have declined in the fourth quarter of 2023 and is projected to continue moderating over the projection horizon, while remaining elevated compared with historical levels owing to still tight labour markets, inflation compensation and increases in minimum wages. At the end of the horizon it is seen to reach 3.0%, a rate broadly corresponding to the sum of projected productivity growth and inflation. Compared with the December 2023 projections, the growth rate for 2024 has been revised down slightly as lower wage drift owing to a weaker economic outlook is expected to more than offset stronger growth in negotiated wages. For 2025 and 2026, compensation per employee growth was also revised down, reflecting an expected earlier recovery in real wages and corresponding expectations of somewhat lower demand for inflation compensation. Growth in unit labour costs is expected to have peaked in 2023 and is projected to decline notably, benefiting in part from the projected rise in productivity growth (Chart 8).
Chart 8
Decomposition of euro area unit labour costs
(annual percentage changes; percentage points)
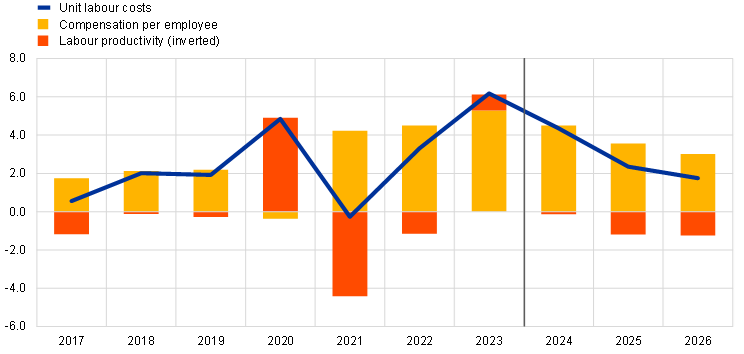
Note: The vertical line indicates the start of the current projection horizon.
Domestic price pressures, as measured by the growth of the GDP deflator, are projected to continue to decrease gradually with profit growth first providing a buffer for high labour cost pressure and subsequently recovering (Chart 9). The annual growth rate of the GDP deflator peaked at 6.3% in the first quarter of 2023 and is projected to continue to recede quickly, averaging 2.9% in 2024 and declining more gradually thereafter to an average of 1.9% in 2026. Unit profit growth also peaked in early 2023 and has since slowed. It is expected to turn negative in 2024, implying that profits will buffer the relatively strong labour cost growth. As growth in unit labour costs moderates, unit profit growth is expected to recover somewhat from 2025, helped by a robust economic recovery and strengthening productivity growth.[19]
Chart 9
Euro area GDP deflator – income side decomposition
(annual percentage changes, percentage points)

Note: The vertical line indicates the start of the current projection horizon.
After a slightly negative annual rate in 2024, import price inflation is expected to hover somewhat above 2% in the later years of the horizon. Growth in the import deflator is expected to have dropped sharply from 17.5% in 2022 to -3.0% and -0.4% in 2023 and 2024 respectively. It is expected to turn positive in the second half of 2024 and to stand at 2.4% in 2025 and 2.2% in 2026, broadly in line with the projected path for export competitors’ prices (Box 2).
Box 4
Sensitivity analysis: alternative energy and food price paths
Future energy commodity price developments are very uncertain and alternative paths for oil and gas commodity prices would have a significant impact on the economic outlook, especially for inflation. While the staff projections are based on the technical assumptions outlined in Box 1, in this analysis alternative downside and upside paths are derived from the 25th and 75th percentiles of the options-implied neutral densities for both oil and gas prices.[20] While the oil price distribution is almost symmetric, the gas price distribution indicates pronounced upside risks to the technical assumptions entailed in the March 2024 projections. In addition, a constant price assumption is considered for both oil and gas prices. In each case, a synthetic energy price index (a weighted average of the oil and gas price paths) is computed and the impacts of the alternative paths are assessed with a range of ECB and Eurosystem macroeconomic models used in the projections. The average impacts on real GDP growth and HICP inflation across these models are shown in Table A.
Table A
Impacts of alternative energy price paths
Path 1: 25th percentile | Path 2: 75th percentile | Path 3: constant prices | |||||||
|---|---|---|---|---|---|---|---|---|---|
2024 | 2025 | 2026 | 2024 | 2025 | 2026 | 2024 | 2025 | 2026 | |
(deviation from baseline levels, percentages) | |||||||||
Synthetic energy price index | -14.6 | -19.6 | -25.5 | 17.0 | 25.2 | 37.4 | 2.8 | 3.8 | 9.6 |
(deviations from baseline growth rates, percentage points) | |||||||||
Real GDP growth | 0.0 | 0.1 | 0.1 | 0.0 | -0.2 | -0.1 | 0.0 | 0.0 | 0.0 |
HICP inflation | -0.5 | -0.6 | -0.5 | 0.6 | 0.8 | 0.6 | 0.1 | 0.1 | 0.2 |
Notes: In this sensitivity analysis, a synthetic energy price index that combines oil and gas futures prices is used. The 25th and 75th percentiles refer to the option-implied neutral densities for the oil and gas prices on 9 February 2024. The constant oil and gas prices take the respective value as at the same date. The macroeconomic impacts are reported as averages of a number of ECB and Eurosystem staff macroeconomic models.
A similar sensitivity analysis is conducted with alternative paths for international food prices, which are slightly tilted to the upside. This analysis assumes that from the second quarter of 2024 international food commodity prices for wheat and maize follow the 10th and 90th percentiles of option-implied prices on the cut-off date for the staff projections. The distributions are slightly tilted to the upside, likely reflecting a combination of weather and climate change-related risks. These upside risks include the current El Niño phenomenon, which is expected to subside during the second quarter of 2024 but could lead to lagged upward effects on food prices in the next couple of years and is likely to be followed by a La Niña period that usually generates droughts in South America. The upside risks also include the continued possibility of disruptions to global grain supplies stemming from the war in Ukraine. The impacts of these alternative paths on the euro area real GDP growth and inflation projections are assessed using elasticities from the Eurosystem macroeconomic models used in the projections. The impacts on euro area real GDP growth from these alternative food price paths would be negligible, while the impacts on HICP inflation are shown in Table B.
Table B
Impacts of alternative food price paths
(deviations from baseline growth rates, percentage points)
Path 1: 10th percentile | Path 2: 90th percentile | |||||
|---|---|---|---|---|---|---|
2024 | 2025 | 2026 | 2024 | 2025 | 2026 | |
International wheat price | -10.4 | -8.4 | -0.4 | 16.1 | 10.5 | 1.1 |
International maize price | -11.0 | -12.4 | -2.7 | 16.9 | 14.2 | 7.3 |
HICP inflation | -0.1 | -0.1 | -0.1 | 0.1 | 0.2 | 0.1 |
Notes: In this sensitivity analysis, the 10th and 90th percentiles refer to the option-implied neutral densities for the wheat and maize prices on 9 February 2024. The paths from option-implied densities are transformed into an impact on euro area farm gate prices. The macroeconomic impacts are computed using elasticities from the Eurosystem macroeconomic models used in the projections.
Box 5
Comparison with forecasts by other institutions and the private sector
The March 2024 ECB staff projections are largely within the range of other forecasts. For 2024, the ECB staff growth projection is in the middle part of the range, in line with the average of all other forecasters and with the recent forecasts from the OECD and the Survey of Professional Forecasters (SPF), while it is slightly above the Consensus Economics forecast and below the recent European Commission forecast. It is in the upper part of the range for 2025 and slightly above the other available forecasts for 2026. As regards HICP inflation, for 2024, the ECB staff projection is at the bottom of the range, in line with the Consensus Economics forecast, but markedly below the European Commission forecast which assumes more persistent disruptions in the Red Sea to have a stronger upward impact on inflation. For 2025, the ECB staff projection is at the bottom of a rather narrow range, in line with the SPF forecast and the Consensus Economics forecast. For 2026, the ECB staff inflation projection is slightly below the other available forecasts for that year.
Table
Comparison of recent forecasts for euro area real GDP growth and HICP inflation
(annual percentage changes)
| Date of release | Real GDP growth | HICP inflation | ||||
|---|---|---|---|---|---|---|---|
2024 | 2025 | 2026 | 2024 | 2025 | 2026 | ||
ECB staff projections | March 2024 | 0.6 | 1.5 | 1.6 | 2.3 | 2.0 | 1.9 |
European Commission | February 2024 | 0.8 | 1.5 | - | 2.7 | 2.2 | - |
Consensus Economics | February 2024 | 0.5 | 1.3 | 1.5 | 2.3 | 2.0 | 2.0 |
OECD | February 2024 | 0.6 | 1.3 | - | 2.6 | 2.2 | - |
IMF | January 2024 | 0.9 | 1.7 | - | 2.8 | 2.1 | - |
Survey of Professional Forecasters | January 2024 | 0.6 | 1.3 | 1.4 | 2.4 | 2.0 | 2.0 |
Sources: European Commission Winter 2024 (Interim) Economic Forecast, 15 February 2024; Consensus Economics Forecasts, 15 February 2024 (data for 2026 taken from the January 2024 survey); OECD Interim Economic Outlook, 5 February 2024; IMF World Economic Outlook Update, 30 January 2024; ECB Survey of Professional Forecasters, 26 January 2024.
Notes: These forecasts are not directly comparable with one another or with the ECB staff macroeconomic projections, as these were finalised at different points in time. Additionally, these forecasts use different methods to derive assumptions for fiscal, financial and external variables, including oil, gas and other commodity prices. The ECB staff macroeconomic projections report working day-adjusted annual growth rates for real GDP, whereas the European Commission and the IMF report annual growth rates that are not adjusted for the number of working days per annum. Other forecasts do not specify whether they report working day-adjusted or non-working day-adjusted data.
© European Central Bank, 2024
Postal address 60640 Frankfurt am Main, Germany
Telephone +49 69 1344 0
Website www.ecb.europa.eu
All rights reserved. Reproduction for educational and non-commercial purposes is permitted provided that the source is acknowledged.
For specific terminology please refer to the ECB glossary (available in English only).
PDF ISBN 978-92-899-6535-4, ISSN 2529-4466, doi:10.2866/594111, QB-CE-24-001-EN-N
HTML ISBN 978-92-899-6528-6, ISSN 2529-4466, doi:10.2866/056361, QB-CE-24-001-EN-Q
The cut-off date for technical assumptions, such as those for oil prices and exchange rates, was 9 February 2024. The projections for the global economy were finalised on 12 February and the macroeconomic projections for the euro area were finalised on 21 February 2024. The current projection exercise covers the period 2024-26. Projections over such a long horizon are subject to very high uncertainty, and this should be borne in mind when interpreting them. See the article entitled “The performance of the Eurosystem/ECB staff macroeconomic projections since the financial crisis”, Economic Bulletin, Issue 8, ECB, 2019. For an accessible version of the data underlying selected tables and charts, see http://www.ecb.europa.eu/pub/projections/html/index.en.html. A full database of past ECB and Eurosystem staff macroeconomic projections is available from the Macroeconomic Projection Database on the ECB website. This database also includes more variables than are presented in this report and many at quarterly frequency.
Eurostat’s first breakdown of real GDP growth in the fourth quarter of 2023 will not be published until after the publication of the March 2024 ECB staff projections. The breakdown mentioned here is based on preliminary information from some euro area countries and estimates by ECB staff.
Such destocking may be related to firms’ assessment that their inventory levels are adequate, given subdued demand and the increased costs for maintaining inventories owing to higher interest rates.
See the box entitled “A model-based assessment of the macroeconomic impact of the ECB’s monetary policy tightening since December 2021”, Economic Bulletin, Issue 3, ECB, 2023.
The assumption for euro area ten-year nominal government bond yields is based on the weighted country average of ten-year benchmark bond yields, weighted by annual GDP figures and extended by the forward path derived from the ECB’s euro area all-bonds ten-year par yield, with the initial discrepancy between the two series kept constant over the projection horizon. The spreads between country-specific government bond yields and the corresponding euro area average are assumed to be constant over the projection horizon.
The technical assumptions for commodity prices are based on the path implied by futures markets, taking the average of the two-week period ending on the cut-off date of 9 February 2024.
References to world and/or global aggregates of economic indicators throughout this box exclude the euro area.
Since mid-December 2023 major container-shipping companies have paused or suspended their services in the Red Sea.
This was considered in the scenario analysis of a potential further escalation of the conflict in the Middle East described in Box 3 of the December 2023 Eurosystem Staff Macroeconomic Projections.
These developments are in line with historical regularities suggesting that trade disruptions in the Red Sea have a limited impact on oil prices. Moreover, at the current juncture, prices are further subdued owing to the oil supply surplus at the global level.
See Ferrari Minesso, M., Lappe, M.-S. and Rößler, D., “Geopolitical risk and oil prices”, Economic Bulletin, Issue 8, European Central Bank, 2024.
In December 2023 a daily average of 76 tankers carrying oil and fuel were in the south Red Sea and Gulf of Aden, just three tankers below the average for the first eleven months of 2023.
Results for the global aggregates are based on a Bayesian vector autoregression (BVAR) with four variables: the Federal Reserve Bank of New York’s Global Supply Chain Pressure Index (GSCPI), world (excluding the euro area) imports, world (excluding the euro area) export prices in national currencies and oil prices in US dollars. The model is estimated at quarterly frequency from the first quarter of 1998 to the first quarter of 2023. The identification of the model’s four shocks (global demand, energy, supply bottlenecks and other supply) is based on zero and sign restrictions. For euro area exports, a BVAR at monthly frequency from March 2003 to November 2023 is used, including the euro area synthetic energy price index, energy-intensive to non-energy-intensive industrial production, HICP inflation, goods exports and the nominal effective exchange rate of the euro, as well as the GSCPI and world (excluding euro area) imports. Foreign demand, bottlenecks, energy supply and a nominal effective exchange rate shock are identified using sign restrictions.
This scenario does not include additional assumptions concerning the effect of shipping disruptions on energy prices. Instead, the reaction of oil prices to shipping disruptions are determined by the BVAR and are found to be small.
For example, research suggests that following the permanent closure of the Suez Canal between 1967 and 1975, the 79 country pairs with resulting distance increases of over 50% experienced an average fall in trade of over 20%. See Feyrer, J., “Distance, trade, and income – The 1967 to 1975 closing of the Suez Canal as a natural experiment”, Journal of Development Economics, Vol. 153, 2021.
The fiscal stance is also adjusted for NGEU grants. See the notes to Table 3.
The earlier timing of Easter in 2024 compared with the previous year is estimated to add 0.1 percentage points to the annual HICP inflation rate in March and subtract 0.1 percentage points in April (which implies that in April the annual inflation rate could be expected to decline by 0.2 percentage points compared with March solely owing to this effect). The impact will be larger for HICPX inflation and particularly services inflation, as the earlier timing of Easter will mainly affect developments in package holiday prices.
The impact on inflation could be somewhat stronger if the Red Sea disruptions were to escalate and be more protracted. For further details on such a scenario, see Box 3.
For more information on the GDP deflator decomposition and the role of unit profits for inflation analysis, see the box by E. Hahn, entitled “How have unit profits contributed to the recent strengthening of euro area domestic price pressures?”, Economic Bulletin, Issue 4, ECB, 2023; as well as Arce, O., Hahn, E. and Koester, G., “How tit-for-tat inflation can make everyone poorer”, ECB Blog, 30 March 2023.
The market prices used are those prevailing on 9 February 2024 (the cut-off date for the technical assumptions).
-
7 March 2024