
Economic Bulletin Issue 8, 2020
Economic and monetary developments
Overview
At its monetary policy meeting on 10 December 2020, the Governing Council decided to recalibrate its monetary policy instruments. While the rebound in economic activity in the third quarter was stronger than expected and the prospects for the roll-out of vaccines are encouraging, the coronavirus (COVID-19) pandemic continues to pose serious risks to public health and to the euro area and global economies. The resurgence in COVID-19 cases and the associated containment measures are significantly restricting euro area economic activity, which is expected to have contracted in the fourth quarter of 2020. While activity in the manufacturing sector continues to hold up well, services activity is being severely curbed by the increase in infection rates and the new restrictions on social interaction and mobility. Inflation remains very low in the context of weak demand and significant slack in labour and product markets. Overall, the incoming data and the December 2020 Eurosystem staff macroeconomic projections suggest a more pronounced near-term impact of the pandemic on the economy and a more protracted weakness in inflation than previously envisaged. Against this background, the Governing Council decided to recalibrate its monetary policy instruments at its meeting on 10 December 2020.
Economic and monetary assessment at the time of the Governing Council meeting of 10 December 2020
The global economy rebounded strongly in the third quarter of 2020 and this was followed by continued growth momentum at the start of the fourth quarter, but headwinds cloud the near-term economic outlook. While recent news about the development of effective vaccines against the coronavirus has sparked financial market optimism, the short-term global economic outlook remains clouded by the pandemic. The significant rise in the number of new COVID-19 infections, particularly in advanced economies, has led to the reintroduction of containment measures, although these measures are seen as less disruptive to economic activity than those implemented during the first wave of the pandemic. According to the December 2020 Eurosystem staff macroeconomic projections, global real GDP (excluding the euro area) will contract by 3.0% this year and expand by 5.8% in 2021, before growing by 3.9% and 3.6% in 2022 and 2023 respectively. Global trade (excluding the euro area) contracted more sharply than real GDP in 2020, but is expected to rebound more strongly in 2021. This primarily reflects the more pronounced procyclicality of trade, especially during economic downturns. These adverse effects are expected to be less severe in the context of the recent resurgence in infections. The balance of risks around the global economic outlook is seen as less negative than previously expected, as, given the news about the viability of several vaccines, it is less likely that the severe scenario will materialise.
Overall, financial conditions in the euro area have loosened somewhat further since the Governing Council’s meeting in September 2020, amid improved risk sentiment on the back of positive announcements about vaccines. Over the review period (10 September to 9 December 2020) the forward curve of the euro overnight index average (EONIA) fluctuated somewhat, but ultimately remained broadly unchanged. This reflects concerns about the accelerated spread of COVID-19 in Europe set against positive news about vaccines. The curve continues to be inverted only slightly at the short end. Long-term sovereign bond yields and spreads dropped significantly in the euro area over this period, amid expectations of continued monetary and fiscal support together with a global improvement in risk sentiment, triggered in particular by the news of successful vaccine trials. The prices of risk assets increased accordingly. In foreign exchange markets, the euro depreciated slightly in trade-weighted terms.
Following a sharp contraction in the first half of 2020, euro area real GDP rebounded strongly and rose by 12.5%, quarter on quarter, in the third quarter, although remaining well below pre-pandemic levels. The second wave of the pandemic and the associated intensification of containment measures observed since mid-October are expected to result in a renewed significant decline in activity in the fourth quarter, although to a much lesser extent than observed in the second quarter of this year. Economic developments continue to be uneven across sectors, with activity in the services sector being more adversely affected by the new restrictions on social interaction and mobility than activity in the industrial sector. Although fiscal policy measures are supporting households and firms, consumers remain cautious in the light of the pandemic and its ramifications for employment and earnings. Moreover, weaker corporate balance sheets and uncertainty about the economic outlook are weighing on business investment. Looking ahead, recent advances in the development of COVID-19 vaccines allow for greater confidence in the assumption of a gradual resolution of the health crisis. However, it will take time until widespread immunity is achieved, while further resurgences in infections, with challenges to public health and economic prospects, cannot be ruled out. Over the medium term, the recovery of the euro area economy should be supported by favourable financing conditions, an expansionary fiscal stance and a recovery in demand as containment measures are lifted and uncertainty recedes.
This assessment is broadly reflected in the baseline scenario of the December 2020 Eurosystem staff macroeconomic projections for the euro area. These projections foresee annual real GDP growth at -7.3% in 2020, 3.9% in 2021, 4.2% in 2022 and 2.1% in 2023. Compared with the September 2020 ECB staff macroeconomic projections, the outlook for economic activity has been revised downwards in the short term but is seen to broadly recover to the level projected in the September baseline scenario over the medium term. Overall, the risks surrounding the euro area growth outlook remain tilted to the downside, but have become less pronounced. While the news about the prospects for vaccine roll-outs is encouraging, downside risks remain related to the implications of the pandemic for economic and financial conditions.
According to Eurostat’s flash estimate, euro area annual inflation remained unchanged at -0.3% in November. On the basis of oil price dynamics and taking into account the temporary reduction in the German VAT rate, headline inflation is likely to remain negative until early 2021. Thereafter, it is expected to increase owing to the end of the temporary VAT reduction in Germany and upward base effects in energy price inflation. At the same time, underlying price pressures are expected to remain subdued owing to weak demand, notably in the tourism and travel-related sectors, as well as to low wage pressures and the historically high level of the effective exchange rate of the euro. Once the impact of the pandemic fades, a recovery in demand, supported by accommodative fiscal and monetary policies, will put upward pressure on inflation over the medium term. Market-based indicators and survey-based measures of longer-term inflation expectations remain at low levels.
This assessment is broadly reflected in the baseline scenario of the December 2020 Eurosystem staff macroeconomic projections for the euro area, which foresees annual inflation at 0.2% in 2020, 1.0% in 2021, 1.1% in 2022 and 1.4% in 2023. Compared with the September 2020 ECB staff macroeconomic projections, the outlook for inflation has been revised down for 2020 and 2022. Annual HICP inflation excluding energy and food is expected to be 0.7% in 2020, 0.8% in 2021 and 1.0% in 2022, before increasing to 1.2% in 2023.
The coronavirus pandemic has continued to influence monetary dynamics in the euro area. Broad money (M3) growth remained broadly unchanged at 10.5% in October 2020. Strong money growth has been supported by the ongoing asset purchases by the Eurosystem, which have become the largest source of money creation. In the context of a still heightened preference for liquidity and a low opportunity cost of holding the most liquid forms of money, the narrow monetary aggregate M1 continues to be the main contributor to broad money growth. The growth of lending to the private sector has plateaued, while still recording higher growth rates than prior to the COVID-19 pandemic. The annual growth rate of loans to non-financial corporations fell to 6.8% in October, after 7.1% in September. This deceleration has occurred in the context of abating emergency liquidity needs, weak investment and tighter credit conditions on loans to firms. The annual growth rate of loans to households stood at 3.1% in October, unchanged from September. The Governing Council’s policy measures, together with the measures adopted by national governments and European institutions, remain essential to support bank lending conditions and access to financing, in particular for those most affected by the ramifications of the pandemic.
Substantial fiscal support has mitigated the significant negative impact of the coronavirus pandemic on the real economy. The fiscal cost of this support has been very substantial for all euro area countries, although it has varied markedly across countries. As a result of the economic downturn and the fiscal support, the general government budget deficit in the euro area is projected to increase significantly to 8.0% of GDP in 2020 from 0.6% in 2019, according to the December 2020 Eurosystem staff macroeconomic projections. Thereafter, the deficit ratio is expected to decline to 6.1% of GDP in 2021, 3.9% in 2022 and 3.0% in 2023. The improvement is expected to be led by the phasing-out of the emergency containment measures, while the cyclical component will only improve significantly from 2022. An ambitious and coordinated fiscal stance remains critical, in view of the sharp contraction in the euro area economy, although fiscal measures should be targeted and temporary. At the same time, weak demand from firms and households and the heightened risk of a delayed recovery in the light of the new lockdowns owing to the second wave of the pandemic warrant continued support from national fiscal policies. The Next Generation EU fund, which complements the fiscal measures implemented at the national level, will contribute to a faster, stronger and more uniform recovery and will increase economic resilience and the growth potential of EU Member States’ economies, particularly if the funds are deployed for productive public spending and accompanied by productivity-enhancing structural policies.
The monetary policy package
In view of the economic fallout from the resurgence of the pandemic and the resulting protracted weakness in inflation, on 10 December 2020 the Governing Council recalibrated its monetary policy instruments to preserve favourable financing conditions over the pandemic period, ultimately supporting economic activity and the robust convergence of inflation to levels that are below, but close to, 2% over the medium term.
- The Governing Council decided to keep the key ECB interest rates unchanged. They are expected to remain at their present or lower levels until the inflation outlook robustly converges to a level sufficiently close to, but below, 2% within the projection horizon, and such convergence has been consistently reflected in underlying inflation dynamics.
- The Governing Council decided to increase the envelope of the pandemic emergency purchase programme (PEPP) by €500 billion to a total of €1,850 billion. It also extended the horizon for net purchases under the PEPP to at least the end of March 2022. In any case, the Eurosystem will conduct net purchases until the Governing Council judges that the coronavirus crisis phase is over. The Eurosystem will conduct purchases under the PEPP to preserve favourable financing conditions over this extended period. It will purchase flexibly according to market conditions and with a view to preventing a tightening of financing conditions that is inconsistent with countering the downward impact of the pandemic on the projected path of inflation. In addition, the flexibility of purchases over time, across asset classes and among jurisdictions will continue to support the smooth transmission of monetary policy. If favourable financing conditions can be maintained with asset purchase flows that do not exhaust the envelope over the net purchase horizon of the PEPP, the envelope need not be used in full. Equally, the envelope can be recalibrated if required to maintain favourable financing conditions to help counter the negative pandemic shock to the path of inflation. The extension of the PEPP purchases over a longer horizon reflects the prolonged fallout from the pandemic for the economy and inflation. It allows for a continuous market presence and more durable support from the Governing Council’s monetary stimulus. Preserving favourable financing conditions over the pandemic period will help to reduce uncertainty and bolster confidence, thereby encouraging consumer spending and business investment, and, ultimately, underpinning the economic recovery and helping to offset the downward impact of the pandemic on the projected path of inflation. Finally, the Governing Council also decided to extend the reinvestment of principal payments from maturing securities purchased under the PEPP until at least the end of 2023. In any case, the future roll-off of the PEPP portfolio will be managed to avoid interference with the appropriate monetary policy stance.
- The Governing Council decided to further recalibrate the conditions of the third series of targeted longer-term refinancing operations (TLTRO III). Specifically, it decided to extend the period over which considerably more favourable terms will apply by twelve months, to June 2022. Furthermore, the Governing Council will conduct three additional operations between June and December 2021. Moreover, the Governing Council decided to raise the total amount that counterparties will be entitled to borrow in TLTRO III operations from 50% to 55% of their stock of eligible loans. In order to provide an incentive for banks to sustain the current level of bank lending, the recalibrated TLTRO III borrowing conditions will be made available only to banks that achieve a new lending performance target. The extension of the pandemic-related low interest rate period under TLTRO III, the addition of more operations and the increase in the amount that can potentially be borrowed will preserve the very attractive funding conditions for banks. This will help to ensure that they can continue to offer favourable lending conditions and have ample liquidity to extend loans to households and firms.
- The Governing Council decided to extend to June 2022 the duration of the set of collateral easing measures adopted by the Governing Council on 7 and 22 April 2020. The extension of these measures will continue to ensure that banks can make full use of the Eurosystem’s liquidity operations, most notably the recalibrated TLTROs. The Governing Council will reassess the collateral easing measures before June 2022, ensuring that Eurosystem counterparties’ participation in TLTRO III operations is not adversely affected.
- The Governing Council also decided to offer four additional pandemic emergency longer-term refinancing operations (PELTROs) in 2021, which will continue to provide an effective liquidity backstop.
- Net purchases under the asset purchase programme (APP) will continue at a monthly pace of €20 billion. The Governing Council continues to expect monthly net asset purchases under the APP to run for as long as necessary to reinforce the accommodative impact of the ECB’s policy rates, and to end shortly before the Governing Council starts raising the key ECB interest rates. In addition, the Governing Council intends to continue reinvesting, in full, the principal payments from maturing securities purchased under the APP for an extended period of time past the date when it starts raising the key ECB interest rates, and in any case for as long as necessary to maintain favourable liquidity conditions and an ample degree of monetary accommodation.
- The Eurosystem repo facility for central banks (EUREP) and all temporary swap and repo lines with non-euro area central banks will be extended until March 2022.
- Finally, the Governing Council decided to continue conducting its regular lending operations as fixed rate tender procedures with full allotment at the prevailing conditions for as long as necessary.
The monetary policy measures that the Governing Council has taken will contribute to preserving favourable financing conditions over the pandemic period, thereby supporting the flow of credit to all sectors of the economy, underpinning economic activity and safeguarding medium-term price stability. At the same time, uncertainty remains high, including with regard to the dynamics of the pandemic and the timing of vaccine roll-outs. The Governing Council will also continue to monitor developments in the exchange rate with regard to their possible implications for the medium-term inflation outlook. Therefore, the Governing Council continues to stand ready to adjust all of its instruments, as appropriate, to ensure that inflation moves towards its aim in a sustained manner, in line with its commitment to symmetry.
1 External environment
While recent developments regarding vaccines against the coronavirus (COVID-19) have sparked financial market optimism, the short-term global economic outlook remains clouded by the pandemic. The significant rise in the number of new COVID-19 infections, particularly in advanced economies, has been met with the re-introduction of containment measures, although these are seen as less disruptive to economic activity than those observed during the first wave of the pandemic. According to the December 2020 Eurosystem staff macroeconomic projections, global real GDP (excluding the euro area) will contract by 3.0% this year and expand by 5.8% in 2021, before growing by 3.9% and 3.6% in 2022 and 2023 respectively. Global trade (excluding the euro area) has contracted more sharply than real GDP in 2020, but the rebound in 2021 is likewise expected to be stronger. This reflects mainly the more pronounced procyclicality of trade, especially during economic downturns. Moreover, the containment measures introduced in response to the resurgence of infections are expected to be less disruptive to trade than those observed in the first wave. The balance of risks around the global outlook is seen as less negative, as the news about the viability of several vaccines makes it less likely that the severe scenario considered in the December 2020 Eurosystem staff macroeconomic projections will materialise. As the outcome of the Brexit negotiations remained uncertain when the projections were finalised, the macroeconomic projections are based on the technical assumption that, as of 1 January 2021, the European Union (EU) and the United Kingdom will trade on the basis of the World Trade Organization’s most favoured nation terms. Other risks relate to the possibility that, in an effort to reduce their dependence on external suppliers, countries start to diversify global suppliers (potentially increasing resilience) and/or to re-shore production (negatively affecting complex global value chains).
Global economic activity and trade
The global economy staged a sharp rebound in the third quarter of 2020, which was stronger than previously envisaged. As the number of infections gradually abated and containment measures were lifted, the global economy started to rebound strongly. Economic recovery, especially among advanced economies, was supported mainly by private consumption, which was also propped up by the generous policy support deployed at the peak of the crisis. Across emerging market economies, net exports also contributed positively, given the recovery in external demand. In China, while private investment remained the main driver of the rebound, private consumption contributed positively to GDP growth for the first time in the year. Overall, global real GDP (excluding the euro area) expanded at a stronger pace than was envisaged in the September 2020 ECB staff macroeconomic projections.
Incoming survey data point to a continued growth momentum at the start of the fourth quarter, although consumer confidence remains weak. In November the global composite output Purchasing Managers’ Index (PMI) (excluding the euro area) improved further to 54.8 (from 54.1 in October), supported by an improvement in both the services and manufacturing sectors, suggesting a broadening of the economic recovery (see Chart 1). Developments were mixed across countries, as the composite output PMI increased further in the United States, but fell into contractionary territory in the United Kingdom, while remaining broadly unchanged and still in contractionary territory in Japan. Among emerging market economies, the composite PMI rose further in China, pointing to solid growth in activity, while it decreased in India and Brazil, albeit from very high levels, thus pointing to continued expansion in activity. At the same time, global consumer confidence, despite recovering from the trough recorded in the second quarter of 2020, remains below pre-crisis levels, suggesting a rather subdued recovery in consumption.
Chart 1
Global composite output PMI and consumer confidence
(diffusion indices)

Sources: Markit and ECB calculations.
Note: The latest observations are for November 2020 (PMI) and September 2020 (consumer confidence).
A number of headwinds, not least the renewed containment measures in response to rising numbers of COVID-19 infections, cloud the near-term economic outlook. The resurgence in COVID-19 infections weighs on the global economic recovery. Compared with governments’ responses to COVID-19 in the spring, containment measures during the second wave, while heterogeneous across countries, tend to be more targeted and less disruptive to economic activity. However, the resurgence of the virus is expected to weigh on agents’ behaviour, particularly in the most contact-intense sectors. Moreover, the unwinding of the temporary support extended by governments in the course of 2020 may lead to a “fiscal cliff” in 2021, particularly across advanced economies, unless additional fiscal stimulus is provided for in their 2021 budgetary plans. Finally, the elevated uncertainty as to the nature of post-transition trading relations between the EU and the United Kingdom, including those for services, is assumed to weigh on the growth outlook.
Global financial conditions continued to ease in recent months amid some volatility. The recovery in risky assets, which had started in late March, came to a temporary halt in September on the back of rising global cases of COVID-19, heightened uncertainty related to the US presidential elections on 3 November and the deteriorating odds of a fiscal deal ahead of the election. Subsequently, the news of imminently available vaccines sparked a rally in equity prices around the globe, while corporate and sovereign spreads declined and investors lost some appetite for safe haven assets such as gold and US dollar-denominated assets, which also led to a broad-based depreciation of the US dollar. The outcome of the US election also helped to reduce uncertainty and support investors’ risk appetite. This optimism was tempered as COVID-19 cases continued to surge and lockdowns were re-imposed. Global financial conditions now stand at highly accommodative levels in both advanced and emerging market economies. Yet they remain highly dependent on monetary policy support and are sensitive to global risk.
After contracting by 3.0% in 2020, global real GDP (excluding the euro area) is projected to rebound in 2021, before moderating in 2022 and 2023. Compared with the September 2020 ECB staff macroeconomic projections, global real GDP growth (excluding the euro area) for 2020 has been revised upwards (+0.7 percentage points) on account of the stronger than envisaged rebound in the third quarter. The forecast for 2021 assumes a gradual relaxation of the containment measures as medical solutions, such as effective vaccines, become increasingly available and are deployed across the population. However, the pace of the recovery differs across regions, with emerging market economies projected to make the largest contribution to the rebound in global GDP growth over the projection horizon. China accounts for about half of the post-pandemic recovery. It was effective in containing the spread of the virus early on and provided significant policy stimulus, such that growth had already returned to pre-pandemic levels by mid-2020. China is the only large economy expected to record positive growth in 2020. Compared with the September 2020 ECB staff macroeconomic projections, global real GDP (excluding the euro area) is projected to expand at a rate of 5.8% and 3.9% in 2021 and 2022 respectively (revised by -0.4 percentage points and +0.1 percentage points respectively). Given the complex nature of the COVID-19 shock, its long-term effects on the global economy remain an open question. In particular, given that the pandemic hit labour-intensive sectors harder, long-term scars may initially materialise via lower labour supply, but also via the capital stock, as was the case in past financial crises (see Box 1).
In the United States, the resurgence of COVID-19 infections and fading fiscal stimulus cloud the near-term outlook. Real GDP increased by 33.1% annualised (7.4% quarter on quarter) in the third quarter. This was driven by a strong recovery in consumption and investment, which was in turn reflected in a sharp recovery in real imports. Despite the exceptionally strong rebound, US activity remains below its pre-pandemic level. As the number of new COVID-19 infections and hospitalisations has risen above previous peaks, new restrictions on mobility have been implemented across states. The waning effects of fiscal stimulus on households’ income, amid the failure to agree on a new stimulus package, were only partly offset by the unwinding of savings accumulated in previous quarters. As a result, consumption is expected to slow in the current quarter, as also suggested by high-frequency indicators on credit and debit card data. Labour market conditions have improved, but the recovery remains incomplete. The unemployment rate has fallen amid a decline in temporary layoffs, but the number of new job postings remains subdued, suggesting weak employment gains in the near term. Annual headline consumer price index (CPI) inflation decreased to 1.2% in October from 1.4% in September, reflecting falling energy prices, while food prices remained unchanged. Core inflation declined marginally to 1.6%, from 1.7% in September, as a further increase in core goods inflation, particularly in used cars and trucks, was more than offset by a decline in core services, mainly in medical services.
In China, the economic recovery has been swift and has broadened to the service sector. After the sharp rebound in the second quarter (+11.7% quarter on quarter), China’s GDP continued to expand in the third quarter, albeit at a more moderate pace (+2.7% quarter on quarter). Final consumption contributed positively to growth, while investment has been more resilient, also owing to government support for infrastructure spending, which helped jump-start the recovery after the initial sharp contraction. Net exports contributed positively to growth, partly reflecting China’s role in supplying medical and technology goods worldwide. Monthly data point to continued robust growth in the fourth quarter. PMIs for both manufacturing and services output point to further improvements in activity in November. Industrial production has recovered robustly, and retail sales strengthened further in October. Annual headline inflation decreased in October to 0.5%, from 1.7% in the previous month, mainly owing to a decline in food prices.
In Japan, domestic and external demand supported the economic recovery, but the pace of expansion is set to decelerate amid an increase in COVID-19 infections. Real GDP in the third quarter expanded by 5.3% (quarter on quarter). In particular, the easing of domestic containment measures, a strong policy response, and a recovery in external demand supported private consumption and exports, while investment activity remained subdued amid still elevated uncertainty. The recovery is expected to continue, albeit at a moderate pace. To some extent, this reflects growing concerns related to a recent surge in new infections. The Bank of Japan announced a special deposit facility to enhance the resilience of the regional financial system, while the government recently announced a third supplementary budget for the fiscal year 2020, which should both provide some support to activity in coming quarters. Annual headline CPI inflation declined further in October to -0.4%, from 0% in September, albeit mostly reflecting idiosyncratic factors, such as the fading impact of the VAT hike introduced in October 2019.
In the United Kingdom, the economic recovery is faltering amid renewed lockdown measures. The economy rebounded in the third quarter (+15.5% quarter on quarter), supported by a strong recovery in consumption, while the contribution of net exports was negative. However, the growth momentum is set to reverse. Incoming surveys suggest a significant slowdown in growth momentum since August, even ahead of the month-long national lockdown imposed in November on the non-essential retail, food, accommodation and leisure sectors (accounting for around 12% of value added in the economy). Although these measures constrain activity less compared with the strict lockdown introduced in the spring, the composite PMI fell back into contractionary territory in November. Meanwhile, subdued labour market prospects constrain consumption, and uncertainty relating to the post-transition trading relations, including services, continue to restrain private investment. Given that the December 2020 Eurosystem staff macroeconomic projections were finalised before the recent Brexit agreement, the baseline for the United Kingdom rests on the technical assumption that the trading relationship between the United Kingdom and the EU will default to WTO/MFN terms on 1 January 2021. In particular, some stockpiling of imports in the United Kingdom is assumed in the fourth quarter of 2020, which would then unwind in early 2021. Inflation picked up in October, slightly ahead of expectations, with annual headline consumer price inflation increasing to 0.7% from 0.5% in the previous month. The rise was driven by a rebound from negative territory in goods’ prices, while annual service price inflation remained flat at 1.4%. Core CPI inflation also increased slightly to 1.5%.
In central and eastern European countries, the economic recovery is expected to come to a temporary halt as the pandemic situation deteriorates. Real GDP in the region rebounded sharply in the third quarter as production normalised amid the easing of containment measures. However, the pandemic has been re-intensifying across the region, with daily new infections rising above the levels recorded in the first wave. As stringency indicators have been tightening in most central and eastern European countries, the recovery is expected to stall until early 2021. Thereafter, the easing of restrictions and health-related concerns is expected to revive growth, also supported by robust fiscal and monetary measures. Looking ahead, activity is expected to remain below its end-2019 levels until early 2022.
In large commodity-exporting countries, the pace of recovery is set to slow amid a still high number of infections and reduced room for further fiscal support. In Russia, the economy is expected to recover in the third quarter owing to policy support and improved infection control. Moreover, the temporary easing of OPEC+[1] production cuts supported recent oil production, and the recovery in growth of key trading partners has further supported energy exports. However, as the number of infections is again on the rise, growth is set to slow again in the fourth quarter. In Brazil, the economy has rebounded, helped by strong monetary and fiscal policy support measures that were among the largest in Latin America. However, the number of COVID-19 cases remains high. While limited adoption of containment measures has reduced the economic repercussions of the initial shock, it has intensified the severity of the pandemic itself. Elevated infection rates together with limited fiscal space going forward will also drag on investment and consumption, and ultimately on the economic recovery path, with moderate growth rates forecast in the short and medium term.
In Turkey, the economic impact of COVID-19 was sharp but short-lived, and the rebound in manufacturing activity is driving the economic recovery. The sharp upturn in the third quarter (+15.6% quarter on quarter) reflects strong private consumption and investment in view of the very favourable financing conditions. The manufacturing sector is driving the recovery, although services have also picked up significantly from the deep slump at the peak of the crisis. Overall, economic activity in Turkey has recovered to pre-pandemic levels. However, as the policy stimulus is gradually reduced, growth is expected to moderate, particularly in credit-driven personal consumption.
Global trade (excluding the euro area) also rebounded vigorously in the third quarter and is expected to moderate in the fourth. World merchandise imports (excluding the euro area) continued to expand in September (3.4% month on month) after recording a 1.9% increase in August. Overall, these data confirm a solid recovery of world trade in the third quarter (+9.4% quarter on quarter), after the strong contraction registered in the second quarter (-9.7% quarter on quarter) (see Chart 2). The strong rebound in the third quarter reflects the composition of the economic recovery and the more orderly functioning of global value chains, but trade in services is still seen to weigh on global trade, as some sectors (for example, tourism) collapsed as a result of the COVID-19 shock. Survey data point to a continued, but moderating, pace of growth in the fourth quarter. The global PMI (excluding the euro area) for manufacturing new export orders, which correlates well with global trade, rose in November to 51.5, up from 50.3 in October.
Chart 2
Surveys and global trade in goods (excluding the euro area)
(left-hand scale: three-month-on-three-month percentage changes; right-hand scale: diffusion indices)

Sources: Markit, CPB Netherlands Bureau for Economic Policy Analysis and ECB calculations.
Notes: The latest observations are for November 2020 for the PMI data and September 2020 for global merchandise imports. The indices and data refer to the global aggregate excluding the euro area.
After contracting by 9.2% in 2020, global trade (excluding the euro area) is projected to rebound in 2021 and to expand at a more moderate pace over 2022-23. The sharp fall in global imports (excluding the euro area) in 2020 compared with economic activity reflects their strong procyclicality, in particular during economic downturns. Temporary disruptions in global supply chains and increased trade costs as a result of the COVID-19 containment measures also took a toll on global trade in the first half of 2020. Compared with the September 2020 ECB staff projections, the growth rate of global trade (excluding the euro area) in 2020 has been revised upwards (+4.5 percentage points), mainly reflecting the strong rebound in the third quarter. This lifts the level of global imports compared with the path forecast in the September 2020 ECB staff macroeconomic projections, implying a smaller gap vis-à-vis the pre-COVID baseline trajectory, but still pointing to an incomplete recovery. According to the December 2020 Eurosystem staff macroeconomic projections, global trade is projected to expand by 7.1% in 2021, 3.9% in 2022 and 3.4% in 2023. Euro area foreign demand is projected to decline by 10.7% in 2020 and to grow by 6.6% in 2021, 4.1% in 2022 and 3.4% in 2023.
Global economic prospects remain subject to a number of risks, although the balance of risks surrounding the outlook is assessed as more benign. As uncertainty about the timing of a full resolution of the health crisis continues to surround the global economy, in the December 2020 Eurosystem staff macroeconomic projections, the baseline is complemented by two alternative scenarios,[2] namely a mild and a severe scenario. These scenarios can be seen as providing an illustrative range around the baseline projection. News about the development of effective vaccines has boosted confidence that the pandemic may be successfully contained and has made the materialisation of a severe scenario less likely. Furthermore, as the COVID-19 pandemic has exposed the dependence of several countries on external suppliers, this may result in efforts to diversify global suppliers (potentially increasing resilience) and/or to re-shore production (negatively affecting complex global value chains).
Global price developments
Oil prices have increased by almost 25% since mid-September. After the strong rebound over the summer, oil prices stalled in September and October. Since early November oil prices have risen, following positive trends in global financial markets as increasing prospects for the delivery of several vaccines raise the odds of a return to normality in 2021. Nonetheless, neither the International Energy Agency (IEA) nor OPEC anticipate a significant rise in oil demand until late 2021. Indeed, the IEA expects the recovery in oil demand to slow in the fourth quarter of 2020 amid the increase in new COVID-19 cases around the world. After having remained in contango (i.e. oil prices for delivery in the future are higher) since March, the futures curve again moved into backwardation (i.e. oil prices for delivery in the future are lower) in early December.
Global inflation remains subdued amid weak global demand. Annual consumer price inflation in member countries of the Organisation for Economic Co-operation and Development (OECD) eased slightly to 1.2% in October. Food price inflation remained steady at 3.6%, while the negative contribution of energy prices to headline inflation increased further. Annual OECD CPI excluding food and energy ticked downwards by 0.1 percentage points to 1.6% in October. Across advanced economies, headline annual consumer price inflation fell in the United States and turned negative in Japan (-0.4%) in October, but rose in the United Kingdom and Canada. Among major non-OECD emerging market economies, annual headline inflation increased in October in Russia, India and, more markedly, in Brazil, while it decreased in China.
Chart 3
OECD consumer price inflation
(year-on-year percentage changes; percentage point contributions)

Sources: OECD and ECB calculations.
Note: The latest observations are for October 2020.
The outlook for global inflation is expected to remain weak, although a recovery in demand may support prices going forward. The composition of the recovery will be a key determinant in the outlook for global inflation. While pent-up demand may support the recovery and push inflation higher, supply constraints could unwind quickly, creating disinflationary pressures. Euro area competitor export prices (in national currency) are expected to rebound at the start of 2021. It is foreseen that this will be driven by an improvement in the global environment and a recovery in commodity prices from the lows witnessed in April 2020, although producer price inflation is projected to contribute negatively, reflecting continued slack in the global economy. Euro area competitors’ export price inflation is projected to return to its long-term average towards the beginning of 2022.
2 Financial developments
Over the review period (10 September to 9 December 2020) the forward curve of the euro overnight index average (EONIA) fluctuated somewhat, but eventually remained broadly unchanged. This reflects concerns about the accelerated spread of coronavirus (COVID-19) in Europe set against positive vaccine news. As it continues to be inverted only mildly at the short end, the curve does not signal firm expectations of a rate cut in the very near term. Long-term sovereign bond spreads dropped significantly in the euro area amid further expectations of continued monetary and fiscal support together with a global improvement in risk sentiment, triggered in particular by the news of successful vaccine trials. The prices of risk assets increased accordingly. In foreign exchange markets, the euro depreciated slightly in trade-weighted terms.
The euro overnight index average (EONIA) and the new benchmark euro short-term rate (€STR) averaged -46 and -55 basis points respectively over the review period.[3] Excess liquidity increased by €475 billion to around €3,456 billion. This change mainly reflects asset purchases under the pandemic emergency purchase programme (PEPP) and the asset purchase programme (APP), as well as the settlement of targeted longer-term refinancing operations (TLTRO III) in September.
The EONIA forward curve is broadly unchanged compared with the start of the review period (see Chart 4). At the same time, the forward curve displayed discernible intra-period fluctuations. The inversion of the curve in the first part of the review period reflected concerns about the accelerated spread of COVID-19 in Europe, but the curve then flattened on 9 November when the first in a string of positive announcements about vaccines was made. Since then, the curve has remained broadly unchanged. The trough of the curve, which is 10 basis points below the current EONIA level of -47 basis points, corresponds to April 2022. The curve thus indicates that financial markets are not pricing in an imminent rate cut. Furthermore, surveys and model-based evidence suggest that short-term risk-free rates are expected to remain stable over the coming months.
Chart 4
EONIA forward rates
(percentages per annum)
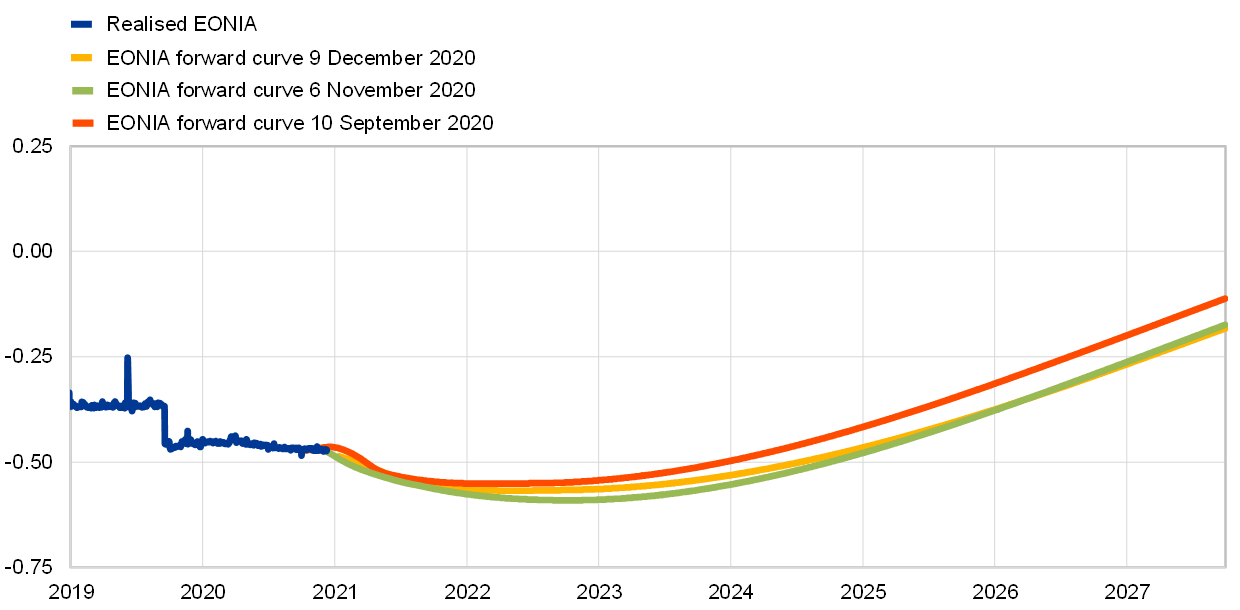
Sources: Refinitiv and ECB calculations.
Long-term sovereign bond yields dropped significantly in the euro area, while they increased markedly in the United States (see Chart 5). Specifically, the GDP-weighted euro area ten-year sovereign bond yield turned negative as it declined by 27 basis points to reach -0.25%. By contrast, the ten-year sovereign bond yield increased by 26 basis points in the United States, to 0.94%. The divergent developments across jurisdictions reflect heightened expectations that the ECB would increase its asset purchases under the PEPP. Furthermore, the Next Generation EU (NGEU) and Support to mitigate Unemployment Risks in an Emergency (SURE) programmes are likely to have contributed to a decline in euro area sovereign yields by compressing spreads via an improvement in Member States’ growth and fiscal prospects as well as in risk sentiment[4].
Chart 5
Ten-year sovereign bond yields
(percentages per annum)

Sources: Refinitiv and ECB calculations.
Notes: The vertical grey line denotes the start of the review period on 10 September 2020. The latest observations are for 9 December 2020.
The long-term spreads of euro area sovereign bonds relative to overnight index swap rates narrowed further amid expectations of continued monetary and fiscal support as well as a global improvement in risk sentiment (see Chart 6). The GDP-weighted euro area ten-year sovereign bond spread declined by 24 basis points to reach 0.07%, taking it below its pre-pandemic level. The decrease was especially pronounced in Italy, Portugal and Spain where the ten-year spreads narrowed by 50, 36 and 30 basis points respectively to 0.86%, 0.30% and 0.34%. The French and German ten-year spreads decreased more modestly, by 19 and 15 basis points respectively, to stand at -0.05% and -0.29%.
Chart 6
Ten-year euro area sovereign bond spreads vis-à-vis the overnight index swap rate
(percentage points)

Sources: Refinitiv and ECB calculations.
Notes: The spread is calculated by subtracting the ten-year overnight index swap rate from the ten-year sovereign bond yield. The vertical grey line denotes the start of the review period on 10 September 2020. The latest observations are for 9 December 2020.
Euro area and US equity prices traded in a stable range for large parts of the review period in spite of the intensification of the pandemic, before increasing significantly on the back of the vaccine news (see Chart 7). Stock prices were supported by a continued improvement in short-term earnings growth expectations, while longer-term earnings expectations were revised down, signalling downside macroeconomic risks and the potential for longer-term economic scars from the pandemic. At the same time, risk sentiment improved upon the vaccine news that started to emerge in early November, reducing the equity risk premium and supporting equity prices. Overall, the stock prices of euro area and US non-financial corporations (NFCs) increased by 9.2% and 10.0% respectively. The equity prices of euro area and US banks benefited to a larger extent from the news of successful vaccine trials, with indices increasing by 23.1% and 21.9% respectively, partly recovering the greater losses (compared to NFCs) recorded since the beginning of the pandemic.
Chart 7
Euro area and US equity price indices
(index: 1 January 2015 = 100)

Sources: Refinitiv and ECB calculations.
Notes: The vertical grey line denotes the start of the review period on 10 September 2020. The latest observations are for 9 December 2020.
Investment-grade corporate bond spreads decreased over the review period, including a significant drop upon the news of the first successful vaccine trials (see Chart 8). Spreads on investment-grade NFC bonds and financial sector bonds (relative to the risk-free rate) narrowed by 25 and 30 basis points respectively, and in particular decreased by about 5 basis points on 9 November, when the news of successful vaccine trials first reached the market. The overall decrease mainly reflects a decline in the excess bond premium, i.e. the component of corporate bond spreads that is not explained by credit fundamentals (as measured by ratings and expected default frequencies), which have remained broadly stable. Despite the further significant compression, corporate bond spreads remain slightly above pre-pandemic levels. High-yield corporate bond spreads also decreased significantly over the review period.
Chart 8
Euro area corporate bond spreads
(basis points)

Sources: Markit iBoxx indices and ECB calculations.
Notes: Spreads are calculated as asset swap spreads to the risk-free rate. The indices comprise bonds of different maturities (with at least one year remaining) with an investment-grade rating. The vertical grey line denotes the start of the review period on 10 September 2020. The latest observations are for 9 December 2020.
In foreign exchange markets, the euro depreciated slightly in trade-weighted terms (see Chart 9). The nominal effective exchange rate of the euro, as measured against the currencies of 42 of the euro area’s most important trading partners, depreciated by 0.3% over the review period, despite remaining only 1.9% below the historic high reached in December 2008. Regarding bilateral exchange rate developments, the euro continued to appreciate markedly against the US dollar (by 2.2%), reflecting the further broad weakening of the US dollar amid improving risk sentiment. In this context, the euro also appreciated slightly against the Japanese yen (by 0.2%) but remained broadly unchanged against the Swiss franc. At the same time, the euro weakened against the pound sterling (by 1.7%) as well as against the currencies of most major emerging markets, in particular the Chinese renminbi (by 2.3%) and the Korean won (by 6.5%).
Chart 9
Changes in the exchange rate of the euro vis-à-vis selected currencies
(percentage changes)
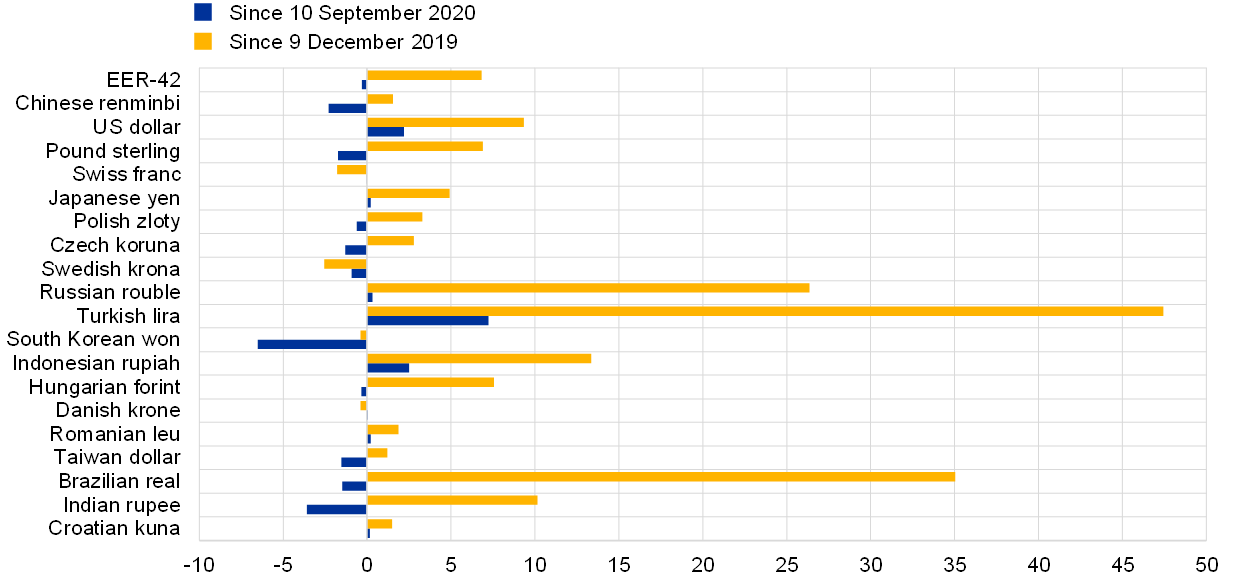
Source: ECB.
Notes: EER-42 is the nominal effective exchange rate of the euro against the currencies of 42 of the euro area’s most important trading partners. A positive (negative) change corresponds to an appreciation (depreciation) of the euro. All changes have been calculated using the foreign exchange rates prevailing on 9 December 2020.
3 Economic activity
Euro area real GDP grew strongly, by 12.5% quarter on quarter, in the third quarter of 2020. Economic activity in the euro area was underpinned by a sharp rebound in all demand components, as coronavirus (COVID-19) pandemic containment measures began to be lifted as of May 2020. This was reflected in positive contributions to GDP growth from private consumption, investment and net trade. Nonetheless, the level of GDP in the third quarter of 2020 remained 4.4% below its pre-pandemic level in the fourth quarter of 2019. Incoming information about the economy, including from surveys and high-frequency indicators, is consistent with a significant decline in activity in the final quarter of 2020, although to a much lesser extent than observed in the second quarter of this year, as a result of the sharp resurgence of the pandemic and the necessary reintroduction of containment measures since mid-October, primarily affecting the services sector. While real GDP is estimated to have contracted in the fourth quarter of 2020, the outlook for 2021 and beyond remains tightly linked to the evolution of the pandemic and the roll-out of COVID-19 vaccines. The December 2020 Eurosystem staff macroeconomic projections for the euro area foresee annual real GDP decreasing by 7.3% in 2020, and increasing by 3.9% in 2021, 4.2% in 2022 and 2.1% 2023. Compared with the September 2020 projections, real GDP growth has been revised upwards by 0.7 percentage points for 2020, downwards by 1.1 percentage points for 2021 and upwards by 1.0 percentage points for 2022, thereby broadly recovering to the level projected in the September baseline scenario over the medium term. Although downside risks to the outlook have become less pronounced owing to the news about the prospects for vaccine roll-outs in the near future, they remain tilted to the downside on account of the implications of the pandemic for economic and financial conditions.
Growth in the euro area rebounded strongly in the third quarter of 2020, but it is estimated to have receded again in the final quarter of the year. Real GDP bounced back by 12.5%, quarter on quarter, in the third quarter of 2020, partially recovering from the sharp and deep cumulative fall of 15.0% in the first half of the year (see Chart 10). Overall, the level of GDP in the third quarter of 2020 remained 4.4% below the level in the last quarter of 2019. Domestic demand made a positive contribution to growth in the third quarter of 2020, while changes in inventories made a small negative contribution. Developments in the external sector also supported euro area growth, as reflected in a positive contribution from net trade. When accounting for the import intensity of each demand component, external factors made a particularly strong contribution to growth dynamics in 2020 (see Box 4). On the production side, the rebound in the third quarter was driven by both manufacturing and services. However, developments varied markedly across sectors. This was particularly the case for services, where production remained significantly below its pre-pandemic level.
Chart 10
Euro area real GDP and its components
(quarter-on-quarter percentage changes and quarter-on-quarter percentage point contributions)

Source: Eurostat.
Note: The latest observations are for the third quarter of 2020.
The labour market situation improved somewhat in the third quarter, given the strong rebound in activity. Employment increased by 1.0% in the third quarter of 2020, after a decrease of 3.0% in the second quarter (see Chart 11). Despite this improvement, employment was 2.2% lower in the third quarter of 2020 than in the fourth quarter of 2019. Hours worked continue to play an important role in the adjustment of the labour market in the euro area. Total hours worked increased by 14.8% in the third quarter, after a decline of 13.6% in the second quarter, but remained 4.6% lower than in the fourth quarter of 2019. The unemployment rate was 8.4% in October, after having reached 8.7% in July, and remained about 1.2 percentage points higher than in February, before the pandemic. Job retention schemes continue to support the labour market. Workers in job retention schemes were estimated at about 5% of the labour force in October, down from about 18% in April, but the numbers are starting to rise again in some countries in response to the latest lockdown measures.[5]
Short-term labour market indicators have partially recovered, but continue to signal contractionary developments. The Purchasing Managers’ Index (PMI) for employment increased marginally to 48.3 in November from 48.2 in October. It has recovered significantly since April, when it reached its lowest level on record. However, the current level of the PMI continues to suggest a contraction in employment and could be read as an early indication of subdued employment prospects in the period ahead.
Chart 11
Euro area employment, PMI assessment of employment and unemployment
(quarter-on-quarter percentage changes; diffusion index; percentages of the labour force)

Sources: Eurostat, Markit and ECB calculations.
Notes: The PMI is expressed as a deviation from 50 divided by 10. The latest observations are for the third quarter of 2020 for employment, November 2020 for the PMI and October 2020 for the unemployment rate.
Following a substantial rebound in the third quarter, by 14.0% quarter on quarter, consumer spending started to falter again in the fourth quarter. While car registrations hovered close to their pre-pandemic level (down 4.1% year on year) in October, in the same month retail trade increased by 1.5%, month on month. It is likely that these do not yet capture the impact of the reintroduction of containment measures as of mid-October. By contrast, consumer confidence continued to decline in November, standing at -17.6, compared to -14.5 on average in the third quarter. In some euro area countries, consumption of durables already exceeded pre-pandemic levels by a small margin in the third quarter. However, this was overshadowed by the negative impact of services consumption, which is still far below historical trends. Households have become increasingly worried that their financial situation is deteriorating, so intentions to make major purchases have remained at their lowest level since the sovereign debt crisis. Owing to precautionary behaviour by consumers and tighter lockdown measures, the saving rate is expected to rise again in the fourth quarter.
Business investment (proxied by non-construction investment) increased strongly, by 13.6% quarter on quarter, in the third quarter of 2020, but the recovery faltered in the fourth quarter. Notwithstanding the sharp rebound, the level of non-construction investment remains 15.7% below the pre-crisis level. Despite a positive reading from the October and November PMI for capital goods (55.6 in November, up from 54.7 in September), investment is expected to decline in the fourth quarter, as the second wave of the pandemic is expected to have also had an impact on corporate profits. Moreover, business investment confidence further declined in November, while capacity utilisation remains well below its pre-crisis level, implying room to expand production with existing capital stock. At the same time, the relative resilience of the manufacturing sector to the new lockdowns may be seen as a positive sign for the investment outlook in the short term. However, looking further ahead, an increased debt burden, as reflected in higher corporate leverage ratios, poses downside risks to the recovery in investment.
Household investment (proxied by residential construction investment) also bounced back strongly, by 12.3% quarter on quarter, in the third quarter of 2020, but the short-term outlook remains uncertain. The strong rebound in the third quarter of 2020 fell short of a full recovery, as investment in residential construction still stood 3.8% below its end-2019 level. The pronounced cross-country diversity in housing dynamics during the first three quarters of 2020 should subside over the short term, as prospects are looking dim for all of the largest euro area countries, despite some positive signals at the start of the fourth quarter. The latest data on the issuance of building permits show a marked deceleration in the first half of the year, hinting at fewer construction plans in the pipeline. In October, the PMI for construction output and real estate services fell deeper into contractionary territory. After a small uptick in October, confidence among construction and real estate firms declined in November as the new round of measures to contain the second wave of the coronavirus since mid-October took a toll on business. Over the same period, companies in the construction and real estate sectors reported increasing supply-side constraints on their production, especially related to their financial conditions. On the demand side, according to the European Commission’s consumer survey, the new restrictions and the heightened uncertainty related to the resurgence of the pandemic discouraged households from spending on major items, including on new and existing housing stock, in November.
Euro area trade rebounded strongly and provided a positive contribution to GDP growth in the third quarter of 2020, but its recovery is set to slow down in the months ahead. While euro area real exports of goods more than regained the ground lost in the previous quarter, increasing by 20.1% quarter on quarter, euro area real exports of services only rebounded by 9.2%, following a decrease of 21.0%. The net trade contribution to GDP growth was markedly positive (2.4 percentage points). Data on trade in goods reveal that exports expanded across the board in September. Non-chemical manufactured goods exports, especially of machinery and transport equipment, had a stronger quarterly rebound in relative terms in the third quarter of 2020. This was particularly true for car exports. However, renewed lockdown measures are likely to disrupt the recovery pattern of euro area trade in the months ahead. Although still pointing to further improvement for trade in goods, the euro area PMI for new manufacturing export orders decreased to 53 in November, while the European Commission’s assessment of export order book levels improved only marginally in negative territory. On the other hand, the new COVID-19 restrictions are weighing on the already impaired trade in services, and the PMI for services new export orders declined further to 39.2.
High-frequency indicators and the latest survey results are consistent with a fall in GDP in the final quarter of 2020. There has been a clear downward trend in high-frequency mobility indicators for euro area countries in recent months, moving in tandem with a composite stringency index that has remained around half-way between its peak in April and subsequent trough in July. Survey indicators point to a renewed contraction in activity primarily affecting the services sector. In the case of tourism in particular, renewed travel restrictions in October are likely to reinforce the substitution of foreign tourism by domestic tourism seen during the first wave of the pandemic, suggesting an overall deterioration of tourism services in the last quarter of the year (see Box 5). The flash PMI composite output index decreased strongly from 50.0 in October to 45.3 in November, largely driven by a substantial decline in the index for services (from 46.9 to 41.7). Meanwhile, the index for manufacturing output also declined, but by much less, from 58.4 to 55.3, remaining consistent with expanding activity. However, the short-term outlook remains surrounded by elevated uncertainty, not least in view of the unusual changes in statistical and economic relationships during the COVID-19 pandemic (see Box 3 for a description of innovations in the ECB’s analytical toolkit to assess the short-term impact of the pandemic).
Looking ahead, expectations for growth in the medium term remain tightly linked to the gradual evolution of the pandemic and the successful roll-out of COVID-19 vaccines. While the early start to the distribution of vaccines is a key factor supporting the expectations of a rapid recovery, it will take time before widespread immunity is reached and the euro area and the global economy is able to return to “normality”. According to a survey of large corporations conducted to test what “normality” might look like in the long term, the pandemic is expected to lead to greater digitalisation and more teleworking, with the expectation of persistent higher productivity but at the same time also persistent lower demand (see Box 6). In this uncertain environment, and to reduce hysteresis risks, the ECB’s accommodative monetary conditions will continue to support domestic demand, while ongoing fiscal and employment measures should continue to support private consumption.
The December 2020 Eurosystem staff macroeconomic projections for the euro area foresee annual real GDP decreasing by 7.3% in 2020, and increasing by 3.9% in 2021, 4.2% in 2022 and 2.1% 2023 (see Chart 12). Compared with the September 2020 projections, real GDP growth has been revised upwards by 0.7 percentage points for 2020, downwards by 1.1 percentage points for 2021 and upwards by 1.0 percentage points for 2022, thereby broadly recovering to the level projected in the September baseline scenario over the medium term. Although downside risks to the outlook have become less pronounced owing to the news about the prospects for vaccine roll-outs in the near future, they remain tilted to the downside on account of the implications of the pandemic for economic and financial conditions.
Chart 12
Euro area real GDP (including projections)
(quarter-on-quarter percentage changes)
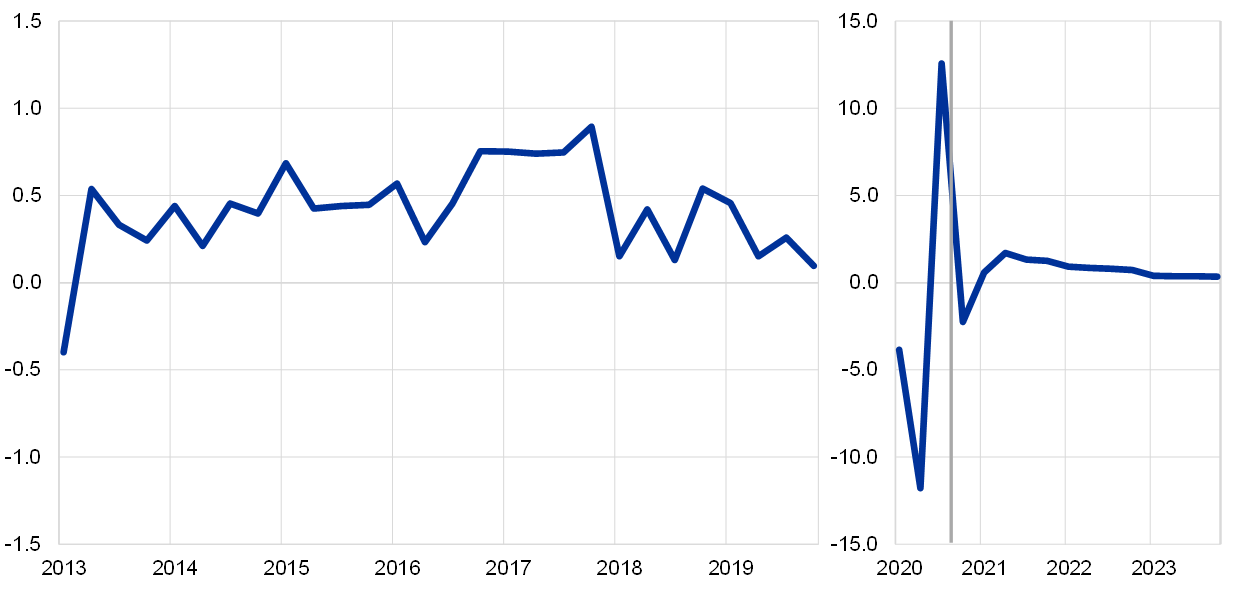
Sources: Eurostat and the article entitled “Eurosystem staff macroeconomic projections for the euro area, December 2020”, published on the ECB’s website on 10 December 2020.
Notes: In view of the unprecedented volatility in real GDP in the course of 2020, the chart uses a different scale from early 2020 onwards. The vertical line indicates the start of the projection horizon. The chart does not show ranges around the projections. This reflects the fact that, in the present circumstances, the standard computation of the ranges (based on historical projection errors) would not provide a reliable indication of the unprecedented uncertainty surrounding the current projections.
4 Prices and costs
According to Eurostat’s flash estimate, euro area annual inflation remained unchanged at -0.3 % in November. On the basis of oil price dynamics and taking into account the temporary reduction in the German VAT rate, headline inflation is likely to remain negative until early 2021. Thereafter, it is expected to increase owing to the end of the temporary VAT reduction in Germany and upward base effects in energy price inflation. At the same time, underlying price pressures are expected to remain subdued owing to weak demand, notably in the tourism and travel-related sectors, as well as to low wage pressures and the appreciation of the euro exchange rate. Once the impact of the pandemic fades, a recovery in demand, supported by accommodative fiscal and monetary policies, will put upward pressure on inflation over the medium term. Market-based indicators and survey-based measures of longer-term inflation expectations remain at low levels. This assessment is broadly reflected in the baseline scenario of the December 2020 Eurosystem staff macroeconomic projections for the euro area, which foresees annual inflation at 0.2% in 2020, 1.0% in 2021, 1.1% in 2022 and 1.4% in 2023. Compared with the September 2020 ECB staff macroeconomic projections, the outlook for inflation has been revised down for 2020 and 2022.
Headline inflation remained unchanged in November 2020. The unchanged inflation rate of -0.3% masked small movements in the main components: slightly more negative energy inflation and marginally lower food inflation and non-energy industrial goods inflation on the one hand, and an increase in services inflation on the other (see Chart 13).
Chart 13
Contributions of components of euro area headline HICP inflation
(annual percentage changes; percentage point contributions)

Sources: Eurostat and ECB calculations.
Notes: The latest observations are for November 2020. Growth rates for 2015 are distorted upwards owing to a methodological change (see the box entitled “A new method for the package holiday price index in Germany and its impact on HICP inflation rates”, Economic Bulletin, Issue 2, ECB, 2019).
Measures of underlying inflation stabilised at low levels. HICP inflation excluding energy and food (HICPX) remained unchanged for the third month in a row at the historical low of 0.2% in November. The unchanged inflation masks an increase in services inflation which rose to 0.6% in November from 0.4% in October, while non-energy industrial goods inflation fell to -0.3% in November from -0.1% in October. Other measures of underlying inflation, which are available up to October, stabilised at low levels. HICP inflation excluding energy, food, travel related items and clothing and the Persistent and Common Component of Inflation (PCCI) remained unchanged in October at 0.8% and 0.9%, respectively, while the Supercore indicator was down from 0.7% in September to 0.5% in October (see Chart 14).[6] Recent low readings in underlying inflation measures also reflect the temporary reduction in German VAT rates since July 2020.
Chart 14
Measures of underlying inflation
(annual percentage changes)

Sources: Eurostat and ECB calculations.
Notes: The latest observations are for November 2020 for HICP excluding energy and food and for October 2020 for all other measures. The range of measures of underlying inflation consists of the following: HICP excluding energy; HICP excluding energy and unprocessed food; HICP excluding energy and food; HICP excluding energy, food, travel-related items and clothing; the 10% trimmed mean of the HICP; the 30% trimmed mean of the HICP; and the weighted median of the HICP. PCCI stands for the Persistent and Common Component of Inflation indicator. Growth rates for the HICP excluding energy and food for 2015 are distorted upwards owing to a methodological change (see the box entitled “A new method for the package holiday price index in Germany and its impact on HICP inflation rates”, Economic Bulletin, Issue 2, ECB, 2019).
Pipeline price pressures for HICP non-energy industrial goods strengthened slightly. Inflation for imported non-food consumer goods increased to -1.2% in October, from -1.9% in September. Domestic producer price inflation for non-food consumer goods was unchanged at 0.7% in October, the same as in September and remaining close to its longer-term average. At the earlier input stages, the annual rate of change in producer prices for intermediate goods rose slightly from -1.6% in September to -1.3% in October, while the annual rate of change in import prices for intermediate goods recovered from -3.0% in September to -2.5% in October. Developments in import price inflation for both, non-food consumer goods and intermediate goods, could potentially reflect, at least in part, the fact that the appreciation of the euro exchange rate compared to one year ago did not continue in October.
Wage pressures are blurred by the impact of government support measures on compensation. Developments in compensation per employee and compensation per hour showed significant volatility and divergence between the two measures during the first three quarters of 2020. Annual growth in compensation per employee increased to 0.6% in the third quarter, after falling to -4.7% in the second quarter, from 0.6% in the first quarter and 1.7% in the fourth quarter of 2019. Annual growth in compensation per hour, on the other hand, rose from 2.0% in the fourth quarter of 2019 to 4.3% in the first quarter of 2020, and further to 9.3% in the second quarter, before falling to 3.0% in the third quarter of 2020 (see Chart 15). These divergent developments reflect the impact of short-time work and temporary lay-off schemes, under which workers maintained their employment status but only received part of their usual compensation, while actual hours worked per person declined sharply. This effect was partly reversed in the third quarter, in line with the rebound in activity. At the same time, the decrease in compensation per employee overstates the actual loss in labour income, as a number of countries record government support, for statistical purposes, under transfers rather than compensation.[7] Negotiated wages, which are not directly affected by developments in hours worked and the recording of benefits from job retention schemes, declined to 1.6% in the third quarter of 2020, from 1.7% in the second quarter, after 1.9% in the first quarter. While this implies only a slow weakening, the data still include agreements concluded before the onset of the pandemic.[8]
Chart 15
Decomposition of compensation per employee into compensation per hour and hours worked
(annual percentage changes; percentage point contributions)
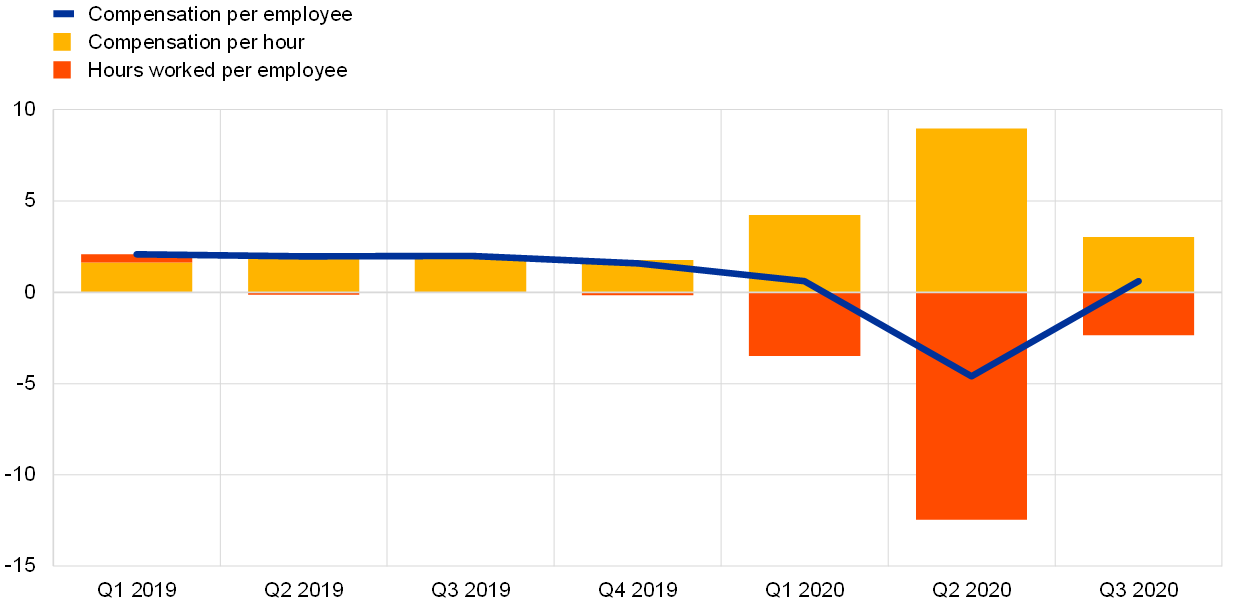
Sources: Eurostat and ECB calculations.
Notes: The latest observations are for the third quarter of 2020.
Market-based indicators of inflation expectations increased somewhat following positive news of successful coronavirus (COVID-19) vaccine trials that have lifted global risk sentiment, but nevertheless remained at very subdued levels (10 September to 9 December). After starting to edge down in late October in the face of renewed lockdowns, market-based measures of inflation expectations increased notably following the first of a series of announcements of successful COVID-19 vaccine trials in early November. For instance, the five-year forward inflation-linked swap (ILS) rate five years ahead – at 1.25% on 9 December – was quoted broadly within the range observed between mid-2019 and the onset of the pandemic. Even though shorter-term market-based indicators of inflation expectations have so far proved to be somewhat more resilient than in the first wave of the pandemic, the entire forward profile of market-based indicators of inflation expectations continues to point to a prolonged period of low inflation. Survey-based indicators of inflation expectations remained at historically low levels. According to the ECB Survey of Professional Forecasters for the fourth quarter of 2020, conducted in the first week of October 2020, as well as the latest releases from Consensus Economics and the Euro Zone Barometer in October, survey-based longer-term inflation expectations remained at or close to historically low levels.
Chart 16
Market-based indicators of inflation expectations
(annual percentage changes)

Sources: Thomson Reuters and ECB calculations.
Notes: The latest observations are for 9 December 2020.
The December 2020 Eurosystem staff macroeconomic projections foresee a gradual increase in headline inflation over the projection horizon. The baseline projections point to headline HICP inflation averaging 0.2% in 2020, 1.0% in 2021, 1.1% in 2022 and 1.4% in 2023 (see Chart 17). Compared with the September 2020 ECB staff projections, the projection for HICP inflation is revised down by 0.1 percentage points for 2020, unchanged for 2021 and revised downwards by 0.2 percentage points in 2022, on account of weaker incoming data for HICP inflation excluding energy and food and a downward reassessment of inflationary pressures since the previous projections in the context of abundant but diminishing slack in the goods and labour markets. The bounceback in 2021 reflects, to a large extent, base effects in HICP energy inflation related to the sharp fall in oil prices at the onset of the global COVID-19 outbreak, as well as the reversal of the VAT tax cut in Germany. Over the medium-term headline inflation is expected to gradually increase, mainly reflecting a slight rise in the contribution of HICP inflation excluding energy and food which, however, is seen to remain rather subdued. HICP inflation excluding energy and food is expected to be 0.7% in 2020, 0.8% in 2021 and 1.0% in 2022, before increasing to 1.2% in 2023.
Chart 17
Euro area HICP inflation (including projections)
(annual percentage changes)

Sources: Eurostat and the article entitled “Eurosystem staff macroeconomic projections for the euro area, December 2020”, published on the ECB’s website on 10 December 2020.
Notes: The vertical line indicates the start of the projection horizon. The latest observations are for the third quarter of 2020 (data) and the fourth quarter of 2023 (projection). The cut-off date for data included in the Eurosystem staff macroeconomic projections for the euro area, December 2020, was 25 November 2020.
5 Money and credit
Monetary dynamics in the euro area continued to reflect the impact of the coronavirus (COVID-19) pandemic. In October money growth stabilised at rates that were twice as high as before the pandemic, owing to the implementation of monetary policy measures and the preference for liquid assets. Domestic credit remained the main source of money creation, driven by loans to non-financial corporations (NFCs) and the Eurosystem’s net purchases of government bonds. The timely and sizeable measures taken by monetary, fiscal and supervisory authorities have ensured the flow of credit to the euro area economy at favourable terms. Firms’ total external financing levelled off in the third quarter of 2020. Small and medium-sized enterprises (SMEs), which depend critically on banks for financing, reported some slight improvements in their access to external finance in the period from April to October but expect a deterioration in coming months. Firms’ overall cost of debt financing is now close to the pre-pandemic level, as the cost of market-based debt moderated again, and bank lending rates remained close to historical lows. However, upward pressure on bank lending rates is expected, as the deteriorating credit risk environment is denting bank balance sheets and profitability.
Broad money growth was broadly unchanged in October. Monetary dynamics continued to suffer the effects of the COVID-19 pandemic, which has triggered an exceptional preference for liquidity. The annual growth rate of the broad monetary aggregate (M3) edged up slightly in October, to 10.5%, from 10.4% in September, stabilising at a level twice as high as before the onset of the pandemic (see Chart 18). The annual growth rate of the most liquid monetary aggregate, M1, which comprises overnight deposits and currency in circulation, remained stable at an elevated level of 13.8% in October, thus strongly contributing to M3 growth. These developments reflect the liquidity being built up by firms and households amid increased uncertainty, but also – in the case of households – some forced savings owing to reduced opportunities to consume. The strong growth in money was also the result of sizeable support measures taken by the ECB and supervisory authorities, as well as national governments, to ensure sufficient liquidity is provided to the economy to address the economic consequences of the pandemic.
Chart 18
M3, M1 and loans to the private sector
(annual percentage changes; adjusted for seasonal and calendar effects)

Source: ECB.
Notes: Loans are adjusted for loan sales, securitisation and notional cash pooling. The latest observations are for October 2020.
Strong growth in overnight deposits continues to reflect high uncertainty. Overnight deposits, which have been the main contributor to growth in M3, continued to expand at a relatively stable, yet very high, annual rate of 14.3% in October. Money holders’ preference for overnight deposits continued to reflect precautionary motives and the very low level of interest rates, which reduces the opportunity cost of holding such instruments, especially when compared with other, less liquid ones. The growth in deposits was mainly driven by holdings of firms and households. In the case of firms, growth in deposit holdings varied across jurisdictions, reflecting differences in the extent to which the liquidity needs of firms materialised and in the form and size of support measures across countries. Furthermore, currency in circulation grew at a broadly stable annual rate of 10.7% in October. By comparison, other short-term deposits and marketable instruments continued to make a small contribution to annual M3 growth, mirroring the low level of interest rates and the search-for-yield behaviour of investors.
Domestic credit has remained the main source of money creation as the contribution of the Eurosystem’s net asset purchases increased. From the start of 2018 to September 2020 credit growth to the private sector had been the main driver of M3 growth from the counterpart perspective (see the blue portion of the bars in Chart 19). In October 2020, however, the Eurosystem’s net purchases of government securities under the ECB’s asset purchase programme (APP) and the pandemic emergency purchase programme (PEPP) took over as the largest contributor to M3 growth (see the red portion of the bars in Chart 19). At the same time, the flow of credit from the banking sector (excluding the Eurosystem) to the public sector has moderated over recent months (see the light green portion of the bars in Chart 19). Net external monetary flows were broadly balanced in the 12 months to October (see the yellow portion of the bars in Chart 19), while longer-term financial liabilities and other counterparts exerted a negative impact on money growth (see the dark green portion of the bars in Chart 19). This was mainly due to the developments in other counterparts (in particular repurchase agreements), while favourable TLTRO conditions continued to support banks’ funding substitution, resulting in net redemptions in long-term bank bonds.
Chart 19
M3 and its counterparts
(annual percentage changes; contributions in percentage points; adjusted for seasonal and calendar effects)

Source: ECB.
Notes: Credit to the private sector includes MFI loans to the private sector and MFI holdings of debt securities issued by the euro area private non-MFI sector. As such, it also covers purchases by the Eurosystem of non-MFI debt securities under the corporate sector purchase programme and the PEPP. The latest observations are for October 2020.
Loan flows to the private sector have moderated. The annual growth rate of monetary financial institutions’ (MFI) loans to the private sector was unchanged at 4.6% in October, one percentage point higher than before the outbreak of the pandemic (see Chart 18). Shorter-term dynamics, however, point to a slowdown, as evidenced by the markedly lower monthly loan flows since June. Credit growth has continued to be driven mainly by loans to firms, with an annual growth rate of 6.8% in October, after 7.1% in September, while growth in loans to households remained stable at 3.1% (see Chart 20). The deceleration in the annual growth rate of loans to firms occurred in the context of abating emergency liquidity needs, weak investment and tighter credit conditions. Firms’ reliance on longer-term loans has continued to increase at the expense of shorter-term loans. The divergence in the dynamics of loans to firms and loans to households reflects the specific nature of the COVID-19 crisis, which has led to a collapse in corporate cash flows and has forced firms to increase their reliance on external financing.
Chart 20
MFI loans in selected euro area countries
(annual percentage changes)

Source: ECB.
Notes: Loans are adjusted for loan sales and securitisation; in the case of NFCs, loans are also adjusted for notional cash pooling. The cross-country standard deviation is calculated using a fixed sample of 12 euro area countries. The latest observations are for October 2020.
Small and medium-sized enterprises (SMEs) reported some slight improvements in their access to external finance over the past six months in comparison with early 2020, but they expect a deterioration going forward. According to the November 2020 survey on the access to finance of enterprises (SAFE), SMEs reported an improvement in access to public financial support for the first time since 2009, which suggests that the initiatives by a number of governments to provide public guarantees for bank loans during the COVID-19 pandemic have fed through to these enterprises (see Chart 21). At the same time, enterprises perceived their access to finance as being negatively affected by the general economic outlook, but also by their firm-specific outlook and capital position. Euro area firms also reported a marked deterioration in their turnover and profits, which was widespread across countries and sectors. Since the demand for external funds to bridge liquidity gaps increased markedly, the financing gap (the difference between the demand for and the availability of external financing) rose slightly further. Moreover, the SAFE results also showed that SMEs, and to a lesser extent large firms, expected a deterioration in the availability of most sources of external financing, in particular, bank loans and credit lines.
Chart 21
Factors affecting the availability of external financing to SMEs
(net percentages)

Source: ECB (SAFE).
Note: Data refer to rounds 3 (March-September 2010) to 23 (April 2020-October 2020) of SAFE.
Banks face favourable funding conditions but credit risk weighs on their balance sheets and profitability. The composite cost of debt financing for euro area banks, which had risen after the COVID-19 outbreak, has fallen back close to its pre-pandemic historical low of February 2020 (see Chart 22). This was due mainly to lower bond yields, supported by the ECB’s monetary policy measures. The ECB’s APP and PEPP are having a favourable impact on bond yields, which is also benefiting the pricing of securities issued by banks. Moreover, banks partly replaced market-based funding with TLTROs, thereby placing downward pressure on bank bond yields. Finally, prices for covered bank bonds are being directly supported by the ECB’s third covered bond purchase programme (CBPP3). In addition, deposit rates of euro area banks, which account for the bulk of bank funding, remained at historical lows in October 2020, thereby contributing to favourable bank debt funding conditions. Euro area banks have increasingly charged negative interest rates on NFC deposits held with them since the onset of the COVID-19 crisis. At the same time, a large part of banks’ deposit funding, in particular retail deposits, still has a zero-interest floor, which compresses banks’ net interest rate margins. Although banks are benefiting from favourable funding conditions, the deterioration in borrower creditworthiness owing to the pandemic is having a negative impact on their profitability and capital positions. As shown by the October 2020 euro area bank lending survey, banks tightened their credit standards in the third quarter of 2020, reflecting their heightened risk perception as a result of the pandemic.
Chart 22
Banks’ composite cost of debt financing
(composite cost of deposit and unsecured market-based debt financing; percentages per annum)
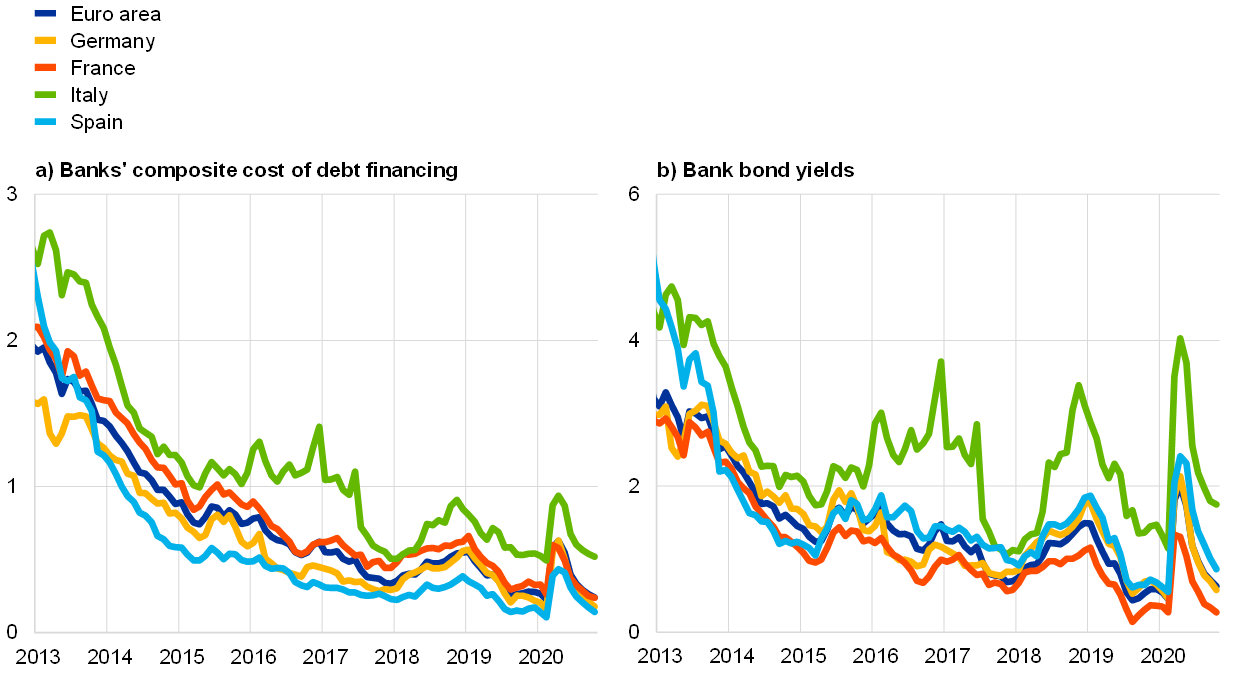
Sources: ECB, Markit iBoxx and ECB calculations.
Notes: The composite cost of deposits is calculated as an average of new business rates on overnight deposits, deposits with an agreed maturity and deposits redeemable at notice, weighted by their corresponding outstanding amounts. Bank bond yields refer to monthly averages of senior-tranche bonds. The latest observations are for October 2020.
Bank lending rates remain very favourable but upward pressure is expected. In October composite bank lending rates for loans to firms remained close to their historical lows at 1.53%, while those for loans to households for house purchase fell to a new historical low of 1.36% (see Chart 23). This development was widespread across euro area countries. Moreover, the spread between bank lending rates on very small loans and those on large loans stabilised at levels below those observed before the pandemic. At the same time, the severe economic impact of the pandemic on firms’ revenues, households’ employment prospects and overall borrower creditworthiness continued to put upward pressure on bank lending rates. The benign reaction of bank lending rates to the pandemic thus far appears to reflect two factors. First, the effectiveness of the measures taken by the ECB, bank supervisors and governments to offset the procyclical impact of the pandemic shock on credit supply. In this respect, the extension of government guarantee schemes for loans in some countries, at least until June 2021, will continue to shield bank lending rates from adverse developments in borrower credit risk. Second, the relative stickiness of bank lending rates in the short term as banks temporarily absorb some fluctuations in their cost components in an effort to maintain client relationships.
Chart 23
Composite bank lending rates in selected euro area countries
(percentages per annum; three-month moving averages)
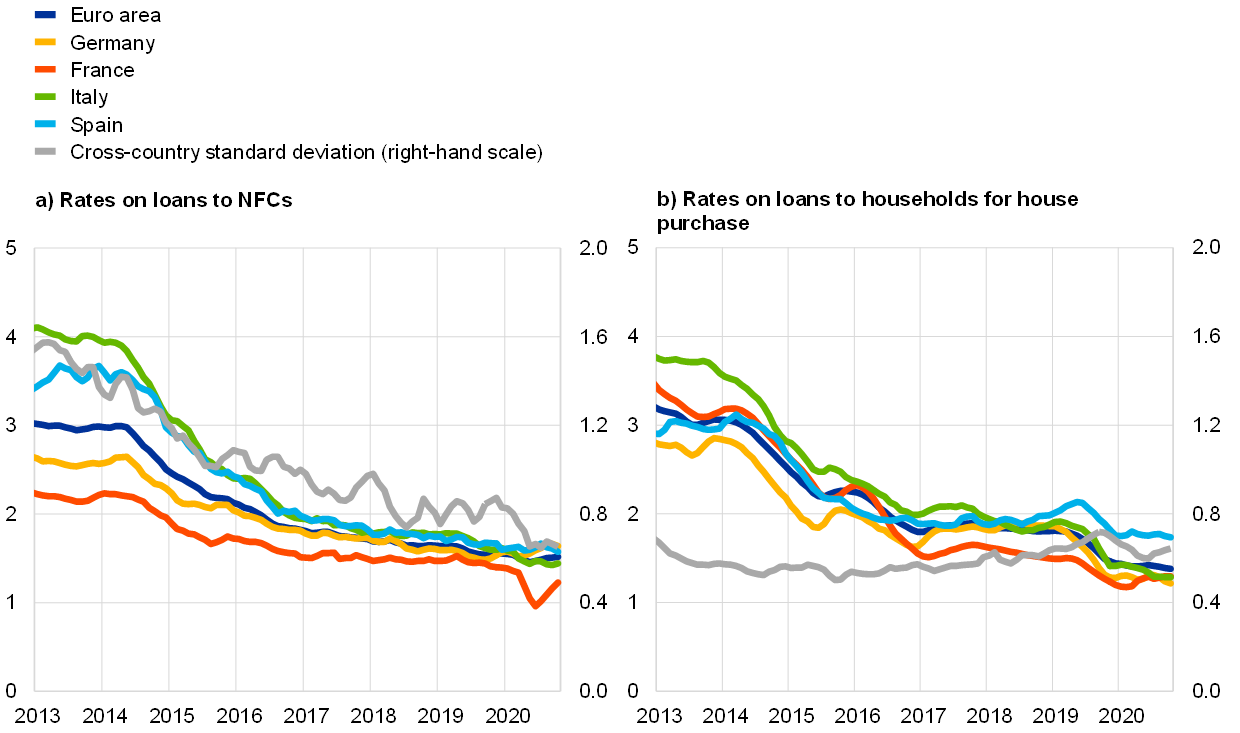
Source: ECB.
Notes: The indicator for the total cost of bank borrowing is calculated by aggregating short and long-term rates using a 24-month moving average of new business volumes. The cross-country standard deviation is calculated using a fixed sample of 12 euro area countries. The latest observations are for October 2020.
The annual flow of total external financing to euro area NFCs is estimated to have levelled off in the third quarter of 2020. This stabilisation reflects a slowdown in borrowing from banks and in net issuance of debt securities over the same quarter, having reached record highs in the second quarter (see panel (a) of Chart 24). The deterioration in firms’ operating cash flows and the resulting high financing needs were temporarily mitigated as a result of the relaxation of lockdown measures in the third quarter, given lower COVID-19 infection rates. The slowdown in external financing was also related to firms building up liquidity buffers earlier in the year (from March to June), leading to lower demand for credit in the third quarter. At the same time, the third quarter saw a surge in net issuance of listed shares, but this was concentrated in a few firms, mainly in the technology sector. Loan volumes from non-banks (non-MFIs) remained subdued in the third quarter. Overall, total external financing flows were still higher in the third quarter of 2020 than the quarterly average observed between 2016 and 2019, on the back of favourable financing conditions. The overall nominal cost of external financing for NFCs, comprising bank lending, debt issuance in the market and equity finance, stood at 4.5% at the end of October (see panel (b) of Chart 24). This level was around 40 basis points lower than the March 2020 local peak and 40 basis points higher than the historical low in June 2020. The decline between March and June was due to the sharp drop in the cost of equity and market-based debt. Between the end of October and the end of the reference period (9 December 2020), the overall cost of financing is estimated to have declined by around 15 basis points, to 4.4%, on account of a lower cost of both market-based debt and equity.
Chart 24
External financing of euro area NFCs
(annual flows in EUR billions – panel (a); percentages per annum – panel (b))

Sources: Eurostat, Dealogic, ECB, Merrill Lynch, Bloomberg, Thomson Reuters and ECB estimates.
Notes: Panel (a) – Net external financing is the sum of MFI loans, net issuance of debt securities, net issuance of listed shares and non-MFI loans. MFI loans are adjusted for sales, securitisation and cash pooling activities. Loans from non-MFIs include loans from other financial institutions and insurance corporations and pension funds net of securitised loans. The striped bar and light blue diamond indicate the nowcast for the third quarter of 2020. Panel (b) – The overall cost of financing for NFCs is calculated as a weighted average of the costs of bank borrowing, market-based debt and equity, based on their respective amounts outstanding. The dark blue diamond indicates the nowcast of the overall cost of financing for November 2020, assuming that bank lending rates remain unchanged at their October 2020 levels. The latest observations for panel (a) are for the second quarter of 2020 for euro area accounts data; estimates for the third quarter of 2020 are based on ECB balance sheet items (BSI) and securities (SEC) data and Dealogic. The latest observations for panel (b) are for 9 December 2020 for the cost of market-based debt (monthly average of daily data), 4 December 2020 for the cost of equity (weekly data) and October 2020 for the cost of lending (monthly data).
6 Fiscal developments
Substantial fiscal support, through both automatic stabilisers and discretionary measures by euro area governments, has mitigated the significant negative impact on the real economy from the coronavirus (COVID-19) pandemic. The fiscal cost of this support has been very substantial for all euro area countries, although it varies markedly across countries. As a result of the economic downturn and the fiscal support, the general government budget deficit in the euro area is projected to increase significantly to 8.0% of GDP in 2020, according to the December 2020 staff macroeconomic projections, from 0.6% in 2019. Thereafter, the deficit ratio is expected to decline to 6.1% of GDP in 2021 and to 3.9% and 3.0% in the subsequent two years. The improvement is expected to be led by the phasing-out of the emergency measures, while the cyclical component will only improve significantly from 2022 onwards. Reflecting the fiscal measures and the deteriorating economic situation, the euro area aggregate debt ratio is estimated to have risen sharply in 2020 and to peak in 2021, declining only very slowly thereafter. An ambitious and coordinated fiscal stance remains critical, in view of the sharp contraction in the euro area economy although fiscal measures taken in response to the pandemic emergency should, as much as possible, be targeted and temporary in nature. At the same time, weak demand from firms and households and the heightened risk of a delayed recovery in the light of the new lockdowns owing to the second wave of the pandemic warrant continued support from national fiscal policies. The Next Generation EU (NGEU) fund, which complements the fiscal measures at the national level, will contribute to a faster, stronger and more uniform recovery and will increase economic resilience and the growth potential of EU Member States’ economies, particularly if the funds are deployed for productive public spending and accompanied by productivity-enhancing structural policies.
According to the December 2020 Eurosystem staff macroeconomic projections, the euro area general government budget balance is projected to decline strongly in 2020 and to recover gradually thereafter.[9] Based on these projections, the general government deficit ratio for the euro area is expected to increase from 0.6% of GDP in 2019 to 8.0% of GDP in 2020, before declining to 6.1% in 2021 and further to 3.9% and 3.0% in 2022 and 2023 respectively (see Chart 25). The decline in the budget balance in 2020 is to a large extent attributable to a deterioration in the cyclically adjusted primary balance on the back of economic support measures amounting to around 4.5% of GDP, of which the largest part is additional spending, particularly in the form of transfers and subsidies to firms and households, including through short-time work or furlough schemes. This decline is also the result of a large negative cyclical component, in line with a sharp deterioration of output in the euro area.[10] The subsequent improvement in the budget balance is initially projected to be driven by a recovery in the cyclically adjusted primary balance as part of the emergency measures is phased out from 2021. The contribution from the economic cycle is expected to improve significantly only from 2022 and remains negative throughout the projection horizon. These fiscal projections are, however, surrounded by exceptional uncertainty, not least as regards the size, timing and composition of NGEU spending but also more generally, as economic policies necessarily have to react as the pandemic evolves.
Chart 25
Budget balance and its components
(percentage of GDP)

Sources: ECB and December 2020 Eurosystem staff macroeconomic projections.
Note: The data refer to the aggregate general government sector of the euro area.
In addition to the fiscal support for their economies, euro area countries have provided sizeable loan guarantee envelopes to bolster the liquidity position of firms. In total, these guarantees amount to around 17% of GDP for the euro area as a whole, but the size of the envelopes differs substantially across countries. The loan guarantees are contingent liabilities for governments and any amount of guarantees called on will therefore constitute additional public spending that raises government debt.
Compared with the September 2020 ECB staff macroeconomic projections, the euro area fiscal outlook is projected to be less negative in 2020 but more negative in both 2021 and 2022. The euro area general government budget balance as a share of GDP has been revised up by 0.8 percentage points for 2020 and down by 1.2 and 0.3 percentage points for 2021 and 2022 respectively. The lower fiscal deficit in 2020 is due mainly to a less negative cyclically adjusted balance but also to a slightly less negative cyclical component. This picture is expected to reverse over the next two years, when both the cyclically adjusted balance and the cyclical component should be more negative than previously expected.
The aggregate fiscal stance has been highly expansionary in 2020 but a moderate reduction in support is expected in 2021-22 as emergency measures are gradually phased out.[11] The fiscal stance is estimated to have been mildly expansionary in 2019 but is expected to be highly accommodative at 4.8% of GDP in 2020. By contrast, in 2021 and 2022 it is projected to tighten moderately by 1.5% and 0.8% of GDP, respectively, and in 2023 to be broadly neutral. This path reflects a gradual phasing-out of exceptional pandemic emergency measures from 2021 onwards. Notwithstanding the gradual tightening, the overall fiscal balance will remain substantially negative, with fiscal instruments continuing to support the economic recovery over the whole forecast horizon.The euro area aggregate public debt-to-GDP ratio increased strongly in 2020 and is projected to peak at around 100% in 2021, before declining very gradually. Debt ratio increases of 14.5 and 1.5 percentage points in 2020 and 2021, respectively, largely reflect high primary deficits and, in 2020, very adverse interest-growth differentials. In 2020, the increase is also attributable to a significant deficit-debt adjustment due to policy measures related to the pandemic, such as liquidity support to firms and households. In 2022 and 2023, declining but still significant primary deficits will be more than offset by favourable contributions from improving interest-growth differentials, as economic activity is projected to recover, and also by a negative deficit-debt adjustment in 2022 (see Chart 26). As a result, the debt-to-GDP ratio is expected to stand at 97.8% at the end of the projection horizon in 2023.
Chart 26
Drivers of change in public debt
(percentage points of GDP)
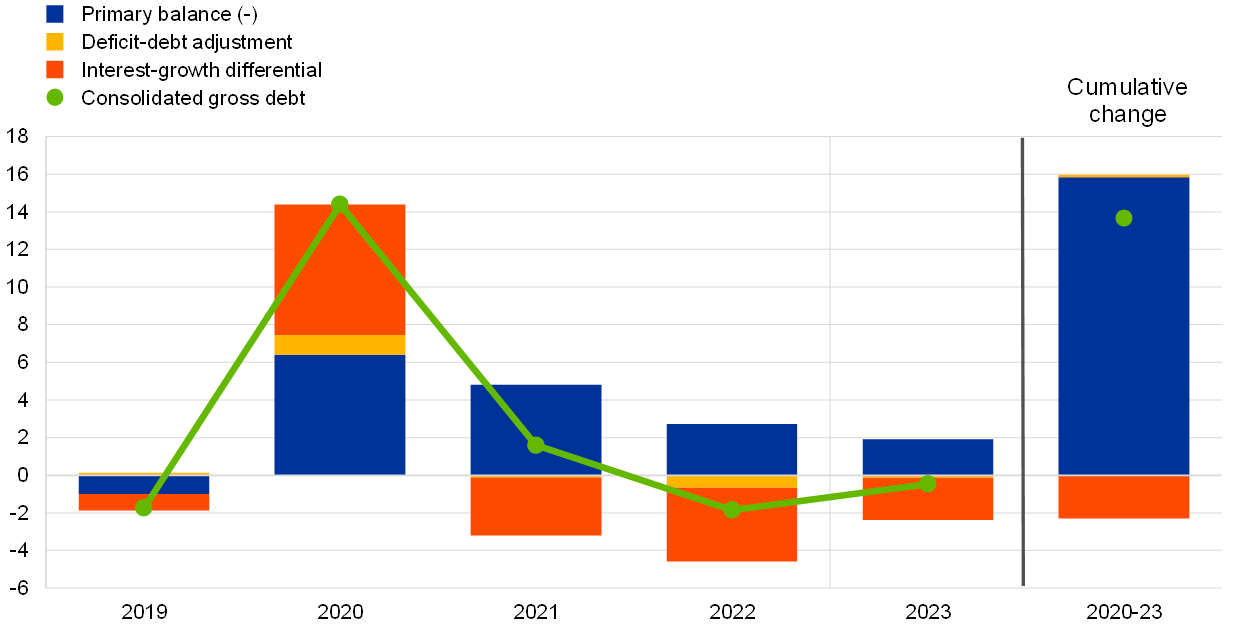
Sources: ECB and December 2020 Eurosystem staff macroeconomic projections.
Note: The data refer to the aggregate general government sector of the euro area.
It will take significant time to restore balance sheets to pre-crisis levels. The reduction of budgetary imbalances rests, inter alia, on the pace of the recovery in 2021, especially after positive news about several COVID-19 vaccines. Moreover, the coordinated fiscal action taken in the European Union should provide an impetus to economic growth. At the same time, favourable financing conditions continue to contain debt servicing costs. Going forward, it is still important that EU Member States return to sound fiscal positions, including lower levels of government debt, once economic activity has recovered[12].
Boxes
1 The scarring effects of past crises on the global economy
The coronavirus (COVID-19) pandemic is an unparalleled shock to the global economy. First, the shock is multilayered, with the public health emergency compounded by an induced supply shock (i.e. following the adoption of stringent lockdown measures) and a demand shock as a consequence of increased unemployment and heightened uncertainty. Second, it has triggered a multifaceted and sizeable policy response, which has alleviated the adverse effects on economic activity but could exacerbate existing imbalances in the global economy and raise concerns about public and private debt overhangs and future deleveraging needs. Finally, certain sectors have been hit particularly hard by the lockdown measures and behavioural changes on the part of consumers, which are likely to remain in place at least until an effective medical solution has been implemented.
More2 Liquidity conditions and monetary policy operations in the period from 22 July to 3 November 2020
This box describes the ECB’s monetary policy operations and liquidity developments during the fifth and sixth reserve maintenance periods of 2020, which ran from 22 July to 15 September and from 16 September to 3 November 2020, respectively. During this period, there was a stabilisation of the market volatility associated with the coronavirus (COVID-19) crisis earlier in the year. Measures announced by central banks continued to underpin market functioning over the summer.
More3 Assessing short-term economic developments in times of COVID-19
The sudden and deep recession triggered by the outbreak of the coronavirus (COVID-19) has warranted adjusting the standard tools used for forecasting euro area real GDP growth in real time. The severe economic consequences of COVID-19 have played havoc with established statistical and economic relationships.[13] Hence, standard short-term forecasting models have been able to capture neither the extent of the contraction observed in the first two quarters of 2020 – with quarter-on-quarter declines of 3.7% and 11.7% in the first and the second quarters, respectively – nor the rebound in the third quarter – with an increase of 12.5%. These exceptional dynamics have required an update of the set of tools typically used to forecast euro area real GDP growth in real time. This box describes four approaches developed by ECB staff to account for the specific characteristics and implications of the COVID-19 pandemic.
More4 Understanding the impact of the COVID-19 pandemic through an import-adjusted breakdown of euro area aggregate demand
This box presents an alternative method for breaking down GDP, accounting for the fact that each demand component contains goods and services which are imported. The standard breakdown of GDP into domestic expenditure components and net exports enables an assessment to be made of the domestic versus foreign drivers of growth. Such a breakdown traditionally subtracts the contribution of total imports as a stand-alone aggregate from total exports to compute net exports. In reality, however, imports contribute to all individual components of GDP, i.e. also to changes in inventories and to domestic demand, and more so to investment than to private and government consumption. This standard national accounting practice therefore has a limitation in that it magnifies the purely domestic demand contribution to GDP growth while shrinking the influence of foreign factors on domestic economic activity.
More5 Developments in the tourism sector during the COVID-19 pandemic
A salient feature of the coronavirus (COVID-19) pandemic has been the sharp and deep decline in mobility, which has caused a slump in tourism, trade in travel services and consumption by non-residents. Lockdowns and social distancing measures led to strong declines in otherwise stable services consumption. This box takes stock of developments in the tourism sector, discusses how the impact of these developments on consumption has varied across countries and reviews the near-term prospects for a recovery in tourism and travel.
More6 The long-term effects of the pandemic: insights from a survey of leading companies
This box summarises the findings of an ad hoc ECB survey of leading euro area companies that looks at the long-term effects of the coronavirus (COVID-19) pandemic on the economy. While precipitating the largest short-term decline in economic activity for centuries, the COVID-19 pandemic has also brought about changes in the way businesses operate and consumers behave, some of which are likely to outlive the present crisis. These may in turn influence aggregates such as output, employment and prices – and the relationship between them – in the long term.[14]
More7 Assessing wage dynamics during the COVID-19 pandemic: can data on negotiated wages help?
The confluence of the economic consequences of and policy responses to the coronavirus (COVID-19) pandemic poses challenges for interpreting labour market developments – including wage developments. For instance, the substantial changes observed in recent quarters in hours worked per person employed, together with the widespread application of short-time work schemes and issues related to their statistical recording, complicate the interpretation of wage indicators such as “compensation per hour” or “compensation per employee”.[15] The ECB indicator of negotiated wage rates captures the outcome of collective bargaining processes and is not directly affected by these special factors.[16] It also tends to be published around one month earlier than wage indicators based on quarterly national accounts. It should be noted, however, that the pandemic may also have had an impact on the indicator properties of negotiated wages, as it has led to fewer wage agreements being concluded than under normal circumstances. This box considers what role the indicator of negotiated wage rates can play in assessing and forecasting wage developments at the current juncture.
More8 Draft budgetary plans for 2021: a review in times of the COVID-19 crisis
On 18 November 2020 the European Commission released its opinions on the draft budgetary plans of euro area governments for 2021. In contrast to previous years and in the context of the coronavirus (COVID-19) pandemic, this year’s European Commission assessment was of a qualitative nature and did not focus on numerical compliance with the fiscal rules. This was due to the activation of the general escape clause[17] which allows Member States to deviate from the adjustment requirements of the Stability and Growth Pact in certain specific, defined situations, such as a severe economic downturn for the euro area or the Union as a whole. Instead the Commission’s assessment was based on the fiscal country-specific recommendations adopted by the Council on 20 July 2020 as well as its guidance issued in September in the form of letters sent to all Member States indicating that the general escape clause would remain active also in 2021 to ensure the needed support from fiscal policies. The Commission also clarified in its assessment that when economic conditions allow, Member States should pursue fiscal policies aimed at achieving prudent medium-term fiscal positions and ensuring debt sustainability, while enhancing investment. In order to reconcile the need to provide macroeconomic stabilisation while ensuring medium-term fiscal sustainability, the Commission stated that support measures should be targeted and temporary, as permanent measures which are not financed by compensatory measures may affect fiscal sustainability in the medium term.
MoreArticles
1 The European exchange rate mechanism (ERM II) as a preparatory phase on the path towards euro adoption – the cases of Bulgaria and Croatia
Following the completion of a roadmap agreed over the past few years among all relevant EU stakeholders, the Bulgarian lev and the Croatian kuna were included in the European exchange rate mechanism (ERM II) on 10 July 2020. Their inclusion marks a milestone towards future enlargement of the euro area, given the important role that ERM II plays as a preparatory phase for euro adoption. Participation in ERM II may lead to a regime shift in the country concerned, i.e. it may alter the incentives of international and local investors and of the national authorities.
More2 The impact of the COVID-19 pandemic on the euro area labour market
The euro area labour market has been severely hit by the coronavirus (COVID-19) pandemic and associated containment measures. Employment and total hours worked declined at the sharpest rates on record. Unemployment increased more slowly and to a lesser extent, reflecting the high take-up rate of job retention schemes and transitions into inactivity. The labour market adjustment occurred primarily via a strong decline in average hours worked. In addition, the labour force declined by about 5 million in the first half of 2020, which is half a million more than its increase between mid-2013 and the fourth quarter of 2019.
More3 The digital economy and the euro area
Digitalisation – the diffusion of digital technologies leading to a digital economy – is “virtually everywhere”. It transforms patterns of consumption and production, business models, preferences and relative prices, and thereby entire economies, making it an important issue from a central banking perspective. Some of the key effects of digitalisation relevant to monetary policy relate to output and productivity, labour markets, wages and prices.
MoreStatistics
Statistical annex© European Central Bank, 2021
Postal address 60640 Frankfurt am Main, Germany
Telephone +49 69 1344 0
Website www.ecb.europa.eu
All rights reserved. Reproduction for educational and non-commercial purposes is permitted provided that the source is acknowledged.
This Bulletin was produced under the responsibility of the Executive Board of the ECB. Translations are prepared and published by the national central banks.
The cut-off date for the statistics included in this issue was 9 December 2020.
For specific terminology please refer to the ECB glossary (available in English only).
ISSN 2363-3417 (html)
ISSN 2363-3417 (pdf)
QB-BP-20-008-EN-Q (html)
QB-BP-20-008-EN-N (pdf)
- OPEC+ is a coalition of oil producers led by the Organization of Petroleum Exporting Countries (OPEC) and Russia.
- For further details, see the box entitled “Alternative scenarios for the euro area economic outlook” in the Eurosystem staff macroeconomic projections for the euro area, December 2020.
- The methodology for calculating the EONIA changed on 2 October 2019; it is now the €STR plus a fixed spread of 8.5 basis points. See the box entitled “Goodbye EONIA, welcome €STR!”, Economic Bulletin, Issue 7, ECB, 2019.
- Within the review period, the first five issuances under SURE by the European Commission took place, ranging from five to 30 years of maturity and amounting to €39.5 billion. The issuances met historically large demand with more than ten times oversubscription in the order book.
- See the article entitled “The impact of the COVID-19 pandemic on the euro area labour market” in this issue of the Economic Bulletin.
- For further information on this and other measures of underlying inflation, see Boxes 2 and 3 in the article entitled “Measures of underlying inflation for the euro area”, Economic Bulletin, Issue 4, ECB, 2018.
- For more information, see the box entitled “Short-time work schemes and their effects on wages and disposable income”, Economic Bulletin, Issue 4, ECB, 2020.
- For more information, see the box entitled “Assessing wage dynamics during the COVID-19 pandemic: can data on negotiated wages help?” in this issue of the Economic Bulletin.
- See the “Eurosystem staff macroeconomic projections for the euro area, December 2020”, published on the ECB’s website on 10 December 2020.
- It should be noted that there is an unusually high degree of uncertainty surrounding the decomposition of cycle and trend at the current juncture.
- The fiscal stance reflects the direction and size of the stimulus from fiscal policies to the economy, beyond the automatic reaction of public finances to the business cycle. It is measured here as the change in the cyclically adjusted primary balance ratio net of government support to the financial sector. For more details on the concept of the euro area fiscal stance, see the article entitled “The euro area fiscal stance”, Economic Bulletin, Issue 4, ECB, 2016.
- For more details on draft budgetary plans for 2021 and the opinions of the European Commission, see the box entitled “Draft budgetary plans for 2021: a review in times of the COVID-19 crisis” in this issue of the Economic Bulletin.
- See also Lenza, M. and Primiceri, G.E., “How to estimate a VAR after March 2020”, Working Paper Series, No 2461, ECB, August 2020.
- For a recent study of the long-term effects of past pandemics and how these compare to wars, see Jordà, Ò., Singh, S.R. and Taylor, A.M., “The Longer-Run Economic Consequences of Pandemics”, Federal Reserve Bank of San Francisco, Working Paper Series, No 9, 2020.
- These issues have been discussed in past issues of the ECB’s Economic Bulletin. See the box entitled “Short-time work schemes and their effects on wages and disposable income”, Economic Bulletin, Issue 4, ECB, 2020 and the box entitled “Developments in compensation per hour and per employee since the start of the COVID-19 pandemic” in the article entitled “The impact of the COVID-19 pandemic on the euro area labour market” in this issue of the Economic Bulletin.
- The indicator of negotiated wage rates has been compiled by the ECB since 2001 based on non-harmonised country data as an indicator of possible wage pressures. For details, see the box entitled “Monitoring wage developments: an indicator of negotiated wages”, Monthly Bulletin, ECB, September 2002.
- The clause was introduced as part of the “Six-Pack” reform of the Stability and Growth Pact in 2011. The clause can be activated in the case of an unusual event outside the control of the Member State concerned, which has a major impact on the financial position of the general government or in periods of severe economic downturn for the euro area or the Union as a whole. When activated it allows Member States to temporarily depart from the fiscal adjustment requirements under both the preventive and corrective arms of the Pact provided this does not endanger fiscal sustainability in the medium term.