


Energy price developments in and out of the COVID-19 pandemic – from commodity prices to consumer prices
Energy price developments in and out of the COVID-19 pandemic – from commodity prices to consumer prices
Published as part of the ECB Economic Bulletin, Issue 4/2022.
1 Introduction
Record-high energy price increases at the end of 2021 and beginning of 2022 put significant pressures on the purchasing power of consumers.[1] These increases followed a marked decline in energy prices at the onset of the coronavirus (COVID-19) pandemic. While the initial rise in energy prices was mainly driven by the recovery in energy demand following the easing of lockdown measures after the first wave of the pandemic, the subsequent price rally during 2021 was also significantly affected by supply-side issues. This development was aggravated in early 2022 by the Russian invasion of Ukraine. The increase in European gas prices since the summer of 2021 has been particularly sharp, reflecting a combination of supply and demand factors that left European gas inventories at historically low levels ahead of the winter season and the gas market vulnerable to supply and demand uncertainty, including from escalating geopolitical tensions. As a result, consumer gas and electricity prices – both driven by natural gas prices – played an increasingly important role in developments in HICP energy and were accompanied by unprecedented cross-country heterogeneity in energy price developments.
2 Energy market developments
Energy commodity prices dropped considerably at the onset of the pandemic, followed by a recovery period and a subsequent surge, particularly in gas prices. The immediate decline in the oil price was particularly pronounced. For instance, the Brent crude oil price dropped by 75% between February and April 2020, while the Dutch TTF gas price[2] fell by 44%. Since then, oil and gas prices have increased sharply, with gas prices already reaching pre-pandemic levels in September 2020 and oil prices doing so around February 2021. This is in contrast to the last episode of rapidly increasing energy commodity prices during the recovery from the 2008 financial crisis, when oil and gas prices stabilised at below pre-crisis levels. The rise in gas prices was particularly strong in the second half of 2021 and intensified even further in the first half of 2022, with European gas prices increasing by 145% since July 2021, while oil prices have increased by 46% over the same period. Both oil and gas prices have risen to well above pre-pandemic levels, with the European gas price reaching an all-time high, contributing in turn to record-high wholesale electricity prices (Chart 1).
Chart 1
Pandemic-related drop in energy prices followed by substantial price increases
(left-hand scale: EUR per unit; right-hand scale: USD per unit, monthly average values)
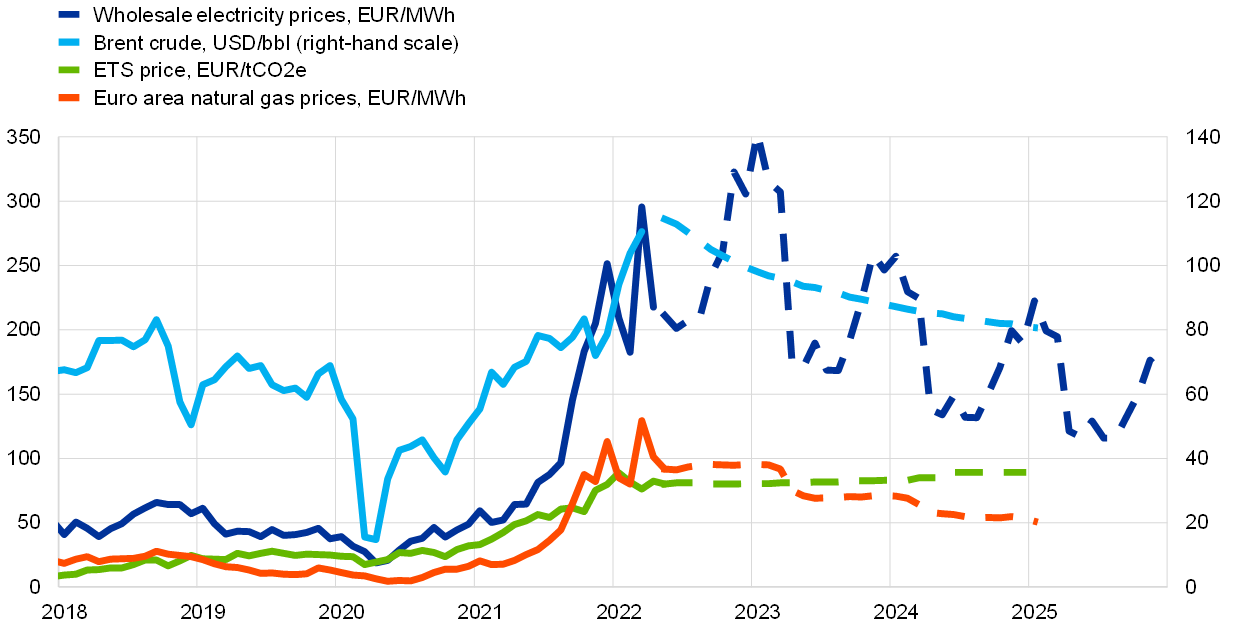
Sources: Eurostat, Refinitiv and ECB staff calculations.
Notes: Wholesale electricity prices for the euro area are calculated as a weighted average (weighted by net electricity generation) of prices observed in the five biggest euro area economies. Futures curves from 29 April 2022 are represented by broken lines. “ETS” is the EU Emissions Trading System, Latest observations: May 2022.
Drivers of oil and gas prices
The large drop in energy commodity prices in early 2020 mainly stemmed from the negative impact of the pandemic on the demand for energy. According to model estimates, most of the drop in oil and gas prices at the onset of the pandemic could be explained by changes in demand as economic activity slowed as a result of COVID-19-related restrictions (Chart 2).
Chart 2
Oil and gas prices dropped at the onset of the pandemic owing to lower demand, while subsequent price increases have been driven by a combination of factors
(daily cumulated percentage changes, since 1 January 2019)

Sources: Refinitiv, Bloomberg, International Energy Agency (IEA) and ECB staff calculations.
Notes: Daily oil model from Venditti, F. and Veronese, G., “Global financial markets and oil price shocks in real time”, Working Paper Series, No 2472, ECB, September 2020. Structural shocks are estimated using the spot price, the futures to spot spread, market expectations on oil price volatility and the stock price index. The risk component identifies shocks to risks to future oil demand, whereas the economic activity component identifies shocks to current demand from changes in economic activity. Monthly gas model: the decomposition is based on a three-variable Bayesian vector autoregression (BVAR) where shocks are identified with sign restrictions, including euro area gas quantity (defined as imports + domestic production - exports - change in inventories), euro area gas price and euro area industrial production. The gas-specific demand component identifies shocks to gas demand in Europe that are not driven by economic activity, e.g. changes in heating demand owing to changing weather conditions. The last two months for gas quantity and industrial production are nowcasted. Latest observations: 20 May 2022 (oil); April 2022 (gas).
The subsequent rise in global energy commodity prices was partly a reflection of a rebound in demand for energy. The gradual resumption of economic activity and travel was accompanied by an ongoing recovery in demand for oil. According to model estimates, a third of the oil price increase since the trough reached at the end of April 2020 can be explained by a recovery in oil demand. While global demand for gas has also been driven by the economic recovery, especially in China, demand for gas in Europe was also high, owing to a period of colder than usual weather at the end of 2020 and in the first half of 2021. Thereafter, low winds during the summer months led to the substitution of wind-generated energy with gas. The result was that stores of gas were not fully replenished over the summer of 2021 (Chart 3, panel a). As gas prices started to rally from the summer of 2021, this also caused spillovers to demand for other energy sources, including oil and coal, as substitutes for gas in electricity production and heating.[3]
Chart 3
Low gas storage levels in Europe and slow reaction of US oil supply to rising oil prices
a) Gas storage utilisation rate in the EU
(percentages of total capacity)

b) Oil price and US oil rig count
(left-hand scale: USD/bbl; right-hand scale: number)

Sources: Gas Infrastructure Europe and ECB staff calculations.
Note: Latest observations: gas storage utilisation rate in the EU: 21 May 2022; oil price: 20 May 2022; US oil rigs: 20 May 2022.
Supply-side issues have also had an upward impact on oil prices, in particular since the summer of 2021 (Chart 2). The OPEC+ group decided to reduce oil supply by 9.7 million barrels per day in reaction to the large drop in oil demand in March and April 2020. In July 2021 OPEC+ agreed to gradually restore production by adding 400,000 barrels per day to production each month. However, some OPEC+ members continually failed to reach their targets, which constrained global supply. Meanwhile, US shale oil production reacted more slowly to oil price increases than it has done in the past due to a combination of persistent effects from the pandemic on the US shale oil industry and funding constraints on US shale oil producers (Chart 3, panel b). According to model estimates, around 40% of the oil price increase since April 2020 can be explained by supply factors.
Supply constraints were also an important contributor to the European gas price rally. Supply from Norway was low in the first half of 2021 owing to maintenance work on pipelines, and since the summer of 2021 supply of gas from Russia to the EU has dropped significantly, contributing to the slow replenishment of gas inventories in Europe ahead of the winter season. Towards the end of 2021 European gas prices eased somewhat amid higher imports of liquified natural gas (LNG) as a result of the positive gas price spread between Europe and Asia, highlighting the fact that the European gas market has gradually become more dependent on the global supply of and demand for gas, whereas previously it closely followed the oil market. This development stemmed from the emergence of a global market for LNG and the change in the indexation of European gas contracts (Box 1).
The Russian invasion of Ukraine led to renewed volatility in energy commodity prices, accelerated by the low level of inventories. Oil and gas price volatility spiked as a result of the Russian invasion of Ukraine in February 2022 and the associated policy responses as uncertainty about energy supply mounted.[4] Volatility in oil and gas prices was amplified by the low levels of inventories, which made prices more sensitive to changes in the outlook for energy supply and demand.
Subdued investment in oil and gas production since 2014 is likely to have constrained the elasticity of supply to rising demand, thereby contributing to the rise in energy commodity prices (Chart 4). Years of low investment is constraining the response of supply to rising demand. Weaker investment may reflect, on one hand, the impact of low energy prices after the price drop in 2014, and, on the other hand, uncertainty about the future mix of energy demand following the green transition.
Chart 4
Declining investment in oil and gas since 2014
(USD billions, 2019 values)

Sources: IEA and ECB staff calculations.
Notes: Annual averages, inflation-adjusted to 2019 US dollars. * Figures for 2021 are estimated.
Box 1
Decoupling of gas and oil prices
Recent gas price developments have highlighted ongoing structural changes that have shaped the gas market in recent years – in particular the gradual decoupling of gas and oil prices. Before 2015, the majority of gas contracts in Europe were indexed to oil prices. Consequently, the oil price usually provided a reasonable guide to developments in energy prices. Since 2015 the majority of European gas contracts have been linked to spot and futures prices in the European trading hubs for gas (Chart A, panel a), with the Dutch TTF being the main reference hub. This change was to some extent a result of the rise in the global supply of LNG, which created a globalised market for gas, and the associated development and deepening of natural gas hubs and spot markets. While the automatic link between oil and gas prices has diminished, European gas and oil prices remain correlated, as these are driven by common shocks to global economic activity and are also substitutes to some extent. Nonetheless, the responsiveness of European gas prices to changes in oil prices has gradually decreased over the last decade (Chart A, panel b).
Chart A
European gas prices have become less closely linked to oil prices over time
(panel a: percentages; panel b: beta coefficient)

Sources: IEA, Bloomberg, Haver and ECB staff calculations.
Notes: Panel a shows the price indexation mechanisms in European gas contracts. Panel b shows five-year rolling regressions of weekly changes in the TTF gas spot price on weekly changes in the oil spot price in the period 2013-21 when controlling for oil demand shocks from a daily BVAR model for oil prices, the Citi economic surprise index for the EU and the VIX index (all include up to three-week lags).
The emergence of a global market for LNG also means that European gas prices are increasingly affected by external developments. This could be observed both in the upward pressure on prices from high Asian demand for LNG during the economic recovery and, towards the end of 2021, when rising LNG imports relieved market tightness in Europe somewhat as investors took advantage of higher prices in Europe relative to the Asian gas market.
Drivers of wholesale electricity prices in Europe
Wholesale electricity prices in the euro area mirrored developments in gas and oil prices, with declines in the first half of 2020 and a surge throughout 2021. After low electricity prices of around €35/MWh on average[5] in 2020, electricity prices followed the rise in natural gas prices (Chart 1). Monthly average euro area wholesale electricity prices peaked at around €250/MWh in December 2021, a rise of more than 400% compared to December 2020 prices. On the back of the Russian invasion of Ukraine these climbed further to a monthly average of close to €300/MWh in March 2022, with the daily average price peaking above €500/MWh at the beginning of March 2022, but subsequently declined in April 2022 to an average of around €215/MWh.[6]
Under the marginal pricing method underlying wholesale electricity prices in Europe, the most expensive technology needed to meet demand within a given time period sets the price. This is known as the “pay-as-clear” market, in which each electricity provider bids their cost of electricity, which depends on the energy sources they use to generate the electricity. The final price of electricity within the market is then determined by the most expensive technology needed to fully meet electricity demand (Chart 5, panel a). In recent years, wholesale electricity prices in the EU have largely been driven by gas prices. However, there are differences in the gas dependency of European electricity markets, with electricity prices in Spain, Ireland, Italy and Portugal being particularly dependent on gas prices.[7]
Chart 5
Electricity pricing in Europe is based on marginal cost, often driven by gas prices
a) Marginal pricing of electricity
(GW and EUR/MWh)

b) Maximum contribution of gas and ETS price increases to electricity price increases
(EUR/MWh)

Sources: ACER, Refinitiv and ECB calculations
Notes: Panel a shows how the clearing price of electricity rises as demand rises, depending on the type of generation required to meet demand. Panel b shows the contribution of gas and ETS price increases to increases in the price of gas-fired electricity generation. This estimate is based on the assumption that the price of electricity produced from gas can be mechanically calculated from the price of gas (assuming a thermal efficiency of 50%, i.e. 2 MWh of gas is needed to produce 1 MWh of electricity) and the price of carbon emissions under the EU ETS (assuming an emission intensity of 0.4 tCO2e/MWh). The price of gas-fired electricity differs from wholesale electricity prices as the latter are not always determined by gas.
During the first wave of the pandemic, electricity demand could often be met from renewables alone, which pushed down electricity prices. Once installed, renewable energy sources have low marginal costs and therefore contribute to electricity supply whenever they are available.[8] When renewable supply is high – which depends on weather conditions – and demand for electricity is particularly low, existing renewable capacity is at times already sufficient to cover demand. This was often the case during the early months of the pandemic, which were characterised by lockdowns. Overall, favourable weather conditions and low electricity demand led to a high share of electricity generation from renewables, which, together with low gas prices, led to low electricity prices in 2020 (Chart 1).[9]
In the first months of 2021, rising gas and – to a lesser extent – carbon prices both contributed to rising wholesale electricity prices. Once electricity demand picked up, more gas-fired electricity was needed to meet peak demand. As carbon dioxide (CO2) is emitted during the production of gas-fired electricity, wholesale electricity prices were affected not only by the price of natural gas but also by the price of carbon emissions under the EU ETS. In the first phase of the recovery, both the price of gas and the price of carbon started to increase (Chart 1). On average, we estimate contributions from year-on-year increases in monthly average ETS prices to increases in the price of gas-fired electricity of between around 16% and 35% in the first six months of 2021 (Chart 5, panel b).
In the second half of 2021, the increase in gas prices was the dominant factor behind the electricity price increases and undermined the fuel-switching incentive of carbon pricing. While carbon prices under the EU ETS continued to increase moderately, strong year-on-year increases in the price of gas in the last six months of 2021 and the first months of 2022 clearly dominated annual changes in wholesale electricity prices. It is estimated that the monthly average contribution of gas price increases to the increase in the price of gas-fired electricity was at least 85% from July 2021 to April 2022 (Chart 5, panel b). The considerable increase in gas prices also led to a situation in which coal-fired electricity – despite having a much higher emissions intensity and higher related emissions costs – increasingly replaced gas-fired electricity during 2021. This stands in stark contrast with the usual situation in which rising carbon prices under the EU ETS would normally incentivise a switch from coal-fired electricity production to cleaner sources of electricity.
3 Consumer energy price developments in the euro area
HICP energy price developments in and out of the pandemic
The main components of consumer energy prices are liquid fuels, electricity and gas, with smaller contributions from heat energy and solid fuels (Chart 6). Overall, the weight of HICP energy in the euro area HICP was 9.8% in 2020, 9.5% in 2021 and 10.9% in 2022. Liquid fuels contribute 46% to overall energy consumption in the euro area, while electricity and gas contribute 28% and 20% respectively, based on 2022 weights. The euro area aggregate masks some differences at the country level (Chart 6 and Box 2).
Chart 6
The relevance of different energy components varies among euro area countries
Weights of HICP energy components in overall HICP energy
(percentages, 2022)

Sources: Eurostat and ECB staff calculations.
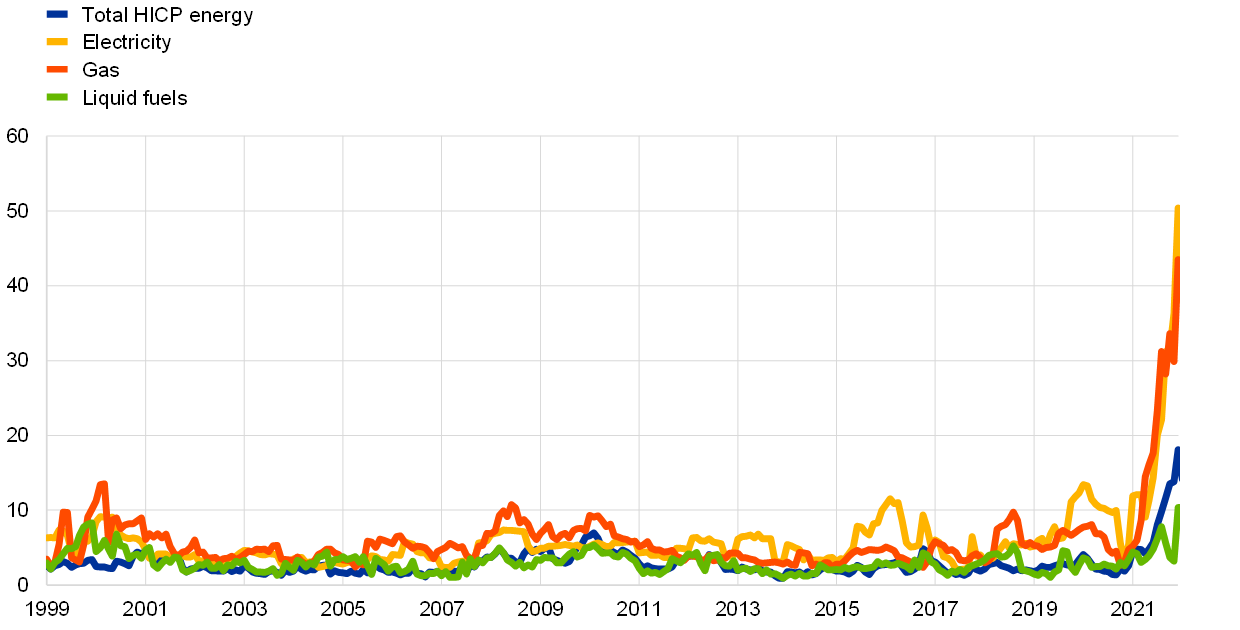
HICP energy inflation contributed negatively to headline inflation during most of 2020. Historically, energy inflation has contributed on average 0.3 percentage points to headline HICP inflation in the euro area. At the onset of the pandemic, when oil prices fell sharply, the annual rate of change of HICP energy declined markedly, reaching a trough in May 2020 at -11.9%, levels last observed in 2009 (Chart 7). In this initial phase of the pandemic, energy prices were mainly driven by developments in the fuel component, which is linked to oil prices. Later, from the summer of 2020, the temporary cut in the German VAT rate also dampened energy price dynamics.
Chart 7
After turning negative for most of 2020, euro area energy inflation surged at an unprecedented rate in 2021 and 2022
(percentages and percentage point contributions)

Sources: Eurostat and ECB staff calculations.
Note: Latest observations: April 2022.
Energy price developments caused a pronounced pick-up in euro area headline HICP inflation in the course of 2021 and at the beginning of 2022. Since February 2021 energy inflation has been pushed up by base effects as oil prices recovered. Cumulatively, base effects contributed about 10 percentage points to HICP energy inflation between December 2020 and December 2021.[10] In addition, since mid-2021 the unprecedented increases in wholesale gas and electricity prices lifted HICP energy inflation to new record highs at the end of 2021 and in early 2022. The Russian invasion of Ukraine further added to pressures on consumer energy prices. The spike in energy inflation points to a massive energy shock even from a historical perspective (Chart 8). While liquid fuel price developments are usually the main driver of HICP energy price pressures, consumer gas and electricity prices have played an increasingly important role, with gas and electricity prices contributing about half of energy price inflation in the last few months (Chart 7).
Chart 8
The current spike in energy inflation is large even from a historical perspective
Difference between euro area HICP energy and HICP excluding energy
(percentage points)

Sources: Eurostat and ECB calculations.
Latest observation: April 2022.
Developments in consumer energy prices differ substantially across euro area countries. For fuel prices, annual percentage changes varied between 19.5% and 46% in the largest euro area countries in April 2022, while there was far greater and unprecedented heterogeneity in price developments for gas (23% to 140.8%) and electricity (7% to 156%) (Chart 9). Overall, this means cross-country energy price developments are less aligned now than when they are mostly dominated by common oil price developments (Box 2).
Chart 9
Cross-country dispersion of annual rates of change in HICP energy and its components reached a historical high in April 2022
(weighted standard deviation, percentage points)
Sources: Eurostat and ECB calculations.
Notes: The weighted standard deviation expresses the standard deviation of the sum of HICP country-weighted deviations between euro area country annual rates of change in HICP gas, electricity, liquid fuels and total energy and euro area averages using HICP country weights. Latest observations: April 2022.
The impact of energy commodity prices on consumer energy inflation
The components of HICP energy can be broken down into a wholesale energy component, network costs and charges, and a tax component (Chart 10, and Boxes 2 and 3). On average in the euro area, the contribution of the wholesale component (including energy supply) to consumer gas and electricity prices was 42% and 37% respectively in 2021. This varies with the level of commodity prices and between euro area countries. For example, in the Netherlands in 2021 taxes reduced the total price of electricity by 21% owing to a tax credit on electricity consumption. Besides the cost of crude oil, consumer prices of liquid fuels are also influenced by refining margins and costs, distribution and retail margins and costs, and value added tax (VAT) and excise duties (Box 3).
Chart 10
Wholesale energy and supply made up about 42% of euro area consumer gas prices and about 37% of euro area consumer electricity prices in 2021
(percentages, 2021)
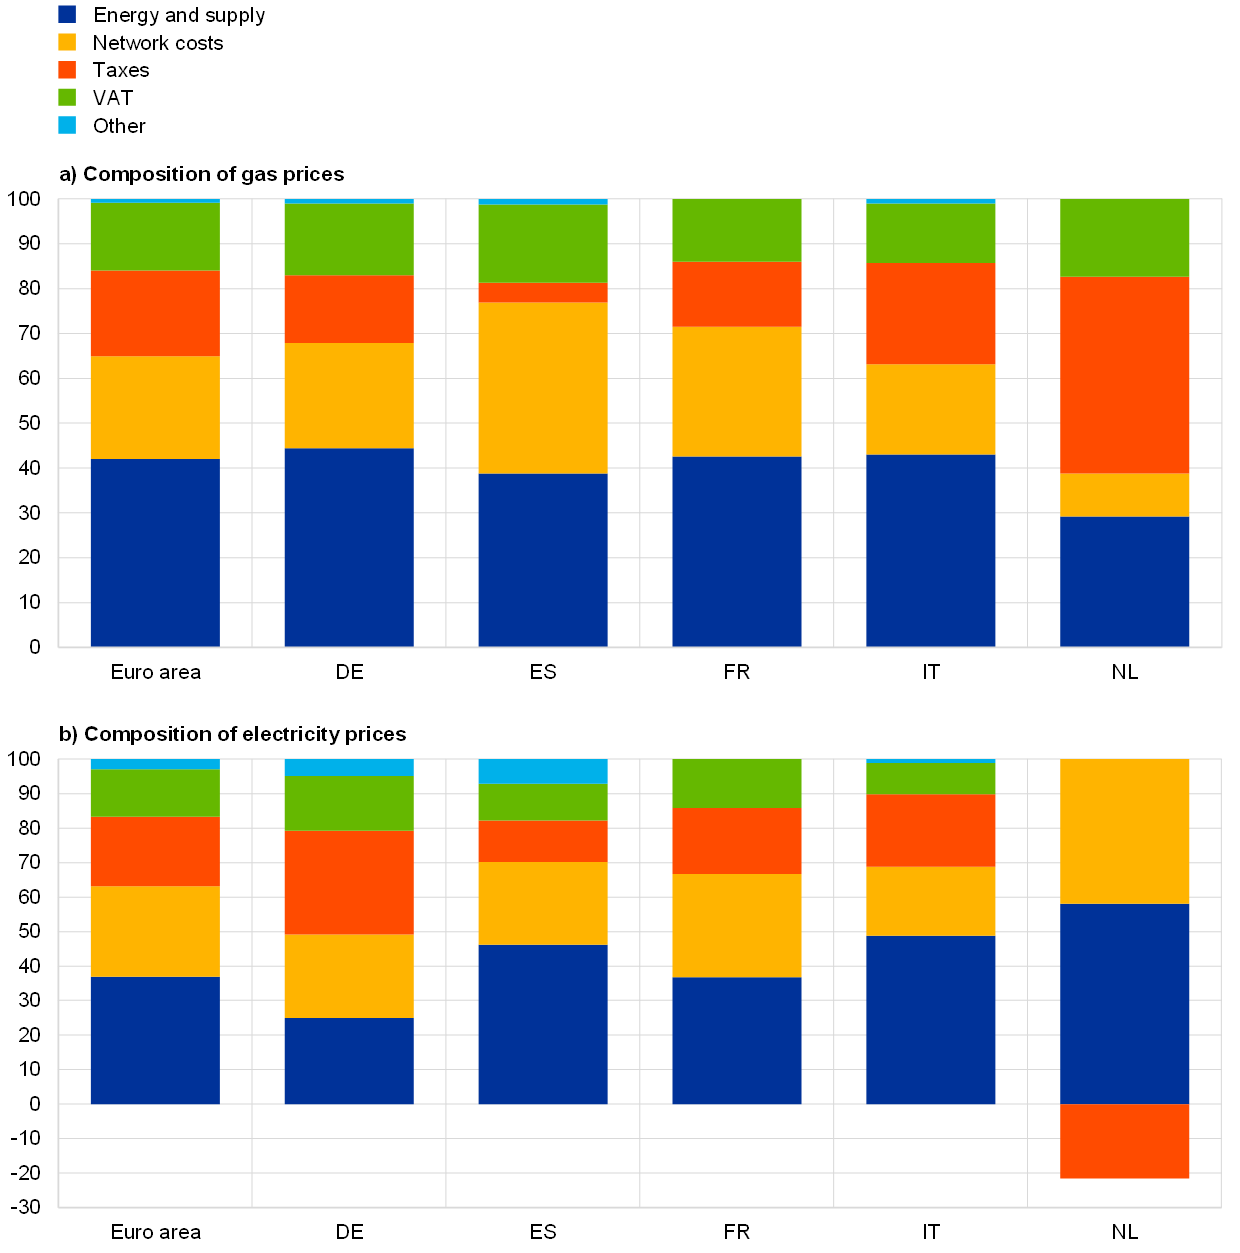
Sources: Eurostat and ECB calculations.
Notes: “Energy and supply” includes the wholesale component and the charges for the supply of energy to consumers. “Taxes” includes taxes, fees, levies and charges, renewable taxes, capacity taxes and environmental taxes, but does not include VAT. The compositions of gas and electricity prices are displayed for consumption classes representing median annual consumption (gas: band DC, 20 to 199 GJ; electricity: band DC, 2,500 to 4,999 kWh).
The pass-through of crude and refined oil prices to consumer prices is generally complete and quick, usually within 3-5 weeks. However, the impact of commodity price changes on consumer energy price changes is less than one to one, owing to the price composition. To quantify the impact, the relation between commodity prices and the respective HICP component is modelled using internal ECB models. Two approaches are taken: (i) a set of bi-variate BVARs for fuel, gas and electricity prices, and (ii) a set of error correction models for refined and retail fuel prices and a model for gas with seasonality and an error correction term.[11] Estimates suggest that about 31-34% of the change in crude oil prices is passed on to liquid fuel prices after one year. It should be noted, however, that elasticities can be a function of the crude oil price level, owing to the relatively constant refining and distribution costs and margins, and hence increase with the level of the oil price. Therefore, when commodity prices are rising, the share of the wholesale component increases relative to taxes and charges. As a result, the impact on consumer energy prices is larger.[12]
The reaction of consumer gas and electricity prices to changes in wholesale prices for gas and electricity is slower than the pass-through of crude oil prices to liquid fuel prices. The estimated pass-through of wholesale gas prices to consumer gas prices takes about three to six months. For electricity prices, the pace depends very much on country characteristics. Price composition and setting play an important role in explaining why the immediate impact on consumer gas and electricity prices of changes in the corresponding wholesale prices is often limited and lagged (Chart 10 and Box 2). Based on the estimates from the models described above, on average about 10-12% of the increase in natural gas prices is passed on to consumer gas prices in the euro area after one year, while for electricity the elasticity is lower, at around 4%. These estimates are subject to the important caveat that they are largely based on past data characterised by low levels and volatility of wholesale prices. The pass-through in an environment of high and volatile wholesale prices may deviate from the figures indicated here.
Box 2
Drivers of cross-country heterogeneity in the pass-through of commodity prices to consumer prices
The growing importance of the gas and electricity components of HICP during the pandemic led to greater cross-country heterogeneity in energy price developments (Chart A). Cross-country heterogeneity in consumer gas and electricity price developments are linked to differences in the pass-through of wholesale prices, depending on the price composition, the price-setting mechanism, and the energy mix used to produce electricity. The cross-country heterogeneity in consumer gas and electricity price developments is more pronounced than the heterogeneity in liquid fuel price developments, which is linked to a faster and more uniform pass-through of oil prices (Box 3).
Chart A
Annual price changes of HICP energy and its components were heterogeneous during the second half of 2021 and beginning of 2022
(percentage point contributions)

Sources: Eurostat and ECB staff calculations.
Notes: Malta had zero annual percentage change in prices in Q4 2021 and Q1 2022. Latest observation: Q1 2022.
The price composition determines the extent to which consumer prices are affected by wholesale price changes, and price setting determines the speed and timing of the pass-through. The impact of wholesale price changes on consumer prices depends on whether tariffs are flexible and adjust rapidly or are set to change at pre-determined intervals, including through regulated prices.[13] In recent months consumer prices have also been affected by government measures to cushion the impact of rising energy prices on consumers. For example, some governments have reduced taxes and charges to offset increases in wholesale prices. Other measures implemented take the form of transfers (e.g. for low income households) and therefore do not have a direct impact on prices.
There is strong heterogeneity in the energy mix for electricity production across euro area countries. On average in the euro area around 36% of electricity was produced from renewable sources (including biofuels) in 2021, 36% from fossil fuels (including gas and coal) and 27% from nuclear power, but these averages conceal large differences across countries (Chart B). For example, in France the largest share of electricity is produced from nuclear power (68% in 2021). In Germany, the contribution of coal to total electricity production amounted to around 29% in 2021. Renewables contributed 22% in France, 33% in the Netherlands, 36% in Italy, 39% in Germany and 48% in Spain in 2021.
Chart B
The energy mix used to produce electricity varies between euro area countries
Energy sources contributing to net electricity production
(percentages, 2021)

Sources: Eurostat, IEA and ECB staff calculations.
Notes: The chart shows total net electricity production in 2021, i.e. “the total amount of electrical energy produced by transforming other forms of energy, for example nuclear or wind power” (gross electricity production) minus “the consumption of power stations' auxiliary services” (Eurostat). “Renewable” includes wind, solar, hydro, geothermal energy and biofuels. Values for Italy are for 2019 from the IEA, as a detailed breakdown for combustible fuels is not available from Eurostat.
The energy mix also has an impact on developments in electricity prices. The countries with the highest wholesale electricity prices in 2021 were those in which electricity demand was more frequently covered by gas-fired electricity generation.[14] Conversely, a high share of renewables or nuclear energy can shield countries from higher electricity prices to some extent, but only persistently so if electricity produced using these technologies can cover baseload demand consistently.
Overall, the unusually high cross-country heterogeneity in energy price developments could continue to play a larger role going forward. As the energy transition is aimed at replacing fossil energy sources with renewable energy, starting with the dirtiest fuels (like coal), the roles of gas – particularly during the transition – and, especially, electricity are likely to increase in the near and medium term. Therefore, the drivers of cross-country heterogeneity in the pass-through of wholesale prices to consumer electricity and gas prices are also expected to remain of relevance going forward. Heterogeneity in consumer energy prices could be reduced to some extent through further energy market integration and through more coordinated responses to higher energy prices, including as a consequence of the Russian invasion of Ukraine.[15]
Box 3
Developments in consumer liquid fuel prices
Liquid fuels, particularly for automotive transport, are the largest portion of the HICP energy component and the component that fluctuates the most. Liquid fuels account for 4.2% of the overall HICP, of which fuel for transport is the largest element (3.6%, compared with 0.6% for home heating). Although they make up less than 5% of the overall HICP, liquid fuels account for a substantial portion of the volatility of overall inflation – the standard deviation of year-on-year changes in the HICP excluding liquid fuels is 30% lower than that of the overall HICP.
There are three main components in consumer liquid fuel prices: (i) crude oil prices, (ii) refining and distribution costs and margins, and (iii) taxes (excise duties and VAT), but the main driver of consumer liquid fuel prices over the pandemic period has been the evolution of crude oil prices (Chart A).[16] Generally, the pass-through from crude and refined oil prices to consumer prices is complete and quite quick.[17] Owing to their nature, the two main tax components (excise duties and VAT) have evolved differently. Excise duties are levied as a nominal amount per litre and had not changed much over the past two years – at, on average, around 66 euro cent per litre for petrol, 51 euro cent per litre for diesel and 14 euro cent per litre for gasoil (used for home heating). However, a number of countries have recently reduced excise rates on transport fuels and average euro area excise duties have fallen to around 58 euro cent per litre for petrol and to 45 euro cent per litre for diesel. VAT, however, is levied as a percentage of the pre-tax consumer price and excise duties. Thus, movements in the pre-tax price result in movements in the nominal amount of VAT. Therefore, although VAT rates have not changed much over the past two years (at around 20-21% for petrol, diesel and gasoil), the nominal amount (i.e. in terms of euro cent per litre) accounted for by VAT has moved in line with oil prices (i.e. declining between January and April 2020 and increasing again thereafter).
Chart A
The most variable contribution to liquid fuel prices comes from crude oil prices
(euro cent per litre)

Sources: Refinitiv, European Commission (Weekly Oil Bulletin) and ECB staff calculations.
Notes: Refining and distribution costs and margins are calculated as the difference between crude oil prices and pre-tax consumer prices. Latest observations: May 2022 (average until 16 May).
Both the refining industry and the transport fuels retail distribution sector were significantly affected by the coronavirus pandemic. Between January and April 2020, retail fuel sales (in real or volume terms) declined by close to 50% (Chart B, panel a).[18] Sales then recovered significantly up to August 2020, although they remained below pre-pandemic levels. During 2021 there was a further recovery in retail sales, although they still remained below pre-pandemic levels, and an impact from the emergence of the Omicron variant of COVID-19 was visible between November 2021 and January 2022. The extraordinary oscillations in levels of travel also had ramifications for the refining industry.[19] Refining margins for both petrol and diesel/gasoil declined in the first half of 2020 and remained subdued until early to mid-2021. Subsequently (prior to the conflict in Ukraine) margins more or less returned to the levels that prevailed in the years prior to the pandemic.
There has been an increase in estimated distribution costs and margins for petrol, diesel and gasoil since the onset of the pandemic (Chart B, panel b). This may reflect a need to buffer revenues and service overall costs in response to lower refining costs and margins and reduced sales volumes. Although distribution costs and margins have tended to increase gradually over longer periods of time (based on data from the European Commission’s Weekly Oil Bulletin dating back to 1994), developments since 2020 have been above trend. A normalisation of travel once the pandemic is over may lead to some reduction in distribution margins. Further changes in excise duties or carbon taxes would have a direct impact on price levels, but would probably have less impact on their volatility over longer periods of time.
Chart B
As retail sales declined during the pandemic, distribution costs and margins were on the rise
a) Evolution of retail sales of fuel (in real/volume terms)
(index: 2015 = 100)

b) Distribution costs and margins
(euro cent per litre)
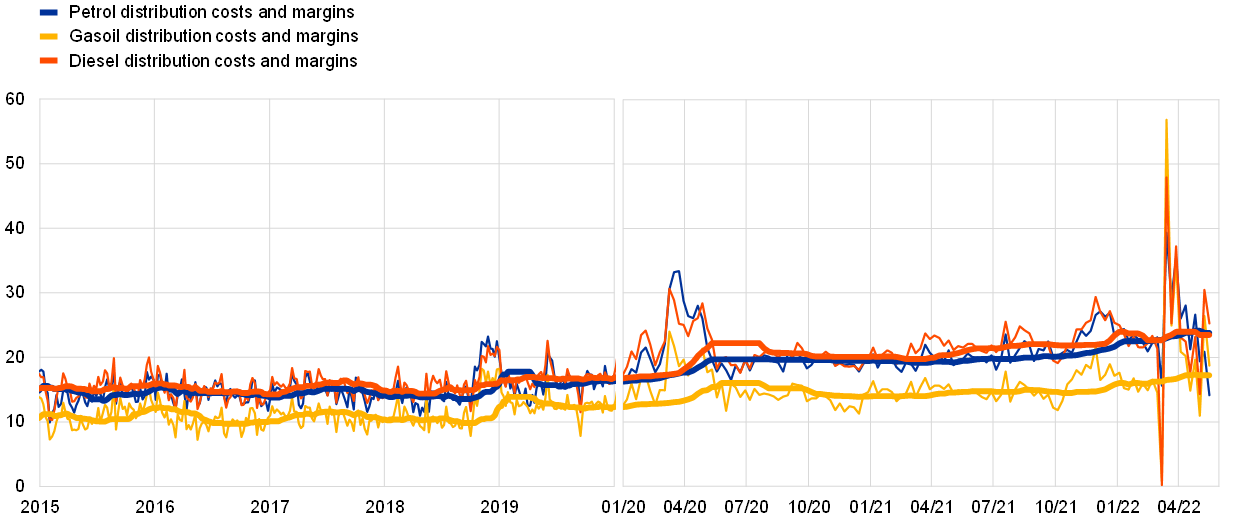
Sources: Eurostat and European Commission (Weekly Oil Bulletin).
Notes: In panel b, thicker solid lines denote 26-week moving averages of weekly data. Latest observations: panel a, March 2022; panel b, 16 May 2022.
Implications of energy price developments for energy inflation projections
Given the strong volatility, movements in energy prices in one year can have implications for year-on-year inflation rates in the subsequent year. Negative base effects will influence the profile of HICP energy in the course of 2022. The substantial increase in oil prices in 2021 will have a significant downward impact on monthly year-on-year inflation rates for energy in January, March, July, October and November 2022. Cumulatively, downward base effects will take more than 20 percentage points off energy inflation by December 2022 compared with December 2021 (Chart 11). Of course, inflation outcomes will also depend on developments in actual energy prices in 2022; so far the downward base effects in 2022 have been offset by marked month-on-month increases in energy prices.
Chart 11
Negative base effects will influence the profile of HICP energy in 2022
(percentage points)

Sources: Eurostat and ECB staff calculations.
Notes: Month-on-month base effects show the contribution of the base effect to the change in the annual energy inflation rate from one month to the next. The cumulative impact of base effects is calculated by summing month-on-month base effects and is always shown relative to a specific reference month. For example, around 10 percentage points of the decrease in energy inflation in July 2022 compared with the inflation rate in December 2021 is due to base effects.
HICP energy inflation projections for the euro area include information from oil and gas price futures. In Eurosystem/ECB staff macroeconomic projection exercises, the inflation projections are based on the assumption that oil and gas prices will evolve in line with average futures prices observed over a two-week period prior to the projection cut-off date.[20] Since December 2021, given the observed delinking of gas contracts from oil prices, the assumptions regarding oil price futures have been complemented with futures for gas and electricity prices (Box 1).[21] Currently, futures curves are pointing to a drop in oil and gas prices in the course of 2022 and 2023, implying that HICP energy inflation should decline in 2023.[22] However, recent energy price developments and the related volatility of futures curves are a reminder of the uncertainty regarding their predictive capacity, and hence regarding energy inflation projections (Chart 1).
4 Conclusion
Developments in consumer energy prices during the COVID-19 pandemic have reflected commodity price developments, with some differences across euro area countries. While the recovery in oil and gas prices during 2020 was driven mainly by the rebound in economic activity and energy demand after the first wave of the pandemic, the subsequent rally in energy commodity prices accelerated as supply-side constraints and risks to supply from geopolitical developments kicked in amid continuously strong demand. From very low levels in 2020, consumer energy price inflation has surged since mid-2021. Gas and electricity price developments have increasingly contributed to energy inflation, but with more cross-country heterogeneity than is the case with liquid fuels. As a result, energy price developments are less aligned across countries than they would be if they were dominated mostly by oil price developments. Moreover, in some countries, the impact of recent very high natural gas prices may only be reflected in consumer gas and electricity prices with a lag.
Geopolitical developments continue to imply high unpredictability in energy markets. This is reinforced by ongoing endeavours to make European energy markets independent of Russian energy supplies. In addition, the green transition may affect energy prices and contribute to periods of higher price volatility. If investment in oil and gas production is aligned with net zero emissions targets, but energy supply from renewables cannot consistently meet demand, the result could be recurring periods of high and volatile energy prices. Increases in EU carbon taxes could add to upward pressures on energy prices. However, an increasing decarbonisation of the energy system and increasing energy efficiency also imply reduced dependence of euro area consumer energy prices on global commodity prices and increased dependence on cheaper renewable energy, which in the long run could have a downward impact on consumer energy prices.
The assessment of energy price developments depends on the source of the shock, which can be challenging to identify.[23] The energy mix is evolving and this article points to a less prominent role for crude oil (a commodity not produced in the euro area) and an increasing role for gas and electricity, for which price developments are more closely linked to domestic supply and demand than is the case with oil. This implies that it can be more difficult to unambiguously ascribe energy price developments to external shocks. If the energy mix evolves differently across euro area countries, there may be more dispersion in energy price inflation across countries than in a world in which global oil price developments imply common shocks to all countries.
See the article entitled “Energy prices and private consumption: what are the channels?”, Economic Bulletin, Issue 3, ECB, 2022.
The Title Transfer Facility (TTF) is the Dutch trading hub for gas and the main reference hub for gas trading in Europe.
See Oil Market Report – October 2021, IEA, 14 October 2021.
See the box entitled “The impact of the war in Ukraine on euro area energy markets” in this issue of the Economic Bulletin.
Averages referred to in the text are calculated as the consumption-weighted mean across electricity markets of the five biggest euro area economies – Germany, France, Italy, Spain and the Netherlands.
See the box entitled “The impact of the war in Ukraine on euro area energy markets” in this issue of the Economic Bulletin.
See ACER’s Preliminary Assessment of Europe’s high energy prices and the current wholesale electricity market design, European Union Agency for the Cooperation of Energy Regulators (ACER), November 2021.
The largest share of costs of renewable energy relates to the cost of manufacturing and installing renewable energy generation capacity.
See Quarterly Report on European Electricity Markets, Vol. 13, Issue 2, second quarter of 2020, European Commission, 2020.
A base effect is the effect on the year-on-year rate of inflation when an unusually large month-on-month change from 12 months earlier drops out of the index. See the box entitled “Recent dynamics in energy inflation: the role of base effects and taxes”, Economic Bulletin, Issue 3, ECB, 2021.
The BVAR uses monthly data and month-on month rates of change. It is assumed that there is no contemporaneous feedback effect from the HICP energy component to the respective commodity price series.
The pass-through of crude oil prices at a level of €100/bbl (€50/bbl) is 47% (31%) to petrol, 54% (37%) to diesel and 76% (62%) to heating fuel, according to analyses published in “Energy markets and the euro area macroeconomy”, Occasional Paper Series, No 113, ECB, June 2010.
As of 2022 gas prices are “mainly administered” in Estonia, France, Italy, Latvia, Lithuania, the Netherlands and Slovakia and “fully administered” in Spain. Electricity prices are “mainly administered” in Estonia, Greece, France, Cyprus, Lithuania, the Netherlands, Slovakia and Finland and “fully administered” in Malta (Eurostat, HICP – administered prices (dataset), 2022).
See ACER’s Preliminary Assessment of Europe’s high energy prices and the current wholesale electricity market design, European Union Agency for the Cooperation of Energy Regulators (ACER), November 2021.
See the box entitled “The impact of the war in Ukraine on euro area energy markets” in this issue of the Economic Bulletin.
Refining and distribution costs and margins are estimated by calculating (i) the difference between the price of refined fuel and the price of crude oil (refining costs and margins), and (ii) the difference between the pre-tax consumer price and the price of refined fuel (distribution costs and margins). These are approximations, as crude oil and refined fuel prices can vary by specification and location.
The pass-through of the oil price to euro area consumer prices occurs quickly, with 90% occurring within three to five weeks. See Meyler, A., “The pass through of oil prices into euro area consumer liquid fuel prices in an environment of high and volatile oil prices”, Energy Economics, Vol. 31, No 6, November 2009, pp. 867-881.
The impact on aviation fuel sales was even more dramatic, with declines of over 90%.
In early 2020, given the dramatic decline in travel, there were concerns regarding the capacity to store the build-up of crude and refined oil inventories. See “Virtual fireside chat with Fatih Birol: COVID-19 and the future of the energy system”, Atlantic Council, 26 March 2020.
See the box entitled “The mechanical impact of changes in oil price assumptions on projections for euro area HICP energy inflation”, Economic Bulletin, Issue 1, ECB, 2019.
See the box entitled “Developments in energy commodity prices and their implications for HICP energy price projections”, Eurosystem staff macroeconomic projections for the euro area, ECB, December 2021.
The downward-sloping nature of the oil futures curve (“backwardation”) is often the result of a tightening oil market, as oil carries a “convenience yield” which captures the benefits of holding inventories, but it may also reflect market expectations of balancing demand and supply. When futures curves are downward sloping, their use as technical assumptions in the projections has a dampening impact on the inflation outlook. Therefore, the projections regularly include a sensitivity analysis to key technical assumptions. See, for example, the box entitled “Sensitivity analysis”, Eurosystem staff macroeconomic projections for the euro area, ECB, December 2021.
See also Schnabel, I., “A new age of energy inflation: climateflation, fossilflation and greenflation”, speech at a panel on “Monetary Policy and Climate Change” at The ECB and its Watchers XXII Conference, 17 March 2022.