
ECB staff macroeconomic projections for the euro area, September 2023
1 Overview
The short-term outlook for growth in the euro area has deteriorated, while over the medium term the economy should gradually return to moderate growth as both domestic and foreign demand recover. Euro area economic activity grew at a subdued paced in the first half of 2023, despite the elevated level of manufacturing order backlogs and the unwinding of high energy prices. Moreover, these effects have largely waned and short-term indicators point to stagnation in the near term in the face of tighter financing conditions, weak business and consumer confidence and low foreign demand in the context of a strengthening of the euro. Growth is expected to pick up from 2024 as foreign demand approaches its pre-pandemic trend and real incomes improve, underpinned by declining inflation, buoyant nominal wage growth and still low, though slightly increasing, unemployment. However, growth will continue to be dampened as the ECB’s monetary policy tightening and adverse credit supply conditions feed through to the real economy and as fiscal support is gradually withdrawn. Overall, annual average real GDP growth is expected to slow down from 3.4% in 2022 to 0.7% in 2023, before recovering to 1.0% in 2024 and to 1.5% in 2025. Compared with the June 2023 Eurosystem staff projections, the outlook for GDP growth has been revised down by 0.2 percentage points for 2023, 0.5 percentage points for 2024 and 0.1 percentage points for 2025, reflecting a significant downgrade of the short-term outlook, amid deteriorating survey indicators, tighter financing conditions – including more adverse credit supply effects – and the stronger euro exchange rate.[1]
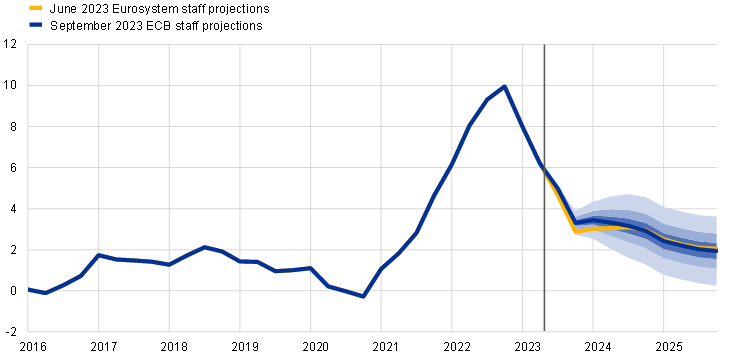
Headline inflation in the euro area is projected to continue to decline over the projection horizon owing to easing cost pressures and supply bottlenecks, as well as the impact of monetary policy tightening. HICP inflation excluding energy and food is also expected to gradually decline, however, it is projected to stand above headline inflation until early 2024. The projected disinflation is due to fading effects of the past energy price shocks and other pipeline price pressures, with strong growth in labour costs gradually becoming the dominant driver of HICP inflation excluding energy and food. Wage growth is expected to decline gradually from mid-2023, albeit remaining high over the projection horizon, driven by increases in minimum wages and inflation compensation, in a context of a tight, though cooling, labour market. Profit margins, which expanded notably last year, are expected to provide a buffer to the pass-through of labour costs to final prices in the medium term. In addition, the tighter monetary policy should increasingly dampen underlying inflation. Overall, with medium-term inflation expectations assumed to remain anchored at the ECB’s inflation target, headline HICP inflation is expected to decrease from an average of 8.4% in 2022 to 5.6% in 2023, 3.2% in 2024 and 2.1% in 2025, reaching the target in the third quarter of 2025. Compared with the June 2023 projections, HICP inflation has been revised up for 2023 and 2024, driven by higher energy futures prices, and down for 2025, as the impacts from the appreciation of the euro, tighter financing conditions and weaker cyclical conditions are seen to dampen HICP inflation excluding energy and food.
Table 1
Growth and inflation projections for the euro area
(annual percentage changes)
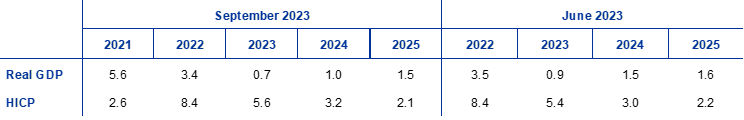
Notes: Real GDP figures refer to seasonally and working day-adjusted data. Historical data may differ from the latest Eurostat publications owing to data releases after the cut-off date for the projections. Data are available for downloading, also at quarterly frequency, from the Macroeconomic Projection Database on the ECB website.
Reflecting the high uncertainty surrounding the economic outlook this report contains a scenario assessing the implications of potential weaker economic developments and renewed financial stresses in China for the euro area economy (Box 3), as well as a range of sensitivity analyses related to alternative paths for energy and food commodity prices (Box 4).
2 Real economy
In the second quarter of 2023, euro area growth was subdued, with a positive contribution from domestic demand and inventory accumulation, and a negative contribution from net exports (Chart 1).[2] On the production side, industrial production weakened in the second quarter, despite the support from historically high order backlogs in the context of easing supply bottlenecks. Only services activity registered positive quarterly growth in terms of gross value added in the second quarter. On the demand side, given high inflation and tight financing conditions, private consumption stagnated, being weaker than foreseen in the June projections. Gross fixed capital formation made a positive contribution, driven mostly by business and government investment. Lower foreign demand and losses in competitiveness are estimated to have led to a negative contribution to growth from net exports, notwithstanding very weak imports.
Chart 1
(quarter-on-quarter percentage changes, seasonally and working day-adjusted quarterly data)

Notes: Historical data may differ from the latest Eurostat publications (see also footnote 2). The vertical line indicates the start of the current projection horizon. The ranges shown around the central projections provide a measure of the degree of uncertainty and are symmetric by construction. They are based on past projection errors, after adjustment for outliers. The bands, from darkest to lightest, depict the 30%, 60% and 90% probabilities that the outcome of real GDP growth will fall within the respective intervals. For more information, see Box 6 of the March 2023 ECB staff macroeconomic projections for the euro area.
GDP growth is projected to stagnate in the third quarter of 2023 and remain subdued in the fourth quarter as activity in the manufacturing sector remains weak and that in the services sector is expected to slow down. The boost to economic activity from the unwinding of order backlogs is expected to fade and the drag from tightening financing conditions and adverse credit supply conditions is seen to intensify. Indeed, survey indicators suggest a contraction in activity that now extends to the services sector, in contrast to the expectations of continued growth in the sector entailed in the June projections. As inflation is expected to decline and wages to rise in the context of a still tight labour market, real disposable income is set to recover. While this is expected to set the stage for a recovery in private consumption in the second half of 2023, consumer confidence declined in August, together with business sentiment regarding consumer goods production, implying more cautious consumer behaviour compared with the June projections. At the same time, the net trade contribution is expected to remain negative in the second half of 2023, as import growth picks up in line with domestic demand while export growth remains moderate, although both imports and exports are expected to be below the level in the June projections. Overall, euro area growth is expected to be broadly flat in the second half of 2023 and has been revised down by 0.6 percentage points compared with the June projections.
Over the medium term, euro area GDP growth is projected to moderately strengthen as household real incomes rise and foreign demand improves, albeit with headwinds from tighter financing conditions and declining fiscal support. Real GDP growth is set to strengthen through 2024 and to stabilise in 2025 (Table 2). In addition to the unwinding of energy shocks, growth is expected to be supported by abating inflationary pressures, in the context of resilient labour income growth, paving the way for a recovery in private consumption. Foreign demand, which has been particularly weak this year, should also regain strength. However, the impetus from these tailwinds is seen to be mitigated by the tighter financing conditions and by the appreciation of the euro. Moreover, while fiscal support measures are seen to be broadly neutral for growth in 2023, their removal is expected to reduce growth in 2024 and 2025.
Tighter financing conditions, mainly owing to the higher interest rates and partly also related to credit supply restrictions, are expected to continue to dampen demand. The sharp increase in interest rates since December 2021 is continuing to feed through to the real economy, affecting the growth outlook (as reflected in the technical assumptions for the projections – see Box 1), particularly for 2023 and 2024.[3] In addition, credit supply conditions, as reported in the ECB’s latest euro area bank lending survey, have tightened since the turn of the year and loan growth has decreased sharply. These factors, together with the significant deterioration in recent monthly activity indicators, suggest that adverse credit supply effects may be stronger than envisaged in the June projections despite the overall favourable state of household and corporate balance sheets.
Compared with the June 2023 projections, real GDP growth has been revised down by 0.2 percentage points for 2023, 0.5 percentage points for 2024 and 0.1 percentage points for 2025. The revisions are largely due to (i) a sharp deterioration in the short-term growth outlook as suggested by survey indicators, (ii) tighter financing conditions (including higher lending rates and more adverse credit supply conditions) and (iii) a stronger exchange rate and weaker foreign demand. The recent decline in activity indicators implies downward revisions to domestic demand in the second half 2023, which carry over to 2024, compounded by further downward revisions to private investment which also lead to lower domestic demand in 2025. The tightening of credit supply is assessed to weigh more heavily on real GDP growth, particularly in 2024, than envisaged in the June projections.
Table 2
Real GDP, labour markets and trade projections
(annual percentage changes, unless otherwise indicated)
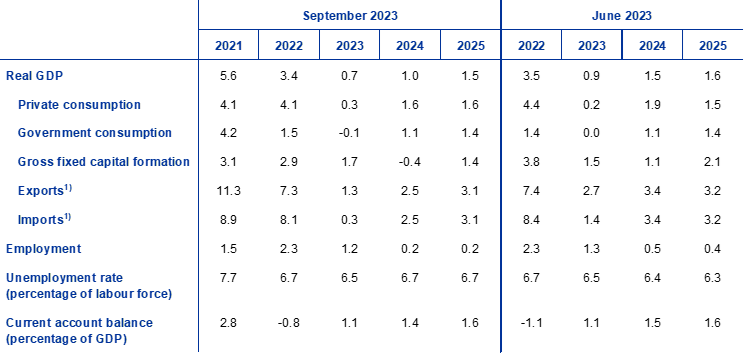
Notes: Real GDP and components refer to seasonally and working day-adjusted data. Historical data may differ from the latest Eurostat publications owing to data releases after the cut-off date for the projections. Data are available for downloading, also at quarterly frequency, from the Macroeconomic Projection Database on the ECB website.
1) This includes intra-euro area trade.
Turning to the components of real GDP, household real consumption is expected to gradually recover and underpin economic growth as uncertainty declines and real incomes and confidence improve. Private consumption was broadly flat in the first half of the year. Consumption of energy and food contracted, while demand for consumer services remained resilient. Reflecting the decline in inflation and uncertainty, consumer spending is expected to strengthen from the third quarter of 2023. Beyond the short term, as inflation and uncertainty recede further and real incomes increase, consumption will continue to improve and underpin economic growth, notwithstanding the gradual fading of the effects of the re-opening of the economy following the pandemic. Private consumption growth has been revised down by 0.3 percentage points for 2024 compared with the June projections, owing to carry-over effects from a downward revision to the short-term outlook and a higher propensity to save, while the medium-term consumption path is largely unchanged.
Real disposable income is projected to recover in 2023 and support consumption, reflecting falling inflation and robust wage growth. After falling slightly in 2022, real disposable income is expected to recover in 2023, amid strong labour and non-labour income growth (particularly owing to the developments in the gross operating surplus and mixed income components in the first quarter of 2023) and declining inflation. Together with the strong wage growth, non-labour income is seen to support households’ purchasing power, despite gradually moderating over the projection horizon. Fiscal transfers should make a broadly neutral contribution to real disposable income and consumption growth over the full horizon. Overall, real disposable income is projected to increase by 0.6% in 2023, by 1.0% in 2024 and by 1.2% in 2025.
The household saving ratio is expected to remain elevated in 2023, normalising only gradually thereafter. The saving ratio increased in the first half of 2023 and is expected to remain well above its pre-pandemic level this year, mostly as a result of the increase in non-labour income in the first quarter of 2023, which has a low propensity to consume. As uncertainty and inflationary pressures recede further over the projection horizon, the household saving ratio will edge down, albeit remaining above its pre-pandemic level as higher interest rates counterbalance households’ desire to normalise their saving behaviour after the pandemic. The stock of excess savings is not expected to support consumption growth, given that it is held largely by wealthier households and in the form of illiquid assets. The saving ratio has been revised up compared with the June projections for the first half of the horizon, largely reflecting data revisions for the first quarter of this year amid stronger non-labour income developments, which are assumed to gradually unwind, and stronger incentives to save owing to the higher interest rates and tighter credit access over the rest of the projection horizon.
Box 1
Technical assumptions about interest rates, commodity prices and exchange rates
Compared with the June 2023 projections, the technical assumptions include higher interest rates as well as higher oil and natural gas prices, lower wholesale electricity prices and an appreciation of the euro. The technical assumptions about interest rates and commodity prices are based on market expectations, with a cut-off date of 22 August 2023. Short-term interest rates refer to the three-month EURIBOR and market expectations are derived from futures rates, while ten-year government bond yields are used to proxy long-term interest rates.[4] Both short and long-term rates have risen since the cut-off date for the June 2023 projections and, relative to those projections, their assumed paths have also been revised up.
Table
Technical assumptions
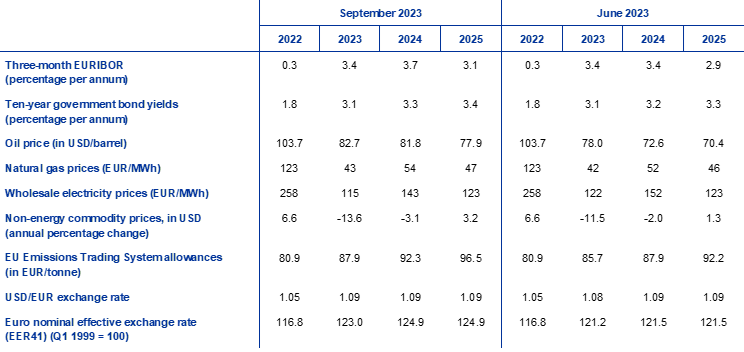
Note: Data are available for downloading from the Macroeconomic Projection Database on the ECB website.
The technical assumptions for oil prices have been revised up by over 10% on average over the projection horizon, as concerns about insufficient oil supply outweighed worries over global oil demand.[5] In the recent period oil prices have been driven by three main factors: the OPEC+ decision to cut supply, a general supply shortfall (upward pressure) and concerns about Chinese oil demand amid worries about the country’s economic growth (downward pressure). Overall, the oil futures curve has shifted upwards since the June 2023 projections (by 5.9% for 2023, 12.6% for 2024 and 10.6% for 2025), but the oil price is still assumed to fall from USD 82.7 per barrel in 2023 to USD 77.9 per barrel in 2025.
The gas price assumptions have increased to a lesser extent than those for oil prices, and electricity price assumptions have decreased. High inventories have contributed to keeping gas prices low, with the EU achieving its 90% gas storage target three months ahead of the November 2023 deadline. Recent outages in Norwegian gas fields and strikes at Australian liquified natural gas facilities have increased market volatility and recently pushed gas prices up amid supply fears. Overall, the gas futures curve has shifted slightly upwards since the June projections (by 1.1% for 2023, 4.6% for 2024 and 2.1% for 2025). In contrast, electricity price futures have been revised down by around 6% for 2023 and 2024 and are largely unrevised for 2025. As regards carbon emissions allowances on the EU Emissions Trading System, the assumed path based on futures has been revised up by around 4% on average since the June projections. Non-energy commodity prices are assumed to be somewhat lower than in the June projections, driven mainly by weaker metal price assumptions, on account of weak global demand, which have been somewhat counterbalanced by higher international prices for food.
Bilateral exchange rates are assumed to remain unchanged over the projection horizon, at the average levels prevailing in the ten working days ending on the cut-off date. This implies an exchange rate of USD 1.09 per euro over the projection horizon, which is 0.7% higher than assumed in the June 2023 projections. The assumption for the effective exchange rate of the euro implies an appreciation of 2.8% compared with the assumption in the June projections.
Housing investment is expected to contract over the projection horizon in reaction to tighter financing costs and credit standards. Following a renewed decline in the second quarter of 2023, housing investment is projected to continue to contract throughout 2024 before gradually regaining some slightly positive growth momentum in the course of 2025. The protracted weakness in housing investment is seen to stem from continued weakness in housing affordability, mainly owing to higher mortgage rates, and in housing profitability, against a backdrop of falling house prices and high construction costs. Together with tight credit conditions, these factors are weighing heavily on housing investment, although continued household income growth should support the modest recovery in 2025.
Business investment is expected to decline in 2024 as tighter financing conditions take a heavy toll; improving domestic and global demand and the green and digital transition are seen to be the drivers of a mild recovery thereafter. Following positive growth in the second quarter, business investment is expected to contract from the third quarter of 2023 and throughout 2024, before returning to growth in 2025. For the coming quarters, weak domestic and global economic activity, high interest rates and credit supply restrictions are expected to weigh particularly heavily on business investment. Towards the end of the projection horizon, business investment will be driven by the expected broader rebound in domestic and foreign demand and further efforts in pursuit of the green and digital transition, in part spurred by crowding-in of private capital by the implementation of plans using Next Generation EU (NGEU) funds.
Box 2
The international environment
Global economic activity moderated in the second quarter of 2023 after strong growth in the first quarter. While global growth in the second quarter was in line with the June projections, its country composition differed.[6] In the United States, activity was more resilient than anticipated amid still solid domestic demand and a strong labour market. Similarly, growth was above previous expectations in Japan and the United Kingdom. In contrast, growth in China fell more sharply than expected with the consumption-led recovery having lost momentum as problems in the Chinese residential real estate sector resurfaced.[7] Global real GDP is projected to expand by 3.2% in 2023, 3.0% in 2024 and 3.2% in 2025, broadly in line with the June projections. However, the limited revisions mask more substantial changes to the growth outlook for major economies, as China’s growth outlook for this year has been revised down substantially, while the growth outlook for major advanced economies has been revised up, largely reflecting stronger than previously estimated growth in the United States.
Despite relatively resilient global economic activity, global trade is expected to stagnate this year, returning to its historical relationship with real GDP later in the projection horizon and also leading to an improvement in euro area foreign demand. The current low trade intensity of global growth reflects the composition of economic activity, partly owing to the nature of the post-pandemic recovery, and entails larger contributions to global growth from services activity and private consumption, and from emerging market countries, which are all less trade-intensive. In addition, global monetary policy tightening is weakening demand. As a result, both global trade and euro area foreign demand are expected to increase by only 0.2% and 0.1% respectively this year. Global trade growth is expected to regain momentum over the rest of the projection horizon and to increase broadly in line with economic activity. Growth in euro area foreign demand is likewise projected to increase to 3% in both 2024 and 2025. Projections for both world imports and euro area foreign demand have been revised down for this year, largely on account of further downward revisions to historical data at the turn of the year and weaker than previously estimated imports in the second quarter. However, their growth over the rest of the projection horizon remains broadly comparable to the June projections
Table
The international environment
(annual percentage changes)
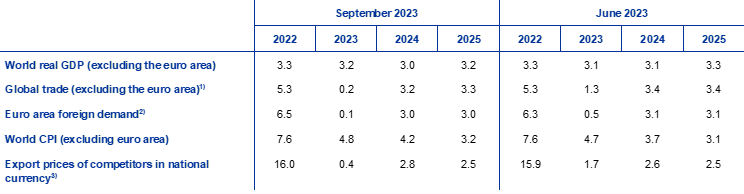
Note: Data are available for downloading from the Macroeconomic Projection Database on the ECB website.
1) Calculated as a weighted average of imports.
2) Calculated as a weighted average of imports of euro area trading partners.
3) Calculated as a weighted average of the export deflators of euro area trading partners.
Global headline inflation is receding but underlying inflationary pressures remain strong, particularly among advanced economies, whereas export prices of euro area competitors are projected to decline sharply, driven by commodity price developments. World headline consumer price index inflation is projected to reach 4.8% this year and to decline gradually to 4.2% and 3.2% in 2024 and 2025 respectively. Global inflation projections for this year are broadly unchanged compared with the June projections, but slightly higher for 2024. This largely reflects upward revisions to Türkiye’s inflation outlook and more persistent inflation in the United Kingdom following several upside surprises in data on consumer price inflation and wages. Export prices of euro area competitors (in national currencies) have been on a declining path since mid-2022, owing to falling commodity prices and a gradual easing in domestic and foreign pipeline pressures. Export prices of euro area competitors have been revised downwards for this year compared with the June projections, reflecting a decline in export price inflation in key trading partners, whereas they have been revised slightly upwards for 2024 owing to higher commodity prices.
Euro area export growth is expected to remain subdued amid weak global trade and competitiveness losses, while import growth has been revised down for the near term amid weaker domestic demand. Following a contraction in the second quarter of 2023, euro area real exports are estimated to grow in the near term at a weaker pace than previously expected. Surveys suggest that new export orders have fallen for both services and goods, while manufacturing firms have now reduced their order backlogs towards normal levels. Moreover, the appreciation of the euro since September 2022 and the still relatively high energy prices facing euro area firms are weighing on euro area price competitiveness. These factors are expected to prevent a recovery in euro area export market shares. Exports are unlikely to make a significant contribution to the euro area recovery, in contrast to past recovery episodes when trade dynamics were stronger. At the same time, euro area import growth is projected to rebound following a strong contraction at the turn of the year associated with less stockpiling of intermediate goods, including energy, but is set to remain subdued over the projection horizon in the context of weak domestic demand. Owing to the recent weakness in imports, the net trade contribution to GDP is expected to be positive in 2023 but neutral over the rest of the projection horizon (Chart 2). Falling import prices led to an improvement in the euro area terms of trade at the beginning of the year, while a stabilisation is projected over the projection horizon. The surplus in the euro area current account balance is expected to increase, although remaining below pre-pandemic levels.
Chart 2
Euro area real GDP – decomposition into the main expenditure components
(annual percentage changes, percentage point contributions)
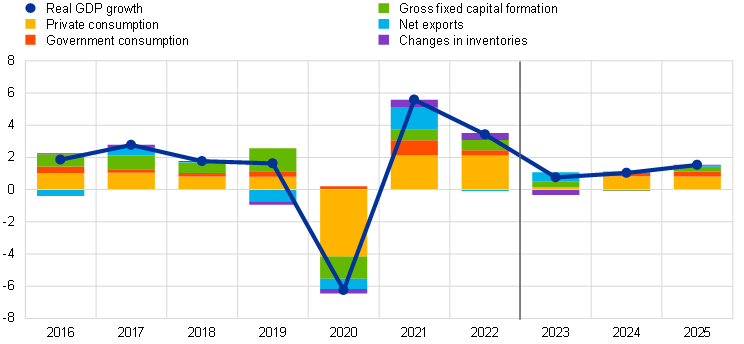
Notes: Data are seasonally and working day-adjusted. Historical data may differ from the latest Eurostat publications owing to data releases after the cut-off date for the projections. The vertical line indicates the start of the projection horizon.
The labour market is projected to slow down in the coming quarters, in line with the weaker growth outlook, with unemployment edging up. Employment growth slowed down to 0.2% in the second quarter of 2023 compared with the previous quarter. In annual terms, employment is expected to grow by 1.2% in 2023 and only 0.2% in both 2024 and 2025 (Chart 3). This reflects some labour hoarding in the face of the worsening short-term economic outlook, which is expected to gradually unwind over the medium term. Low employment growth is seen to be accompanied by an increasing path for the unemployment rate over the projection horizon, suggesting that the growth in employment will to a large extent be the result of additional entrants to the labour force. The unemployment rate is expected to increase slightly from its historical low of 6.4% to stand at 6.7% in 2025. This entails an upward revision of 0.3 percentage points for 2024 and 0.4 percentage points for 2025 in the light of the revisions to the growth outlook. Average hours worked per person employed are projected to grow moderately, implying a recovery to around their pre-pandemic levels by the end of the projection horizon. In terms of both number of employees and hours worked, the projections therefore suggest a gradual reduction of labour hoarding and thus a recovery in labour productivity.
Chart 3
Euro area labour market
(percentage of labour force (left-hand scale), annual percentage changes (right-hand scale))

Note: The vertical line indicates the start of the projection horizon.
Box 3
Scenario analysis of a potential further slowdown and financial stresses in China and spillovers to the euro area
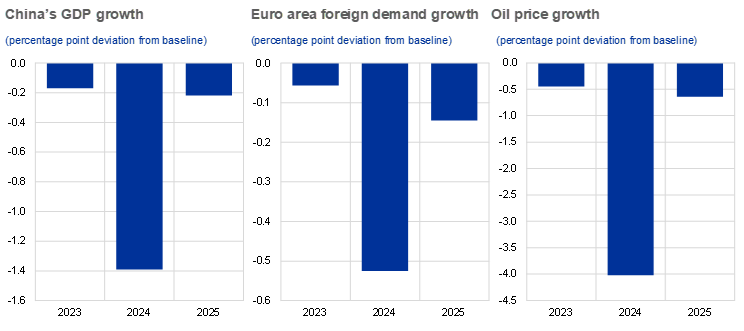
This scenario analysis explores the downside risks to the September 2023 projections stemming from the Chinese economy. The scenario assumes a further deterioration and weaker investment in the Chinese residential property market. This is also assumed to lead to new tensions in the associated financial market that give rise to higher private funding costs and negative household wealth effects. The risk scenario implies a more pronounced cooling of China’s economy relative to the September 2023 projections with real GDP falling by 1.4 percentage points below the baseline in 2024, while the effects would be limited in 2025 (Chart A).[8] From an international perspective, the spillovers are contained overall, with a disinflationary effect, given the nature of the residential property and financial market shocks, which weighs on foreign demand and on commodity prices – particularly oil prices, which would fall by 4% in 2024. However, this is under the assumption that the slowdown would not trigger additional global uncertainty effects that could lead to higher volatility in financial markets.
Chart A
Scenario of a slowdown in China
Note: See footnote 8 for details on the implemented shocks.
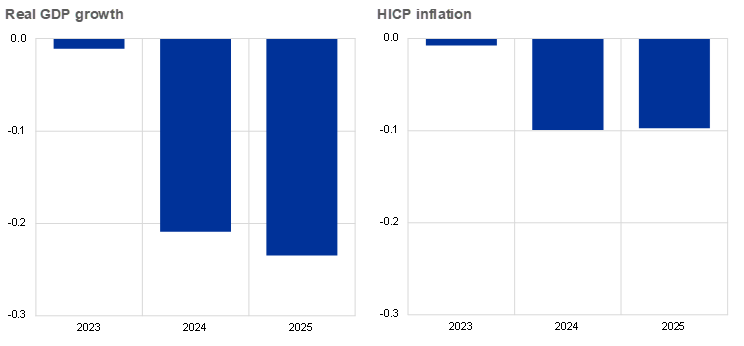
The scenario would imply weaker growth and inflation in the euro area. In the scenario, euro area real GDP growth would decrease by 0.2 percentage points in both 2024 and 2025 compared with the September 2023 baseline, initially owing mostly to lower world (euro area foreign) demand, while the impact via financial channels would be responsible for the bulk of the effect in 2025 (Chart B).[9] The impact on oil prices would give rise to a decrease in euro area inflation of 0.1 percentage points in 2024. The contribution of lower energy prices to euro area inflation would gradually dissipate by the end of the projection horizon as the demand-supply balance in the commodity market is re-established, while trade and financial spillovers would become more important and lead to a further 0.1 percentage point decrease in 2025.
Chart B
Impact of an economic slowdown in China on euro area real GDP growth and HICP inflation
(percentage point deviation from baseline annual growth)
Source: Simulations using the ECB-BASE model and ECB staff calculations.
Notes: Simulations were conducted under a forecast setting with backward-looking expectation formation and with exogenous monetary and fiscal policy. The exchange rate incorporates the impact on the EUR-USD exchange rate as well as the nominal effective exchange rate of the euro.
3 Fiscal outlook
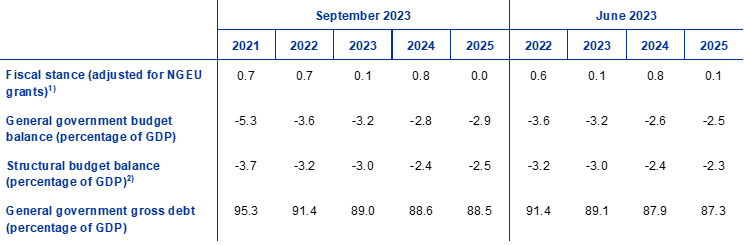
The fiscal stance is projected to be neutral in 2023 and 2025 but to tighten in 2024; compared with the June projections, fiscal assumptions imply some more discretionary tightening at the euro area level, particularly in 2023 (Table 3). The euro area fiscal stance, adjusted for NGEU grants, is projected to be broadly balanced in 2023 but to tighten significantly in 2024 mainly on account of the withdrawal of almost 75% of the energy and inflation compensatory measures from 2023. In 2025 the fiscal stance is again expected to be neutral, as a further unwinding of the energy measures is partly compensated by higher investment, supported by the NGEU programme and higher defence spending. Substantial fiscal support nonetheless remains in the baseline projections compared with 2019, prior to the pandemic. Since the June 2023 projections, revisions to the fiscal assumptions are in large part related to the downscaling of energy and inflation compensatory measures. In 2023, this reduction stems primarily from Germany, where the (gross) fiscal cost of energy measures has been reduced, as the evolution of energy prices has made the existing price caps less expensive, without directly affecting energy inflation. For 2024, the largest reduction in energy measures is in France, mainly on account of a revision to the electricity price shield that makes it less generous, reducing its fiscal costs and increasing energy inflation. Beyond the reversal of the impact from energy measures, the revisions in the total discretionary measures stem from somewhat higher wage and other expenditures.
Table 3
Fiscal outlook for the euro area
(percentage of GDP)
Note: Data are available for downloading from the Macroeconomic Projection Database on the ECB website.
1) The fiscal policy stance is measured as the change in the cyclically adjusted primary balance net of government support to the financial sector. The figures shown are also adjusted for expected grants under the Next Generation EU (NGEU) programme on the revenue side. A negative figure implies a loosening of the fiscal stance.
2) Calculated as the government balance net of transitory effects of the economic cycle and measures classified under the European System of Central Banks definition as temporary.
The euro area fiscal outlook is set to improve over the projection horizon, but less than foreseen in the June 2023 projections. The budget deficit is projected to continue to decline in 2023 and 2024, falling to 2.8% of GDP, but to increase slightly again to 2.9% of GDP in 2025. This is driven mainly by a decreasing cyclically adjusted primary deficit in 2023-24, followed by a stabilisation in 2025 in combination with interest payments increasing somewhat as a share of GDP. Compared with the June 2023 projections, the higher deficit at the end of the projection horizon is on account of higher primary expenditures, including higher expenditures on unemployment benefits. The euro area debt-to-GDP ratio is projected to continue to decline to stand at 88.5% in 2025, driven by negative interest rate-growth differentials that more than compensate for primary deficits and expected positive deficit-debt adjustments. The reduction in the debt ratio has been revised down compared with the June projections, mainly reflecting the change in the interest rate-growth differential.
4 Prices and costs
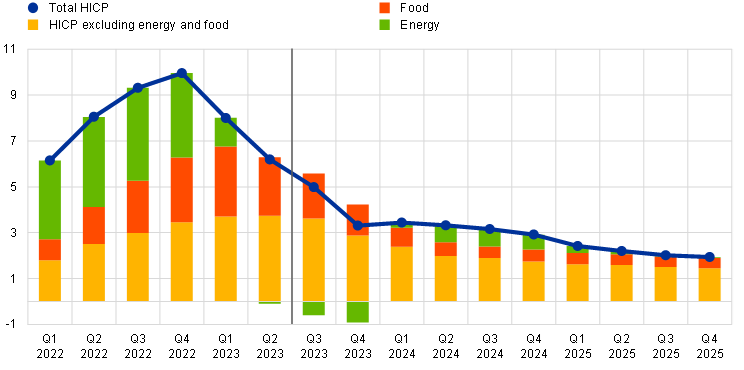
HICP inflation is projected to decrease from an average of 8.4% in 2022 to an average of 5.6% in 2023, 3.2% in 2024 and 2.1% in 2025. After a sharp decline in the course of 2023, headline inflation is expected to move broadly sideways in the first half of 2024, before falling gradually further in 2025, reaching the ECB’s inflation target in the third quarter of 2025 (Chart 4). This decline in headline inflation over the projection horizon reflects decreases in the annual rates of change of all the main components, albeit to varying degrees. The profile is also affected initially by strong base effects in the energy and food components and, throughout the horizon, by fiscal policy measures and commodity price assumptions (Chart 5 and Chart 6).
Chart 4
Euro area HICP inflation
(annual percentage changes)
Notes: The vertical line indicates the start of the current projection horizon. The ranges shown around the central projections for HICP inflation are based on past projection errors, after adjustment for outliers. The bands, from darkest to lightest, depict the 30%, 60% and 90% probabilities that the outcome of HICP inflation will fall within the respective intervals. For more information, see Box 6 of the March 2023 ECB staff macroeconomic projections for the euro area.
Chart 5
Impact of base effects from the food and energy components on headline HICP inflation
(percentage points)
Sources: Eurostat and ECB calculations.
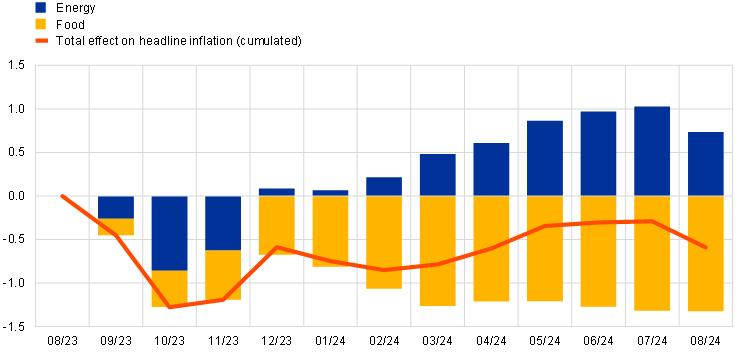
Notes: The cumulative impact of base effects is always shown relative to a specific reference month. For example, energy base effects would imply a 1.0 percentage point increase in headline HICP inflation in June 2024 compared with the inflation rate in August 2023. Likewise, base effects from the food component explain a 1.3 percentage point decline in headline HICP inflation in June 2024 compared with August 2023. Taken together, food and energy base effects lower headline HICP inflation in June 2024 by 0.3 percentage points compared with the rate in August 2023.
Following an uptick in 2024, related to the unwinding of fiscal support measures, energy inflation is expected to add only marginally to headline inflation in 2025. Energy inflation is set to contribute notably to the decline in headline inflation in the short term, and will remain negative until the last quarter of 2023 before turning positive and rising to 7.4% in the second quarter of 2024. This turnaround is seen to reflect renewed increases in energy commodity prices following declines over the past year, base effects changing the sign from the fourth quarter of 2023 onwards, and the withdrawal of energy and inflation compensatory fiscal measures. In 2025, energy inflation is expected to decline to 1.4%, a rate broadly in line with the profiles for the technical assumptions for oil, gas and electricity wholesale prices.
Food inflation is projected to continue to decline, given significant base effects, easing pipeline pressures and an assumed decline in euro area food commodity prices. After standing at 9.8% in August 2023, annual food inflation is envisaged to drop to 3.0% in the second quarter of 2024, reflecting a pronounced weakening in both processed and unprocessed food inflation. However, dynamic labour cost developments and upward pressures from adverse weather effects related to, for example, the recent droughts, should support food inflation. Over the medium term, food inflation is expected to decline more gradually, averaging 2.3% in 2025, as upward price pressures from food commodities ease and profit margins normalise, although it will remain somewhat elevated owing to dynamic growth in labour costs.
Chart 6
Euro area HICP inflation – decomposition into the main components
(annual percentage changes, percentage points)
Note: The vertical line indicates the start of the current projection horizon.
HICP inflation excluding energy and food (HICPX) is projected to continue to gradually decline, although it will remain elevated owing to strong, though slowing, wage growth throughout the projection horizon (Table 4 and Chart 7). After standing at a rate of 5.3% in August 2023, HICPX inflation is envisaged to recede to 2.9% in 2024. Regarding its two main components, non-energy industrial goods inflation is foreseen to decline more than services inflation, in line with the stronger role that receding pipeline pressures play in goods inflation and the stronger role that elevated labour cost pressures play in services inflation. Overall, the expected decline in HICPX inflation from 5.1% in 2023 to 2.2% in 2025 follows the unwinding of supply bottlenecks and energy effects, and also increasingly reflects the impact of monetary policy tightening and the normalisation of demand as the pandemic re-opening effects dissipate. The projected elevated level of HICPX inflation reflects that the impact of high, though declining, nominal wage growth is expected to be only partly offset by adjustments in profit margins.
Chart 7
Euro area HICP inflation excluding energy and food
(annual percentage changes)
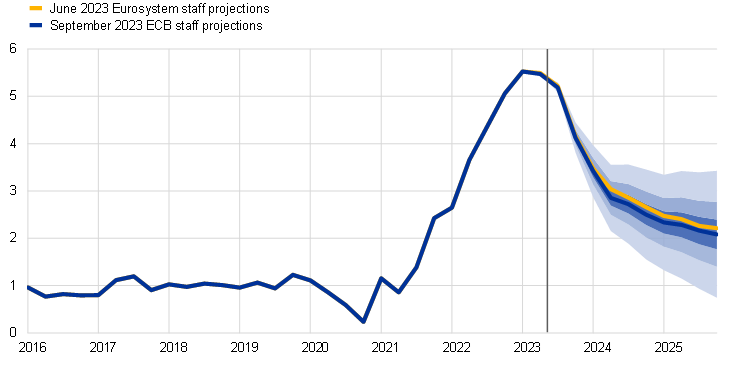
Notes: The vertical line indicates the start of the current projection horizon. The ranges shown around the central projections for HICPX inflation are based on past projection errors, after adjustment for outliers. The bands, from darkest to lightest, depict the 30%, 60% and 90% probabilities that the outcome of HICPX inflation will fall within the respective intervals. For more information, see Box 6 of the March 2023 ECB staff macroeconomic projections for the euro area.
Compared with the June 2023 projections, the projection for HICP inflation has been revised up by 0.2 percentage points for both 2023 and 2024 and revised down by 0.1 percentage points for 2025. The energy component has been revised up for 2023 and 2024 owing to recent data surprises, higher oil futures prices and changes in regulatory prices. These upward revisions have been partly outweighed by downward revisions to the non-energy components. Food inflation has been revised up for 2023 owing mainly to upside data surprises, whereas downward revisions for 2024 and 2025 are due to lower technical assumptions for euro area farm gate prices. HICPX inflation is unrevised for 2023, but has been revised down for 2024 and 2025 on account of the appreciation of the euro and the weaker demand outlook.
Table 4
Price and cost developments for the euro area
(annual percentage changes)
Notes: GDP and import deflators, unit labour costs, compensation per employee and labour productivity refer to seasonally and working day-adjusted data. Historical data may differ from the latest Eurostat publications owing to data releases after the cut-off date for the projections. Data are available for downloading, also at quarterly frequency, from the Macroeconomic Projection Database on the ECB website.
1) The sub-index is based on estimates of actual impacts of indirect taxes. This may differ from Eurostat data, which assume a full and immediate pass-through of indirect tax impacts to the HICP.
2) Measured as real GDP per person employed.
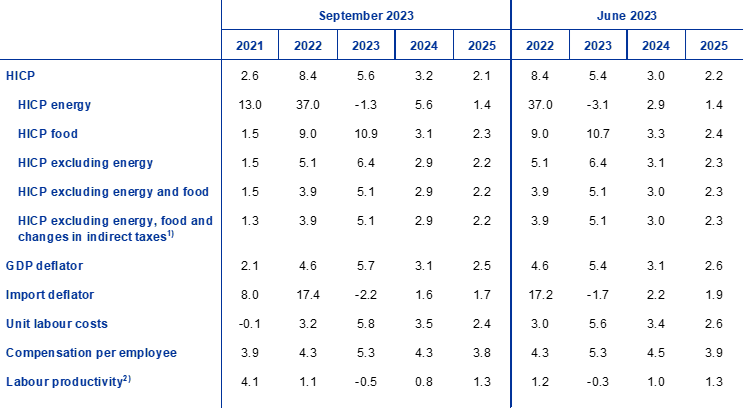
Nominal wage growth is projected to gradually decline over time, while remaining elevated owing to still tight labour markets and increases in minimum wages and inflation compensation. Growth in compensation per employee is projected to decline from 5.3% in 2023 to 3.8% in 2025. For 2023, the figure is unchanged compared with the June projections, whereas slightly lower growth is expected for 2024 and 2025 reflecting a weakening labour market. Losses in purchasing power incurred since the surge in inflation are expected to be made up only at the end of the projection horizon. Growth in unit labour costs is expected to peak in 2023 before declining in 2024 and 2025, amid declining wage growth and a recovery in productivity growth (Chart 8).
Chart 8
Decomposition of euro area unit labour costs
(annual percentage changes; percentage points)
Note: The vertical line indicates the start of the current projection horizon.
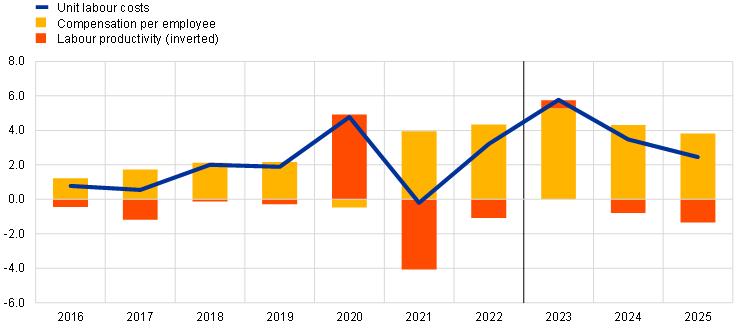
Domestic price pressures, as measured by the growth of the GDP deflator, are projected to decrease gradually from their current high levels over the projection horizon (Chart 9). The annual growth rate of the GDP deflator is projected to have peaked in the first and second quarters of 2023, at an all-time high of 6.3%, and to gradually recede to a rate of 2.0% at the end of 2025. In addition to falling growth rates of unit labour costs, this decline is also driven by slower growth of unit profits. Exceptional factors that supported firms’ margins in 2021 and 2022 are also likely to do so in in the first half of 2023, whereas the unwinding of supply bottlenecks, as well as weak aggregate demand and strong wage growth over most of the projection horizon are consistent with declining profit indicators over the horizon.[10] Unit profits are expected to decline until mid-2024 and, alongside the disinflationary impact of improvements in the terms of trade and strengthening productivity growth, will help to absorb the relatively strong labour cost growth. From the second half of 2024 unit profits will increase as the slowdown in labour cost growth is seen to support price-setting of firms.
Chart 9
Euro area GDP deflator – income side decomposition
(annual percentage changes, percentage points)
Note: The vertical line indicates the start of the current projection horizon.
Following a surge in 2022, the annual growth rate of import prices is expected to turn negative in 2023, leading to improving terms of trade over the projection horizon. Following a 17.4% surge in 2022, the import deflator is expected to drop sharply and contract in 2023, amid fading supply bottlenecks for imported inputs, before turning positive in 2024 and 2025 in line with the assumed profile for energy commodity prices and moderate increases in non-food commodity prices.
Box 4
Sensitivity analysis: alternative energy and food price paths
Given the significant uncertainty surrounding future energy price developments, alternative paths for energy prices are derived from option-implied oil and gas prices and a constant price path to assess the implications for the outlook for HICP inflation and real GDP growth. In this analysis, a synthetic energy price index is used, which combines both oil and gas futures prices. Alternative downside and upside paths are derived from the 25th and 75th percentiles of the options-implied neutral densities for both oil and gas prices on 22 August 2023 (the cut-off date for the technical assumptions). Both distributions point to upside risks to the technical assumptions entailed in the September 2023 projections. These risks are very pronounced for gas futures prices in the light of continuing tight and volatile gas markets owing to the war in Ukraine. In addition, a constant price assumption is considered for both oil and gas prices. The impacts of the alternative paths are assessed with a range of ECB and Eurosystem macroeconomic models used in the projections. The average impacts on real GDP growth and HICP inflation across these models are shown in the table below.
Table A
Impacts of alternative energy price paths
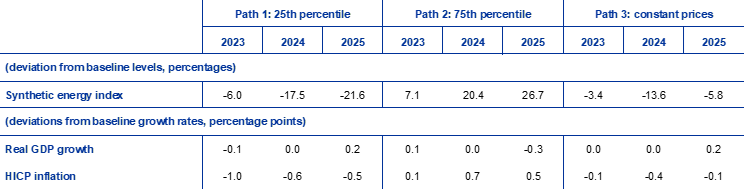
Notes: In this sensitivity analysis, a synthetic energy price index that combines oil and gas futures prices is used. The 25th and 75th percentiles refer to the option-implied neutral densities for the oil and gas prices on 22 August 2023. The constant oil and gas prices take the respective value as at the same date. The macroeconomic impacts are reported as averages of a number of ECB and Eurosystem staff macroeconomic models.
A similar sensitivity analysis is conducted with alternative paths for international food prices, which are tilted to the upside. This analysis assumes that international food commodity prices for wheat and maize follow the 10th and 90th percentiles of option-implied prices on 22 August. The distributions are tilted to the upside, likely reflecting a combination of climate change-related risks and the El Niño phenomenon which might amplify the already likely higher frequency of extreme weather events resulting from climate change in general, as well as continued uncertainty about global grain supplies stemming from the war in Ukraine. The impacts of the alternative paths on euro area inflation projections are assessed using elasticities from the Eurosystem macroeconomic models used in the projections and are shown in the table below. The impact on euro area real GDP growth from these higher food prices would be negligible.
Table B
Impacts of alternative food price paths
(deviations from baseline growth rates, percentage points)
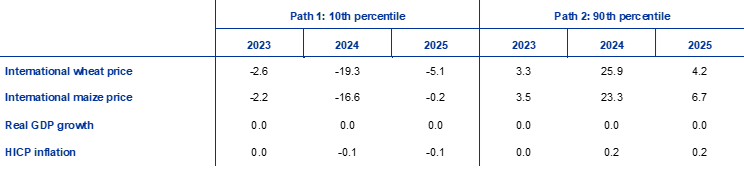
Notes: In this sensitivity analysis, the 10th and 90th percentiles refer to the option-implied neutral densities for the wheat and maize prices on 22 August 2023. The paths from option-implied densities are transformed into an impact on euro area farm gate prices. The macroeconomic impacts are computed using elasticities from the Eurosystem macroeconomic models used in the projections.
Box 5
Forecasts by other institutions
Forecasts for the euro area are available from both international organisations and private sector institutions. However, these forecasts are not directly comparable with one another or with the ECB staff macroeconomic projections, as these were finalised at different points in time. Additionally, these projections use different methods to derive assumptions for fiscal, financial and external variables, including oil, gas and other commodity prices. Finally, there are differences in working day adjustment methods for real GDP across different forecasts.
Table
Comparison of recent forecasts for euro area real GDP growth and HICP inflation
(annual percentage changes)
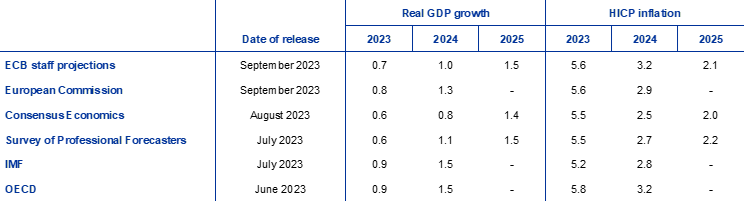
Sources: European Commission Summer 2023 Interim Economic Forecast, 11 September 2023; Consensus Economics Forecasts, 10 August 2023 (data for 2025 taken from the July 2023 survey); ECB Survey of Professional Forecasters, 28 July 2023; IMF World Economic Outlook Update, 25 July 2023; OECD June 2023 Economic Outlook 113, 7 June 2023.
Notes: The ECB staff macroeconomic projections report working day-adjusted annual growth rates for real GDP, whereas the European Commission and the IMF report annual growth rates that are not adjusted for the number of working days per annum. Other forecasts do not specify whether they report working day-adjusted or non-working day-adjusted data.
The September 2023 ECB staff projections are within the range of other forecasts for GDP growth and inflation. The ECB staff GDP growth projection for 2023 is slightly above private sector forecasts and somewhat below the IMF’s World Economic Outlook Update, the European Commission’s Summer (interim) forecast and the OECD’s forecast. For 2024 the ECB staff projection is among the lowest forecasts, but somewhat above the survey published by Consensus Economics. For 2025 it is similar to the few other available forecasts for that year. As regards HICP inflation, the ECB staff projection for 2024 is among the highest forecasts and in line with the OECD’s forecast, but considerably above the Consensus Economics survey. For 2025 it is within the narrow range of other forecasts.
© European Central Bank, 2023
Postal address 60640 Frankfurt am Main, Germany
Telephone +49 69 1344 0
Website www.ecb.europa.eu
All rights reserved. Reproduction for educational and non-commercial purposes is permitted provided that the source is acknowledged.
For specific terminology please refer to the ECB glossary (available in English only).
PDF ISBN 978-92-899-5565-2, ISSN 2529-4466, doi:10.2866/753, QB-CE-23-002-EN-N
HTML ISBN 978-92-899-5622-2, ISSN 2529-4466, doi:10.2866/746241, QB-CE-23-002-EN-Q
The cut-off date for technical assumptions, such as those for oil prices and exchange rates, was 22 August 2023. The projections for the global economy were finalised on 22 August and the macroeconomic projections for the euro area were finalised on 30 August 2023. Although this was one day before the publication of Eurostat’s euro area HICP flash estimate for August 2023, earlier national flash estimate releases covering around 45% of the euro area HICP were included in the projections. The current projection exercise covers the period 2023-25. Projections over such a long horizon are subject to very high uncertainty, and this should be borne in mind when interpreting them. See the article entitled “The performance of the Eurosystem/ECB staff macroeconomic projections since the financial crisis”, Economic Bulletin, Issue 8, ECB, 2019. See also http://www.ecb.europa.eu/pub/projections/html/index.en.html for an accessible version of the data underlying selected tables and charts. A full database of past ECB and Eurosystem staff macroeconomic projections is available from the Macroeconomic Projection Database on the ECB website. Starting with the September 2023 projections, the database has been expanded to include more variables than are presented in this report and many at quarterly frequency.
Following the finalisation of the ECB staff projections, Eurostat published a new estimate for growth in the second quarter of 2023 of 0.1%, quarter on quarter, which is 0.2 percentage points below the initial flash release and the figure shown in Chart 1.
See the box entitled “A model-based assessment of the macroeconomic impact of the ECB’s monetary policy tightening since December 2021”, Economic Bulletin, Issue 3, ECB, 2023.
The assumption for euro area ten-year nominal government bond yields is based on the weighted country average of ten-year benchmark bond yields, weighted by annual GDP figures and extended by the forward path derived from the ECB’s euro area all-bonds ten-year par yield, with the initial discrepancy between the two series kept constant over the projection horizon. The spreads between country-specific government bond yields and the corresponding euro area average are assumed to be constant over the projection horizon.
The technical assumptions for commodity prices are based on the path implied by futures markets, taking the average of the two-week period ending on the cut-off date of 22 August 2023.
References to world and/or global aggregates of economic indicators throughout this box exclude the euro area.
See Box 3 which describes an adverse risk scenario of a stronger downturn in the Chinese residential real estate sector accompanied by financial stress.
The scenario comprises two layers. The first considers a deeper and more prolonged contraction in residential property investment in China (around 15% below the baseline), starting in the fourth quarter of 2023. In the second layer, it is assumed that the turmoil in the residential property sector additionally triggers a sharp tightening of financial conditions in China (and Asian emerging market economies), with a 100 basis point rise in risk premia to account for a broad drying-up of liquidity as the balance sheets of banks and developers become stretched. Moreover, the scenario assumes a sell-off of equities, triggering a 15% fall in Chinese stock prices.
In addition to weak euro area foreign demand and lower oil prices, the financial turmoil spills over to higher lending rates and risk premia in the euro area. However, no extra shocks related to euro area financial conditions are included. These spillovers to the euro area are estimated using the ECB-BASE model for the euro area aggregate, without considering cross-country heterogeneity and resulting spillovers.
For more information on the GDP deflator decomposition and the role of unit profits for inflation analysis, see the box by E. Hahn, entitled “How have unit profits contributed to the recent strengthening of euro area domestic price pressures?”, Economic Bulletin, Issue 4, ECB, 2023; as well as Arce, O., Hahn, E. and Koester, G., “How tit-for-tat inflation can make everyone poorer”, ECB Blog, 30 March 2023.
-
14 September 2023