
The ECB Survey of Professional Forecasters (SPF) - First quarter of 2019
Summary
The results of the ECB Survey of Professional Forecasters (SPF) for the first quarter of 2019 show downward revisions to inflation and real GDP growth expectations, particularly in the near term[1]. HICP inflation expectations stood at 1.5%, 1.6% and 1.7% for 2019, 2020 and 2021, respectively. Longer-term inflation expectations were also revised down, to 1.8% from 1.9%. Expectations for real GDP growth stood at 1.5%, 1.5%, and 1.4% for 2019, 2020 and 2021, respectively. Expectations for real GDP growth in the longer term were also revised down, to 1.5%. Unemployment rate expectations were broadly unchanged and continued to point to further falls towards a longer-term unemployment rate of 7.5%.
Table 1
Results of the SPF in comparison with other expectations and projections
(annual percentage changes, unless otherwise indicated)

1) Longer-term expectations refer to 2023.
2) As a percentage of the labour force.
1 Inflation expectations revised down
The results for the first quarter of 2019 show average HICP inflation expectations of 1.5%, 1.6% and 1.7% for 2019, 2020 and 2021, respectively (see Chart 1). Relative to the previous survey, this represents downward revisions of 0.2 percentage points (p.p.) for 2019 and 0.1p.p. for 2020 (expectations for 2021 were surveyed for the first time). The revisions to the expected profile for overall HICP inflation likely reflected to a large extent downward revisions to the expected oil price, which for the first half of 2019 stood 17% lower in euro terms than in the previous survey, as well as downward revisions to expectations for underlying inflation. The latest SPF results for inflation in 2019 and 2020 are comparable with the expectations reported in other surveys (see Table 1).
Average expectations for inflation excluding energy, food, alcohol and tobacco (HICPX) were revised down to stand at 1.3%, 1.5% and 1.6% for 2019, 2020 and 2021, respectively. The latest SPF profile represents downward revisions of 0.1p.p. for 2019 and 0.2p.p. for 2020. However, when calculated using the unrounded results, the downward revision for 2020 was a little smaller than that for 2019 (see Chart 1).
Chart 1
Inflation expectations: overall HICP and HICP excluding energy, food, alcohol and tobacco
(annual percentage changes)

The reported probability distributions continued to indicate relatively elevated uncertainty around expected inflation in two years’ time, although the downside balance of risks receded a little. The width of the forward-looking probability distributions indicates the perceived degree of overall uncertainty, whereas the asymmetry of the distributions indicates whether that uncertainty is more concentrated on higher or lower outturns, i.e. it measures the perceived balance of risks. For the calendar years 2019 and 2020, the aggregate probability distributions shifted to the left, mirroring the reductions in the point forecasts (see Chart 2). At the two-year horizon, forecasters’ probability distributions remained wide by historical standards, suggesting that uncertainty about future inflation outcomes at this horizon remained elevated. The balance of risks remained skewed towards the downside, though to a much lesser extent than seen over the period 2016-17. Respondents’ qualitative comments also tended to discuss downside risks, which were mainly seen as stemming from the downside risks to economic growth.
Chart 2
Aggregate expected probability distributions for inflation in 2019, 2020 and 2021
(x-axis: HICP inflation expectations, annual percentage changes; y-axis: probability, percentages)


Note: The SPF asks respondents to report their point forecasts and to separately assign probabilities to different ranges of outcomes. This chart shows the average probabilities they assigned to inflation outcomes in 2019, 2020 and 2021.
2 Longer-term inflation expectations revised down to 1.8%
The average point forecast for inflation in the longer term (2023) was revised down to 1.8%, from 1.9% in the previous survey. Compared with the cross-sections of responses in the previous survey, there was a drop in the proportion of respondents reporting a longer-term forecast of 1.9% and, at the same time, an increase in the proportion of respondents reporting 1.7% (see Chart 3). Other summary statistics also pointed to lower longer-term inflation expectations. The median point forecast decreased from 1.9% to 1.8%, while the mean of the expected probability distribution decreased from 1.8% to 1.7% (see Chart 4). Longer-term expectations for HICP inflation excluding energy, food, alcohol and tobacco decreased to 1.7%, from 1.8% in the previous survey.
Chart 3
Distribution of point expectations for HICP inflation in the longer term
(x-axis: HICP longer-term inflation expectations, annual percentage changes; y-axis: percentages of respondents)
Notes: The SPF asks respondents to report their point forecasts and to separately assign probabilities to different ranges of outcomes. This chart shows the spread of point forecast responses.
Chart 4
Longer-term inflation expectations
(annual percentage changes)

As with shorter-term inflation expectations, perceptions of overall uncertainty remained high, with the balance of risks remaining to the downside. Although the width of forecasters’ probability distributions for inflation in the longer term narrowed slightly, it still remained high, indicating elevated uncertainty. Echoing the pattern for two-year inflation expectations, the balance of risks remained to the downside (see Chart 5), but to a lesser extent than seen over the period 2016-17. This result is part of a more general picture seen in recent years with the longer-term balance of risks remaining tilted towards more adverse economic outcomes across all main survey variables, i.e. towards slower growth, higher unemployment and lower inflation.
Chart 5
Aggregate probability distribution of longer-term inflation expectations
(x-axis: HICP inflation expectations, annual percentage changes; y-axis: probability, percentages)

Notes: The SPF asks respondents to report their point forecasts and to separately assign probabilities to different ranges of outcomes. This chart shows the average probabilities they assigned to inflation outcomes in the longer term.
3 Real GDP growth expectations revised down
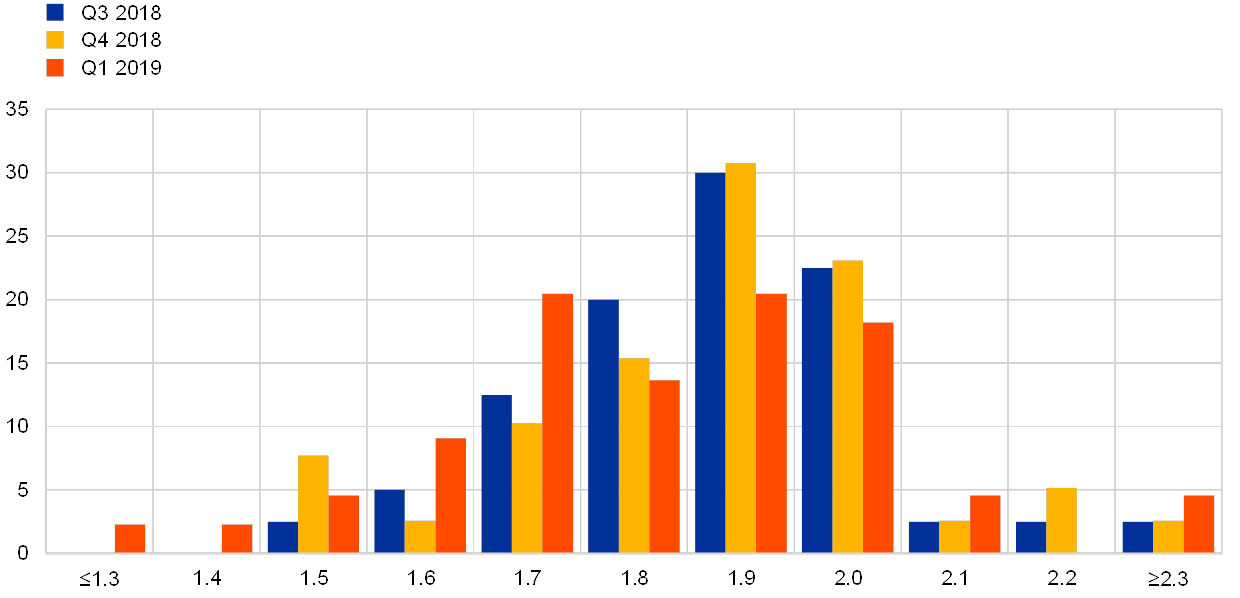
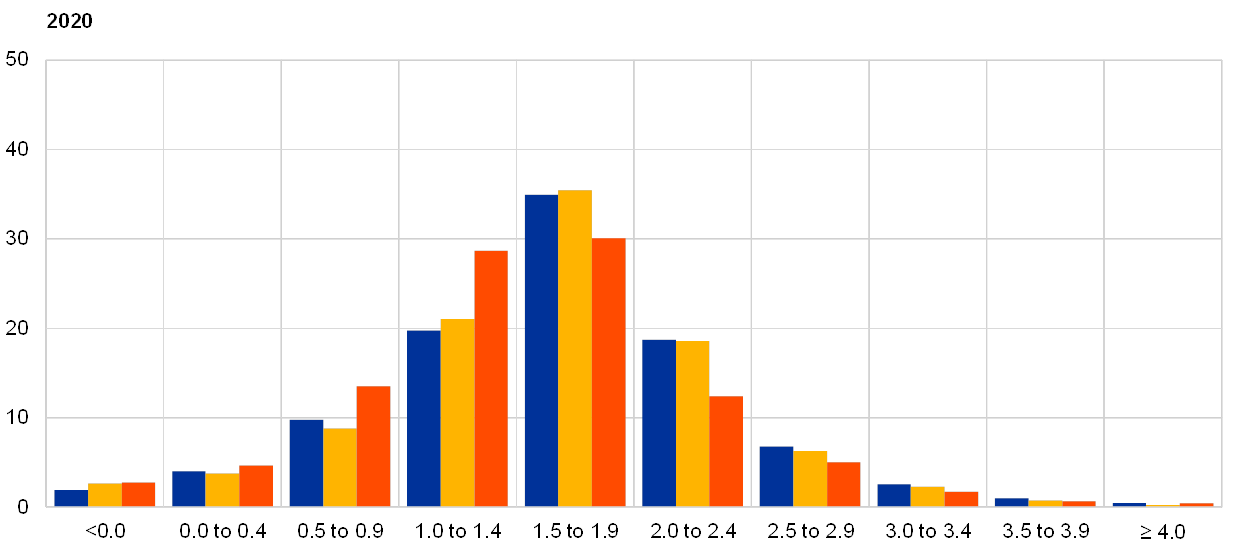
Expectations for real GDP growth stood at 1.5%, 1.5%, and 1.4% for 2019, 2020 and 2021, respectively (see Chart 6). That implies downward revisions of 0.3 p.p. and 0.1 p.p. for 2019 and 2020, respectively. Longer-term growth expectations were also revised down by 0.1 p.p. to 1.5%. Respondents largely explained revisions for 2019 by reference to the disappointing economic data at the end of 2018 and therefore less momentum going into 2019, as well as lower global activity weighing on trade. Nevertheless, many forecasters pointed out that they see the current slowdown in quarterly growth as partly driven by temporary special factors and expect some pick up during 2019. The latest SPF results for 2019 and 2020 are broadly comparable with those published in other surveys (see Table 1). In line with the downward revisions to point forecasts also the probability distributions surrounding them also shifted more towards lower values. For 2019 and 2020 respondents continue to assign the highest likelihood to outcomes between 1.5% and 1.9%, but the expected probability of GDP growth above 1.5% was revised down from 76% to 53% for 2019, and from 64% to 50% for 2020 (see Chart 7).
Chart 6
Expectations for real GDP growth
(annual percentage changes)

Risks to the forecasts for real GDP growth were seen as being to the downside, but have faded somewhat compared to the previous round, especially in the longer term. At all horizons, the trend in perceived balance of risks, as measured by the asymmetry of the forecast distributions, has been one of normalisation from the strong downside risks recorded in 2016. In the latest survey, the longer-term distribution was close to symmetrical, indicating broadly balanced risks (see Chart 8). The qualitative risks mentioned were predominantly to the downside and again related to the external environment. Negative impacts from a hard Brexit were the most cited downside risk. In addition to that, many respondents referred to the same downside risks as in the previous survey round, namely a further escalation of the trade conflict between the United States and China, and the risk that the slowdown in China would turn out stronger than expected and spill over to other emerging economies. On the upside, a few forecasters mentioned that activity could recover more than in the current baseline, should US-China trade tensions be resolved, Brexit turn out softer than envisaged, or the oil price drop further.
Chart 7
Aggregate probability distributions for GDP growth expectations for 2019, 2020 and 2021
(x-axis: real GDP growth expectations, annual percentage changes; y-axis: probability, percentages)


Notes: The SPF asks respondents to report their point forecasts and to separately assign probabilities to different ranges of outcomes. This chart shows the average probabilities they assigned to real GDP growth outcomes in 2019, 2020 and 2021.
Chart 8
Aggregate probability distribution for longer-term GDP growth expectations
(x-axis: real GDP growth expectations, annual percentage changes; y-axis: probability, percentages)

Note: The SPF asks respondents to report their point forecasts and to separately assign probabilities to different ranges of outcomes. This chart shows the average probabilities they assigned to real GDP growth outcomes in the longer term.
4 Unemployment rate expectations broadly unchanged
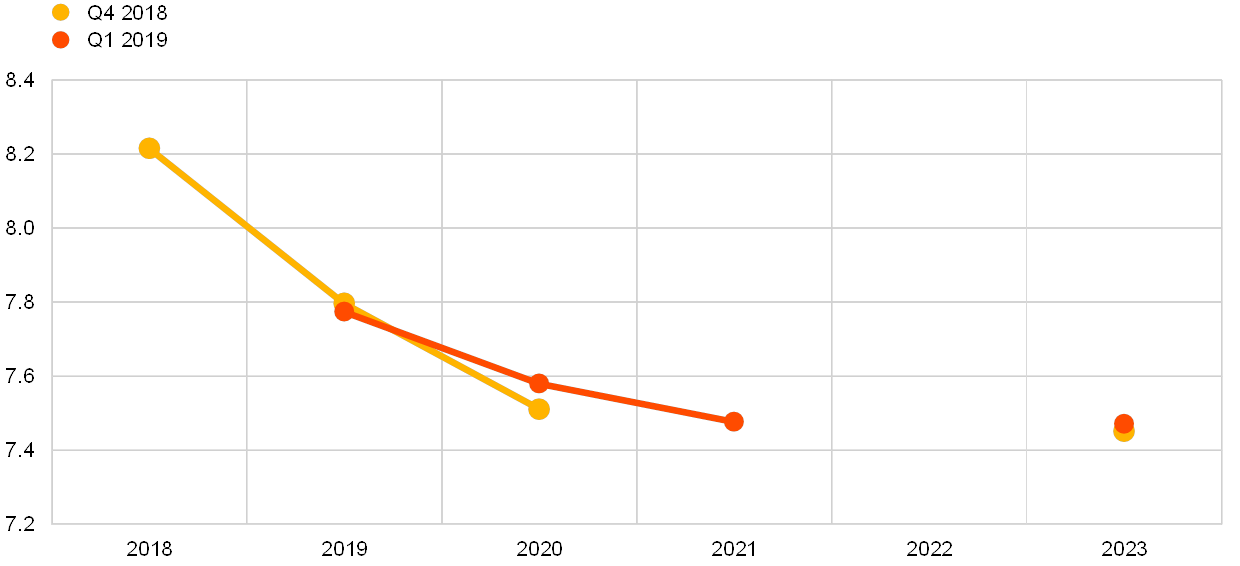
The average point forecasts for the unemployment rate were 7.8%, 7.6% and 7.5% for 2019, 2020 and 2021, respectively (see Chart 9). These results represent no change to the expected unemployment rate in 2019 and a very small (0.1 p.p.) upward revision to the expected unemployment rate in 2020. They are in line with those published in other surveys (see Table 1). Longer-term unemployment rate expectations also remained unchanged at 7.5%.
Chart 9
Expectations for the unemployment rate
(percentages of the labour force)
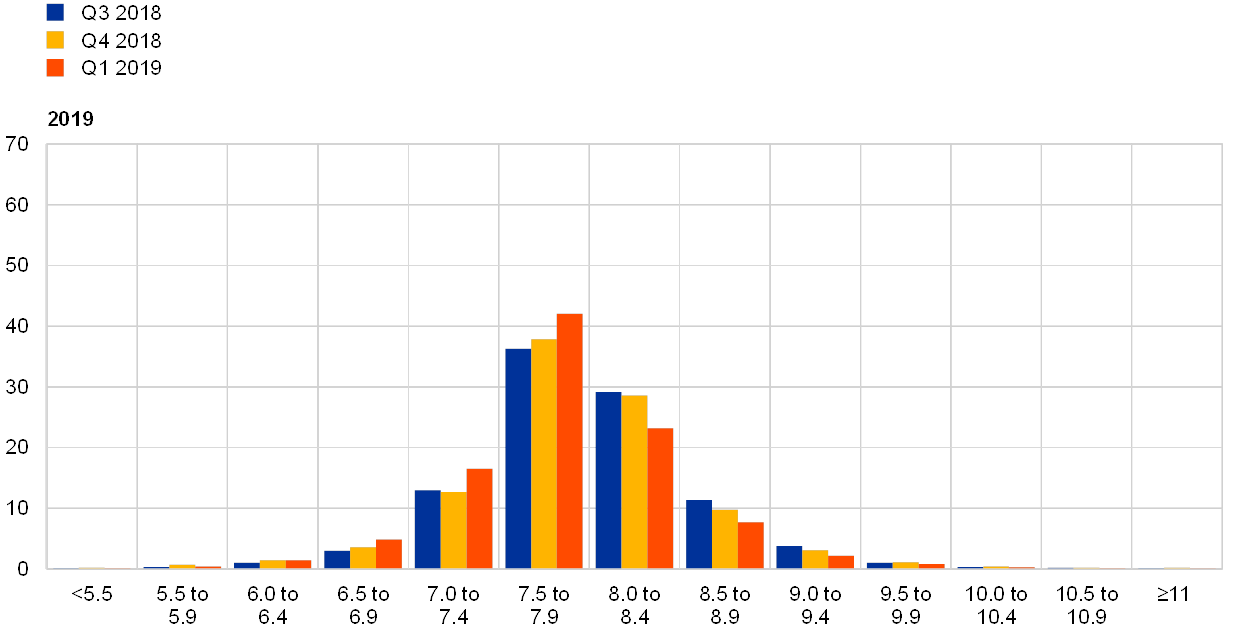
The balance of risks remained to the upside, and longer-term unemployment rate expectations were unusually uncertain. At all horizons, the probability distributions remained skewed towards higher unemployment rate outcomes, indicating that the balance of risks is to the upside (see Chart 10 and Chart 11). As with other variables (across horizons), forecasters’ uncertainty about the unemployment rate in the future, as measured by the width of their probability distributions, has been greater since the financial crisis than it was before. For longer-term unemployment rate expectations, the rise in uncertainty has been particularly marked and, in the latest survey, this measure stood at levels significantly higher than previously seen.
Chart 10
Aggregate probability distributions for the unemployment rate in 2019, 2020 and 2021
(x-axis: unemployment rate expectations, percentages of the labour force; y-axis: probability, percentages)
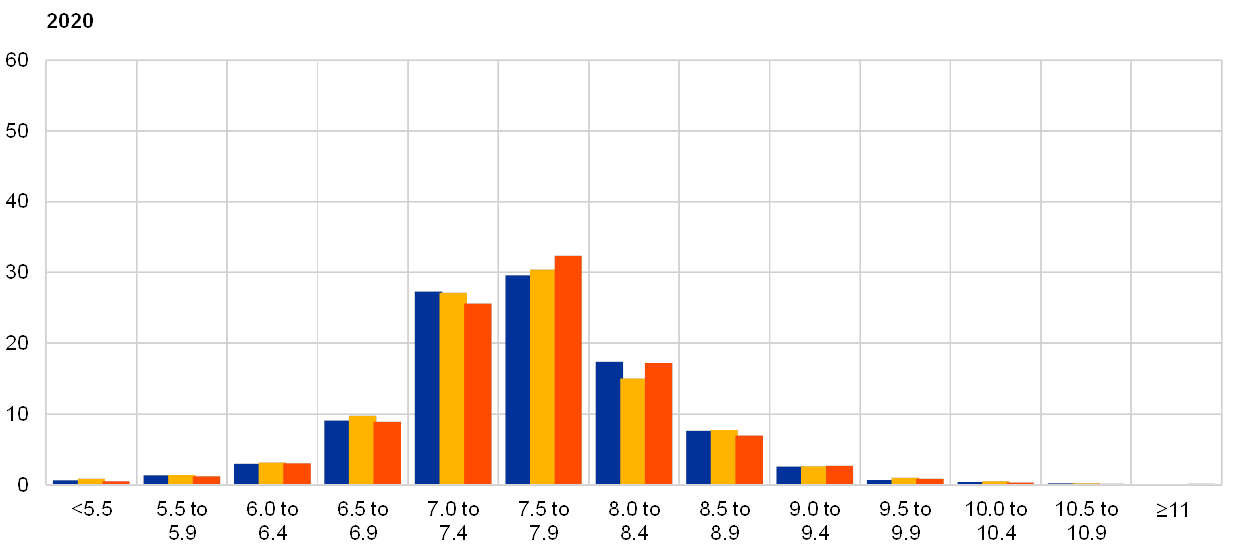

Notes: The SPF asks respondents to report their point forecasts and to separately assign probabilities to different ranges of outcomes. This chart shows the average probabilities they assigned to unemployment rate outcomes for 2019, 2020 and 2021.
Chart 11
Aggregate probability distribution for the unemployment rate in the longer term
(x-axis: unemployment rate expectations, percentages of the labour force; y-axis: probability, percentages)
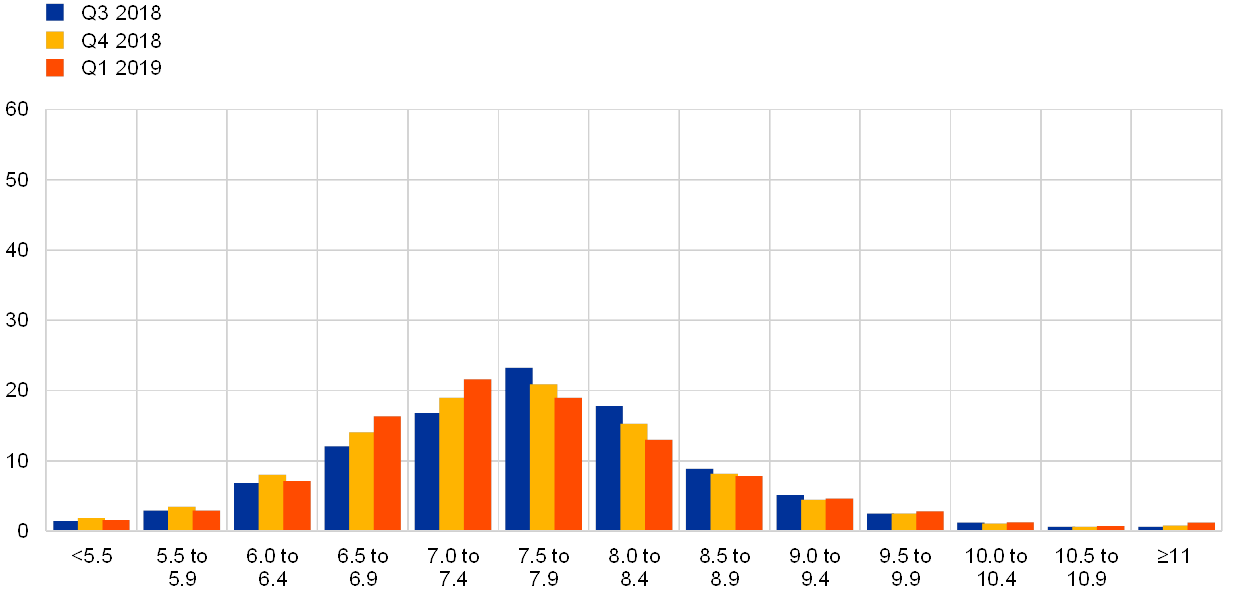
Notes: The SPF asks respondents to report their point forecasts and to separately assign probabilities to different ranges of outcomes. This chart shows the average probabilities they assigned to unemployment rate outcomes in the longer term.
5 Expectations for other variables
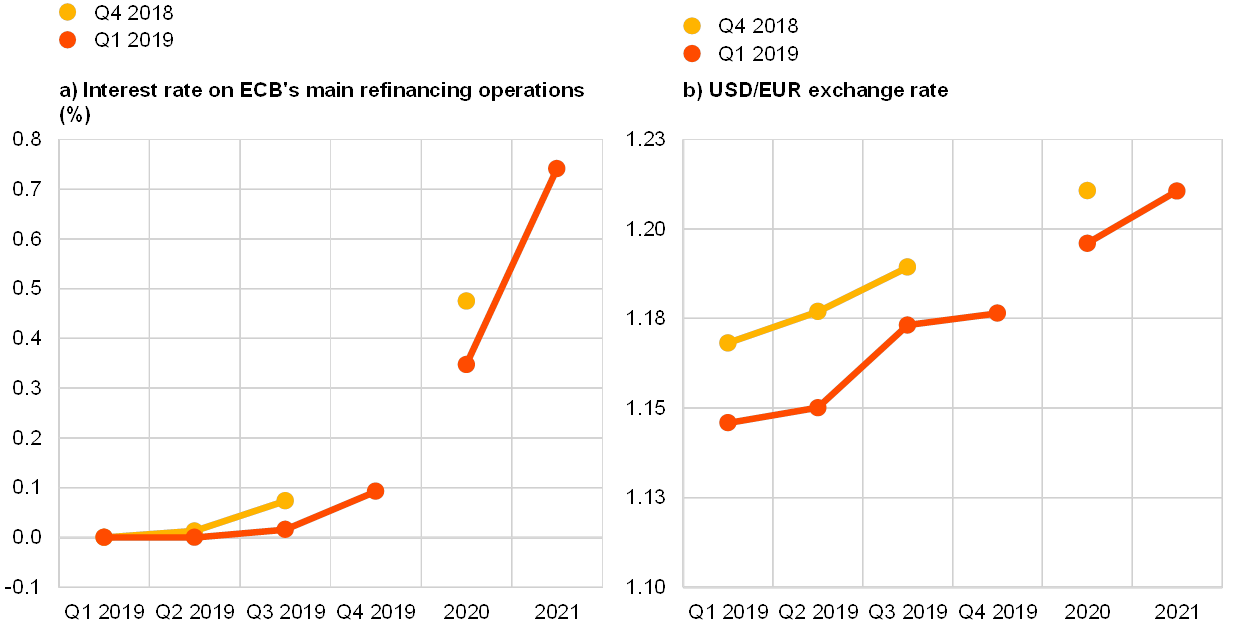
Respondents’ average expectations were for: the ECB’s main refinancing rate to stay at zero until the fourth quarter of 2019; the euro to continue appreciating against the US dollar until 2021; USD oil prices to increase moderately until 2021; and labour cost growth to increase until 2020 and then start to slow.
The mean expectation for the rate on the ECB’s main refinancing operations was for it to remain at 0.0% in the near term, increasing to 0.35% in 2020 and then to 0.74% in 2021 (see panel (a) of Chart 12). Both the aggregate expectation for the near-term quarterly profile and the expected policy rate for 2020 have been revised down compared to the previous survey round.
The average expected USD/EUR exchange rate fell at all horizons, but more so in the nearer term. Thus, relative to that lower starting point, the expected pace of future appreciation has increased for third quarter of 2019, while remaining broadly unchanged at all other horizons (see panel (b) in Chart 12).
US dollar-denominated oil prices (per barrel) were expected to average $63.6 in 2019, $64.3 in 2020 and $66 in 2021. This implies that forecasters expected prices to be between 14.3% and 19.8% lower at all horizons than they had expected in the previous survey (see panel (c) of Chart 12). When combined with expectations of a weaker USD/EUR exchange rate, especially in the near term, these results imply a profile for the oil price in euro that is, on average, around 15% lower than in the previous survey.
On average, annual growth in compensation per employee was expected to be 2.3% in 2019. 2.4% in 2020, and 2.3% in both 2021 and 2023, which is higher at all horizons except the longer term than in the previous survey (see panel (d) of Chart 12).
Chart 12
Expectations for other variables

6 Annex (chart data)
Excel data for all charts can be downloaded here.
© European Central Bank, 2019
Postal address 60640 Frankfurt am Main, Germany
Telephone +49 69 1344 0
Website www.ecb.europa.eu
All rights reserved. Reproduction for educational and non-commercial purposes is permitted provided that the source is acknowledged.
For specific terminology please refer to the ECB glossary (available in English only).
PDF ISSN 2363-3670, QB-BR-19-001-EN-N
HTML ISSN 2363-3670, QB-BR-19-001-EN-Q
- The survey was conducted between 7 and 11 January 2019. The total number of responses was 58. The survey requested information on expectations for the euro area HICP inflation rate (overall and excluding energy, food, alcohol and tobacco), the real GDP growth rate and the unemployment rate for 2019, 2020, 2021 and 2023, as well as for each of these variables one and two years ahead, with respect to the latest available data point. Participants were provided with a common set of the latest available data for annual HICP inflation (December 2018 flash estimates: overall inflation, 1.6%; excluding energy, food, alcohol and tobacco 1.0%), annual GDP growth (Q3 2018, 1.6%) and unemployment (November 2018, 7.9%).
-
24 January 2019