
Survey on the Access to Finance of Enterprises in the euro area - October 2019 to March 2020
Introduction
This report presents the main results of the 22nd round of the Survey on the Access to Finance of Enterprises (SAFE), which was conducted between 2 March and 8 April 2020. Despite the difficulties in conducting the survey owing to the spread of the coronavirus (COVID-19) across Europe and the associated disruption in the business activity of many euro area companies, the euro area sample was collected successfully. The survey covered the period from October 2019 to March 2020. The total euro area sample size was 11,236 enterprises, of which 10,287 (92%) had fewer than 250 employees.[1]
The report provides evidence on changes in the financial situation of enterprises and documents trends in the need for and availability of external finance. It includes results on small and medium-sized enterprises (SMEs), as well as large firms, and examines developments both at the euro area level and in individual countries.
1 Overview of the results
The survey results suggest that SMEs perceive there to have been a rapid deterioration in the economic environment, despite generally accommodative financing conditions. Consequently, a growing number of them considered the macroeconomic outlook to be an impediment to their access to external finance. They also reported that the weakness of their own outlook in terms of sales and profit was starting to weigh on the availability of external funds, leading to a deterioration in firms’ access to external finance despite banks’ increased willingness to provide credit and net declines in bank interest rates. This deterioration was widespread at the sectoral level, but differed significantly across countries.
SMEs’ responses on the expected availability of external finance are useful in gauging the possible impact of the coronavirus pandemic in the immediate future. They show that expectations were falling significantly in the euro area, with the level of deterioration varying across countries as a reflection of the different stages in the spread of the virus and the measures taken by the individual countries to fight the pandemic.
To gain a better understanding of euro area SMEs’ pricing practices, this survey round introduced two additional ad hoc questions: one on the most important factors affecting price-setting and the other on the expected impact of those factors on SMEs’ prices over the next 12 months. Expected demand for their own products and labour costs were the most important factors for euro area SMEs, followed by other input prices, competitors’ prices and market shares. Looking ahead, SMEs expect inflationary pressures to remain subdued.
Latest developments in SAFE country results for SMEs
(over the preceding six months; net percentages of respondents)
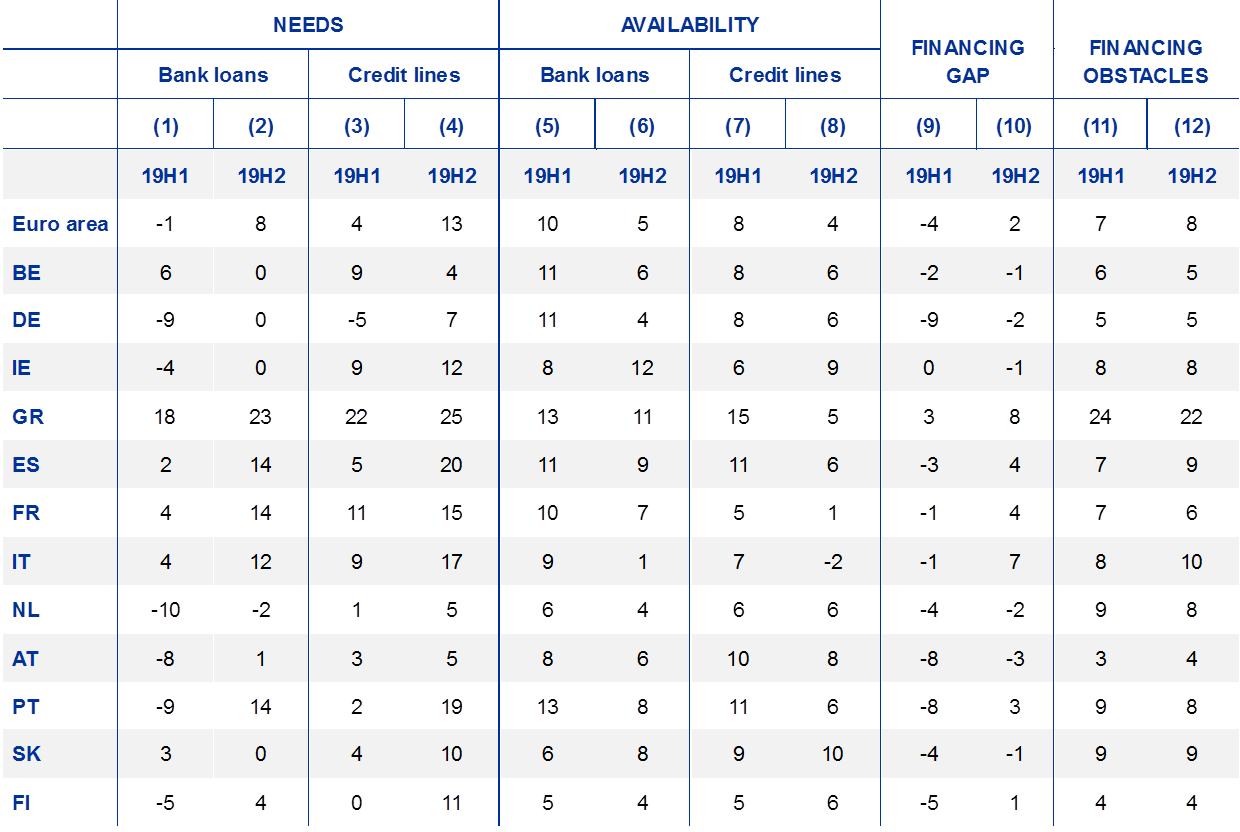
Notes: For “needs”, see Chart 4; for “availability”, see Chart 1 and Chart 4; and for the “financing gap”, see the notes to Chart 5. For “financing obstacles”, see the notes to Chart 8. “19H1” refers to round 21 (April-September 2019) and “19H2” to round 22 (October 2019-March 2020) of the survey.
2 Financial situation and main concerns of SMEs in the euro area
2.1 Signs of a deterioration in the financial situation of euro area SMEs
In the period from October 2019 to March 2020, the financial situation of euro area SMEs remained consistent with expectations of a rapid deterioration in the economic environment, despite generally accommodative financing conditions (see Chart 1). For the first time since the beginning of 2014, euro area SMEs signalled, in net terms[2], a decline in turnover (-2%, from 20%). The deterioration was widespread across countries, but sharper in Italy (-19%, from 7%), Slovakia (-11%, from 11%), Greece (-6%, from 18%) and Spain (-5%, from 15%). By contrast, turnover continued to increase in Austria (16%), as well as Belgium, Ireland and the Netherlands (all 13%), while in France and Germany a much smaller percentage of SMEs indicated, on balance, an increase in turnover (1% and 3% respectively).
Consequently, euro area SMEs reported a sharp deterioration in profits (in net terms -15%, from -1%). The overall decline in profits was particularly strong for SMEs in Italy (-36%, from -16%), Greece (-28%, from -15%), Slovakia (-23%, from -7%) and Spain (-20%, from -7%). At the sectoral level, industry appears to have been the worst hit by the deterioration in profits (-20%, from -7%), notably in Italy (-38%). In the trade sector, a net 19% of euro area SMEs also reported decreasing profits, with the percentages reaching 37% in Italy and 30% in Spain. Higher labour and other costs affected profit developments as euro area SMEs continued to report increases, albeit smaller increases than in the previous survey round (46% for labour costs, from 50%, and 45% for other costs, from 53%).
In this survey round, the net percentage of euro area SMEs reporting an increase in interest expenses (1%) remained unchanged, although there was a rise in the percentage of Italian SMEs (14%, from 9%) and Irish SMEs (16%, from 12%). Euro area SMEs indicated declining debt-to-total assets ratios (-4%, from -7%), except in Italy where they reported increases in leverage (7%, from 1%) (see Chart 16 in Annex 1). The uncertainty surrounding developments in economic growth was instead reflected in more subdued investment and hiring decisions. In net terms, 12% of SMEs reported increases in fixed investments (from 16%), 1% in inventories and working capital (from 7%), and 5% in the number of employees (from 12%).
An encompassing indicator of the financial situation of firms[3] suggests that 4.7% (from 3.1%) of euro area SMEs encountered major difficulties in running their business and servicing their debt and, as a result, might face more difficulties than other firms in accessing finance in the future (see Chart 2). At the other end of the spectrum, the percentage of profitable firms (i.e. those that were more likely to be resilient to financial shocks) declined to 4.3% (from 5.9%) (see Chart 17 in Annex 1 for country results).
Change in turnover and profit of SMEs across euro area countries
(over the preceding six months; net percentages of respondents)
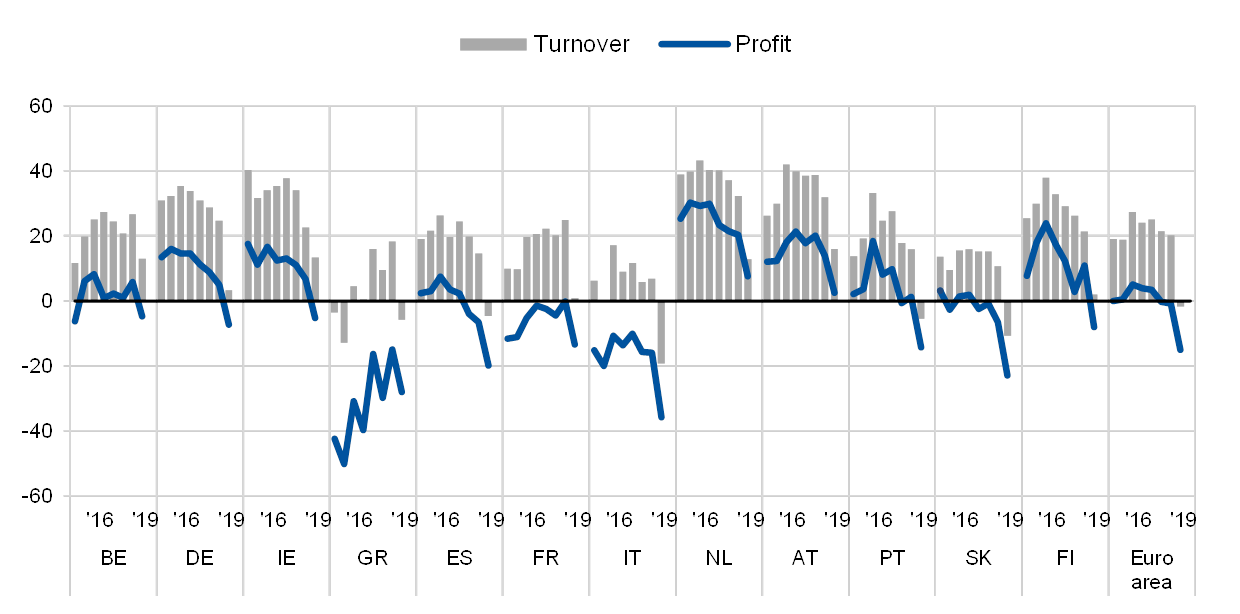
Base: All SMEs. Figures refer to rounds 15 (April-September 2016) to 22 (October 2019-March 2020) of the survey.Note: The net percentage is the difference between the percentage of enterprises reporting an increase for a given factor and the percentage reporting a decrease.
Q2. Have the following company indicators decreased, remained unchanged or increased over the past six months?
Vulnerable and profitable enterprises in the euro area
(percentages of respondents)
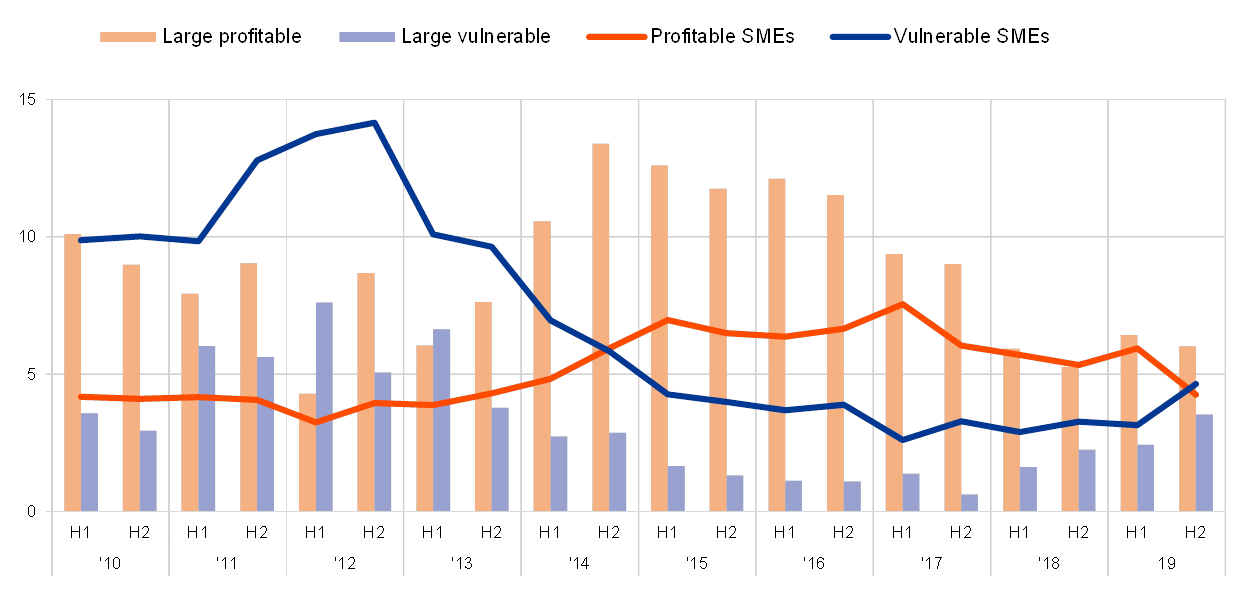
Base: All enterprises. Figures refer to rounds 3 (March-September 2010) to 22 (October 2019-March 2020) of the survey.Note: For definitions, see footnote 3 of this report.
Q2. Have the following company indicators decreased, remained unchanged or increased over the past six months?
Box 1 Ad-hoc questions: Pricing practices of euro area SMEs
To help understand euro area SME’s pricing practices this survey round introduced two additional questions on important factors affecting price setting and on the expected impact of those factors on SME’s prices over the next 12 months. Firms’ pricing behaviour is of obvious interest for monetary policy, and information about SMEs’ pricing practices remains relatively scarce compared to that from larger enterprises.
Firms were first asked to assess the importance of seven factors when setting their selling prices, ranging from demand for the firm’s own product/ services, production, financing and labour costs, to pricing policies of competitors, expected inflation and exchange rate dynamics (see Chart A). Overall, the survey results point to fairly common pricing practices of euro area SMEs regardless of their size, country and sectors. The expected demand for their own product and labour costs are the most important factors for more than 60% of euro area firms, both for large and for SMEs, with only less than 10% considering them as non-important for their pricing. The prices of competitors and market shares, as well as other input prices are also very important for around 50% of the firms.
Chart A
Importance of factors for euro area enterprises when setting prices
(percentages of respondents)

QA1: How important do you expect the following factors to be when setting or changing your selling prices over the next twelve months?
Base: All enterprises. Figures refer to round 22 (October 2019-March 2020) of the survey.
SMEs pay more attention than large firms to both expected inflation (very important for 36% of SMEs, particularly micro firms (38%) and small firms (37%), but only 17% for large firms) and financing costs (31% for SMEs, 34% for micro firms and 32% for small firms, but only 18% for large firms). The foreign exchange rate, however, is viewed as not important by more than 40% of euro area firms, irrespective of their size, which may reflect the strong relevance of the Single Market for euro area companies.
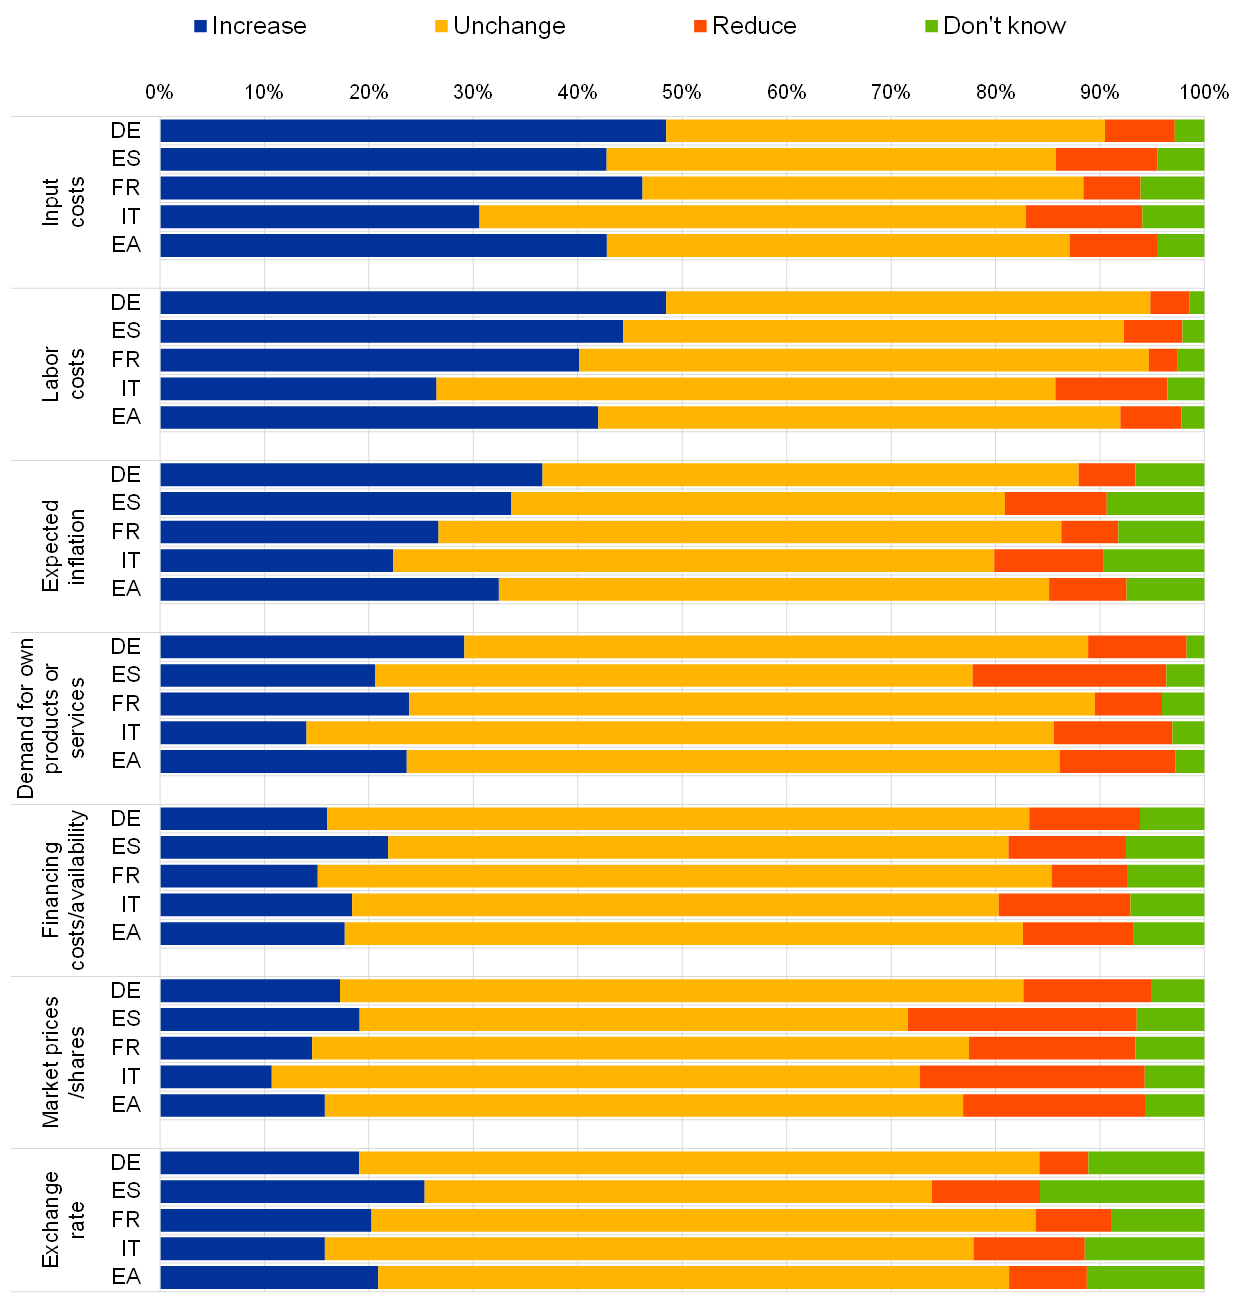
SMEs’ price-setting practices appear to be quite similar across euro area countries (see Chart B), with the differences arising mostly when the factors are assessed as “very” or “moderately” important. Among the largest euro area countries for example, demand for own product and labour costs – and to a lesser extent expected inflation – appear to be more important for SMEs in Germany than for those in other countries. By contrast, Italian SMEs attach greater importance to credit availability and costs, while French SMEs are more often among those that do not view the listed factors as very important for their pricing.[4] Inflationary pressures are expected to remain subdued across the euro area (see Chart C). Both at the large country level and the level of the euro area as a whole, the majority of SMEs generally expect their prices to remain unchanged over the next 12 months owing to the factors discussed above.[5]
Chart B
Very important factors for euro area SMEs when setting prices
(percentages of respondents)
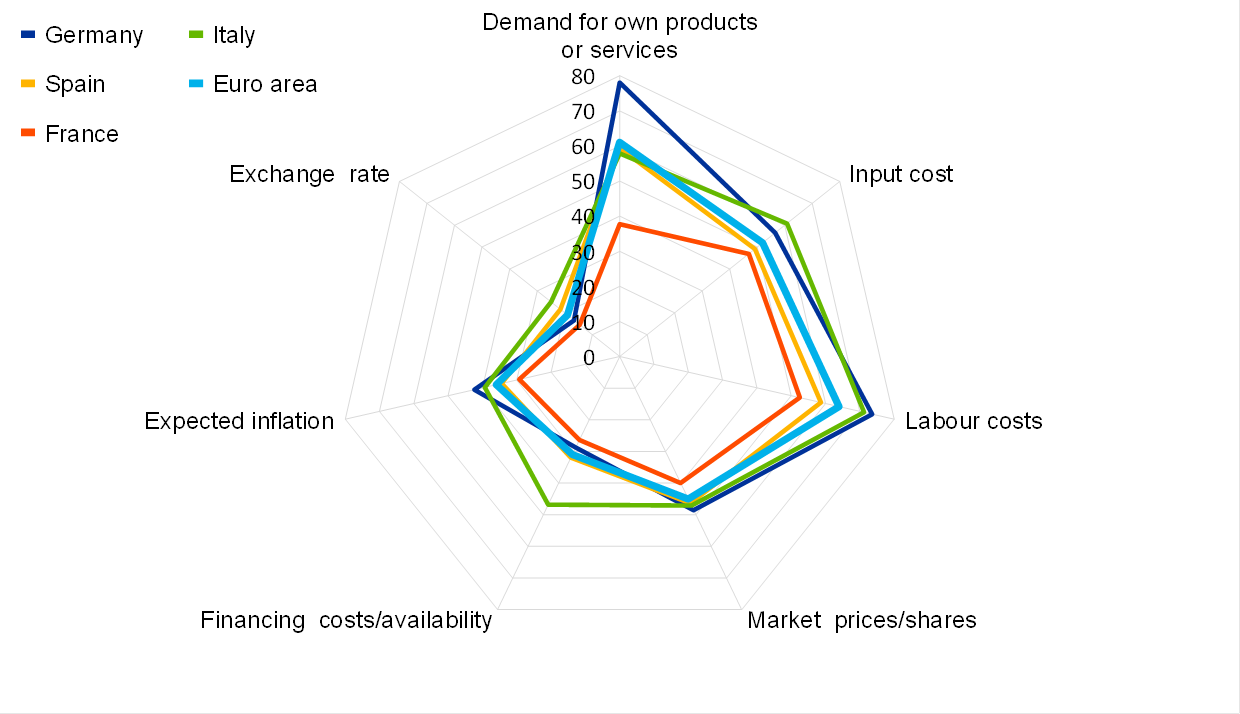
QA1: How important do you expect the following factors to be when setting or changing your selling prices over the next twelve months?
Base: All SMEs. Figures refer to round 22 (October 2019-March 2020) of the survey.
Labour costs and other input costs were expected to be the main sources of upward pressure on SMEs’ prices. Among the largest euro area economies, potential price increases as a result of those two factors were reported by a higher percentage of firms in Germany (48% for both), Spain (44% and 43% respectively) and France (46% for input costs) than in the euro area as a whole (42% and 43% respectively).[6] By contrast, Italian SMEs reported significantly lower expected increases for those two cost factors (26% and 31% respectively).
Chart C
Expected impact of factors on euro area SMEs’ pricing
(percentages of respondents)
QA2: How will each factor affect your selling prices over the next twelve months?
Base: All SMEs that assessed the factor as “very” or “moderately” important. Figures refer to round 22 (October 2019-March 2020) of the survey.
Downward price pressures are more limited and perceived to stem mainly from competitors’ prices and market shares (for 17% of euro area SMEs) and financing costs (11%). The downward pressure from competitors’ prices is particularly noteworthy because it may amplify downward adjustments in SMEs’ prices. Italy and Spain (with 22% of firms reporting the impact as a reduction in prices), as well as some other countries[7], seem to be particularly vulnerable in this regard. In addition, downward pressure from expected inflation in Italy (10%) and Spain (10%), although limited, was perceived to be somewhat stronger than in the euro area as a whole (7%). Overall, the survey results for large companies also suggest subdued price pressures in the euro area over the coming months, as well as in the largest euro area countries, in particular Italy.
2.2 Main concerns for euro area SMEs
Availability of skilled labour continues to be the main concern for euro area SMEs, together with the difficulty in finding customers (see Chart 3). In this survey round, availability of skilled labour was the main concern for euro area SMEs (24%, down from 28% in the previous round), together with the difficulty in finding customers (21%, from 22%). Cost of production, regulation and competition were all mostly unchanged at 12%, while access to finance remained the least important obstacle (8%, from 7%). Only Greek SMEs continued to be highly affected by the lack of access to finance during the period covered by the survey, with 19% mentioning it as their most important problem (down from 21% in the previous round), followed by Italian SMEs (10%, from 9%).
The most important problems faced by euro area SMEs across euro area countries
(over the preceding six months; percentages of respondents)

Base: All SMEs. Figures refer to rounds 15 (April 2016- September 2016) to 22 (October 2019-March 2020) of the survey.Notes: The formulation of the question has changed over the survey rounds. Initially, respondents were asked to select one of the categories as the most pressing problem. Since round 8, all respondents have been asked to indicate how pressing a specific problem is on a scale of 1 (not pressing) to 10 (extremely pressing). In round 7, the formulation of the question followed the initial phrasing for one-half of the sample and the new phrasing for the other half. In addition, if two or more items had the highest score in question Q0B on “how pressing the problems were, a follow-up question (Q0C) was asked to resolve this, i.e. which of the problems was more pressing, even if only by a small margin. This follow-up question was deleted from the questionnaire in round 11. The past results from round 7 onwards were also recalculated, disregarding the replies to question Q0C. In round 12, the word “pressing” was replaced by the word “important”.
Q0. How important have the following problems been for your enterprise in the past six months?
3 SMEs’ financing needs and availability of external finance
3.1 Demand for external finance continued to vary among euro area SMEs
In the period from October 2019 to March 2020, demand for banking instruments among SMEs increased sharply. In net terms, euro area SMEs reported an increase in demand for bank loans (8%, from -1%; see Chart 4 and Table 1, column 2). The survey results continued to reveal significant cross-country heterogeneity, with the need for loans rising sharply, particularly in Spain, France and Portugal (all 14%), as well as Italy (12%), and remaining high for Greek SMEs (23%). At the same time, euro area SMEs indicated a growing need for credit lines (13%, from 4%; see Table 1, column 4), which was strongest in Greece (25%), followed by Spain (20%).
Finance from external and internal sources continued to be used mainly for fixed investment (43%, from 42%) and for inventories and working capital (35%, from 34%). In addition, SMEs used finance to hire and train new employees (20%, from 22%), as well as to develop and launch new products (20%, unchanged).
The net percentage of SMEs reporting an improvement in the availability of bank loans remained positive, but declined to 5% (from 10%) (see Table 1, column 6, and Chart 4). Across countries, the highest percentages of increasing availability were recorded in Greece and Ireland (11% and 12% respectively). Euro area SMEs also indicated, on balance, an improvement in the availability of credit lines (4%, from 8%), trade credit (3%, from 9%) and leasing or hire-purchase agreements (12%, from 15%).
Change in the availability of and need for bank loans for SMEs across euro area countries
(over the preceding six months; net percentages of respondents)
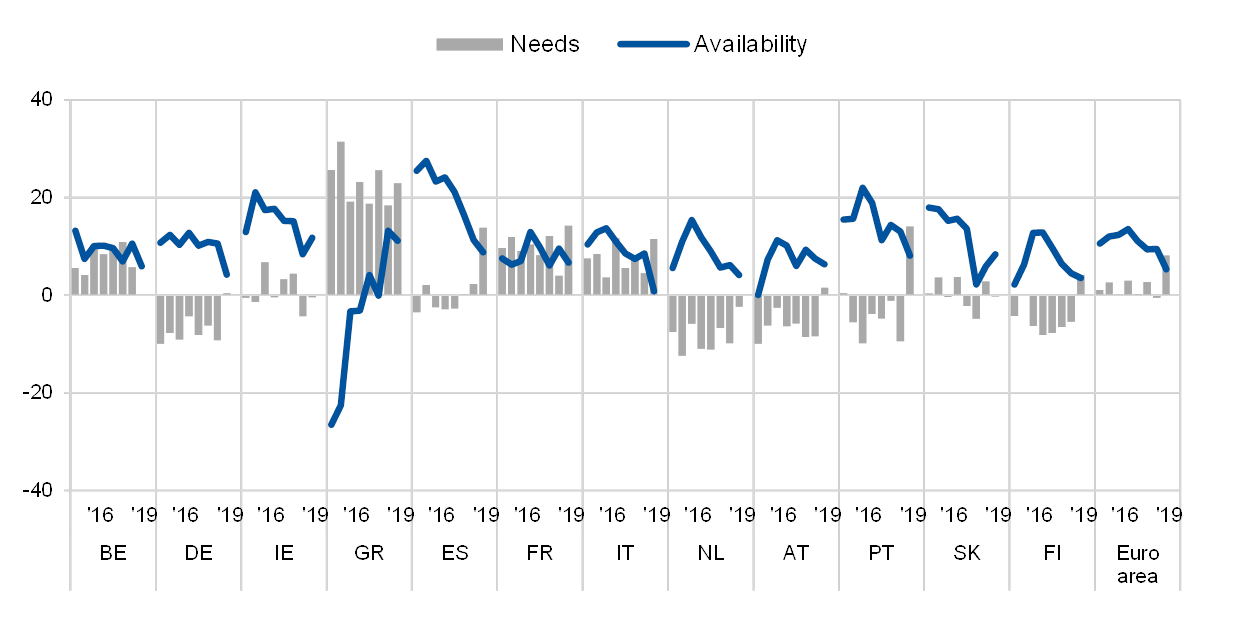
Base: SMEs for which the respective instrument is relevant. Figures refer to rounds 15 (April 2016-September 2016) to 22 (October 2019-March 2020) of the survey.Notes: See the note to Chart 1. A financing instrument is “relevant” if the enterprise has either used the instrument in the past six months or has not used it but has experience of it (for rounds 1 to 10). Since round 11, the respondents have been asked whether the instrument is relevant, i.e. whether the enterprise has used it in the past or considered using it in the future. Given that the current concept of a “relevant” financing instrument differs from that used in the past, this might have an impact on comparability over time for the subsequent questions. Caution should therefore be exercised when comparing the recent results with those of previous rounds.
Q5. For each of the following types of external financing, please indicate if your needs increased, remained unchanged or decreased over the past six months.Q9. For each of the following types of financing, would you say that their availability has improved, remained unchanged or deteriorated for your enterprise over the past six months?
Demand for external funding rose more rapidly than availability. The SMEs’ external financing gap, i.e. the difference between the change in demand for and the change in the availability of external finance – turned positive[8] at the euro area level (2%, from -4%) for the first time since March 2015 (see Chart 5 and Table 1, column 10).
Change in the external financing gap perceived by SMEs across euro area countries
(over the preceding six months; weighted net balances)
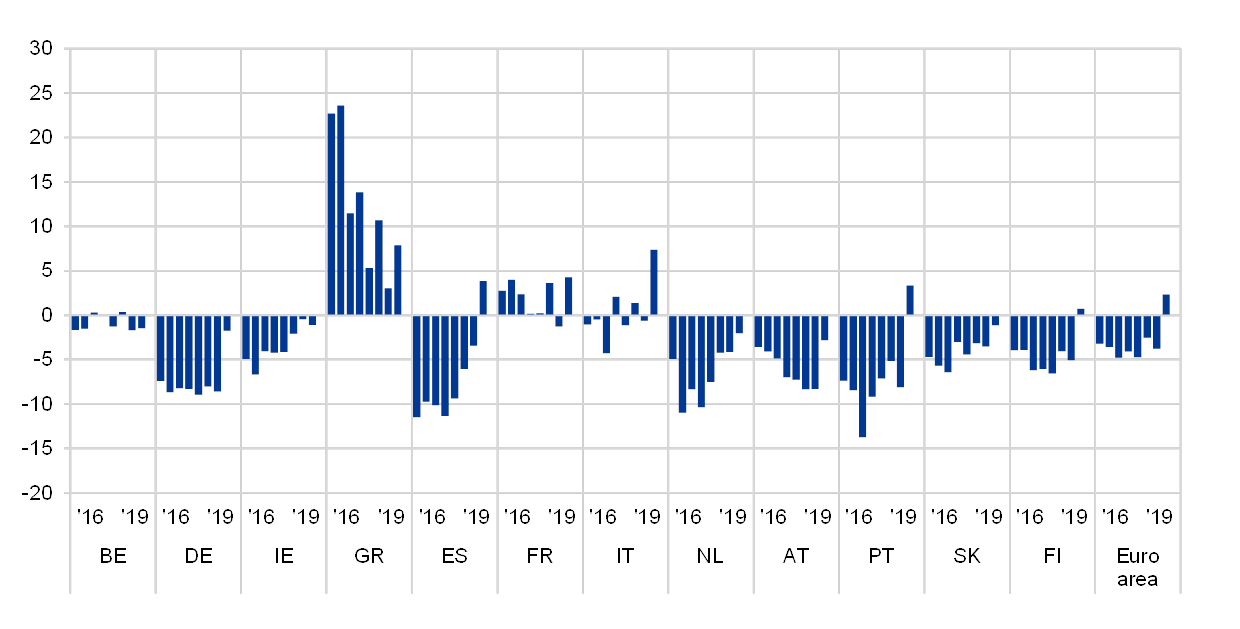
Base: SMEs for which the respective instrument is relevant. “Not applicable” and “Don’t know” answers are excluded. Figures refer to rounds 15 (April 2016- September 2016) to 22 (October 2019-March 2020) of the survey.Notes: See the notes to Chart 4. The financing gap indicator combines both financing needs and availability of bank loans, credit lines, trade credit, equity and debt securities at the firm level. For each of the five financing instruments, the indicator of the perceived change in the financing gap takes the value of 1 (-1) if the need increases (decreases) and availability decreases (increases). If enterprises perceive only a one-sided increase (decrease) in the financing gap, the variable is assigned a value of 0.5 (-0.5). The composite indicator is the weighted average of the financing gap related to the five instruments. A positive value of the indicator suggests an increasing financing gap. Values are multiplied by 100 to obtain weighted net balances in percentages.
Q5. For each of the following types of external financing, please indicate if your needs increased, remained unchanged or decreased over the past six months.Q9. For each of the following types of financing, would you say that their availability has improved, remained unchanged or deteriorated for your enterprise over the past six months?
4 Factors affecting availability of external finance
4.1 SMEs indicated growing concerns in relation to their financial conditions and macroeconomic factors affecting their access to external finance
For the first time since September 2014, euro area SMEs reported weakness in their financial situations as a factor impeding access to finance (see Chart 6). SMEs considered the deterioration in their turnover and profits as an impediment to obtaining external finance (-18%, from 5%). A similar strong negative perception was also seen in terms of the net percentages recorded in March 2013. The negative perception was stronger for Italian and Spanish SMEs (both -24%, from 3% and -2% respectively), as well as for Portuguese SMEs (-22%, from 11%).
Regarding the willingness of banks to provide credit, a net 11% of SMEs reported an improvement (albeit a smaller one than in the previous round, 14%). The highest percentage was in Slovakia (17%), while the lowest was in Italy (4%). At the same time, euro area SMEs continued to report improvements in their credit history (11%, from 17%), capital position (5%, from 18%), though for the latter there was a clear deterioration in Italy (-6%) and in Greece (-8%).
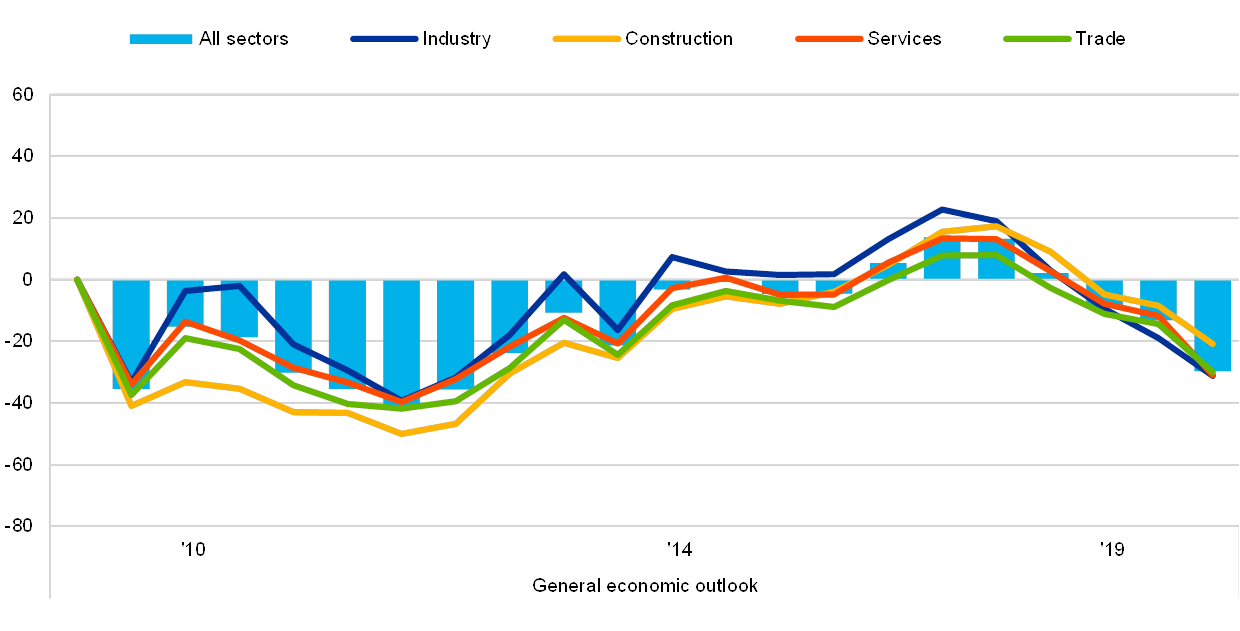
The rising macroeconomic uncertainty was reported as having a stronger negative impact on the availability of external finance than in the previous survey round. SMEs perceived developments in the general economic outlook to have negatively affected access to finance (-30%, from -13%), a percentage not seen since March 2013. The deterioration was widespread across countries, but stronger in Finland (-44%, from -24%), Italy (-36%, from -16%) and Germany (-34%, from -15%).
The deterioration in the general economic outlook was also widespread across sectors, but with strong country specificities (see Chart 7). In the industry sector, the net percentage for the euro area as a whole was -31%, with a peak, among the largest euro area countries, of -38% in Germany. In the construction sector, it was -21% for the euro area, but as sharp as -37% in Italy and -33% in Spain. In the services sector, it was -31% for the euro area, but -37% in Italy and Germany, and in the trade sector, it was -30% for the euro area, but hit -40% in Italy.
Change in factors affecting the availability of external finance for SMEs across euro area countries
(over the preceding six months; net percentages of respondents)
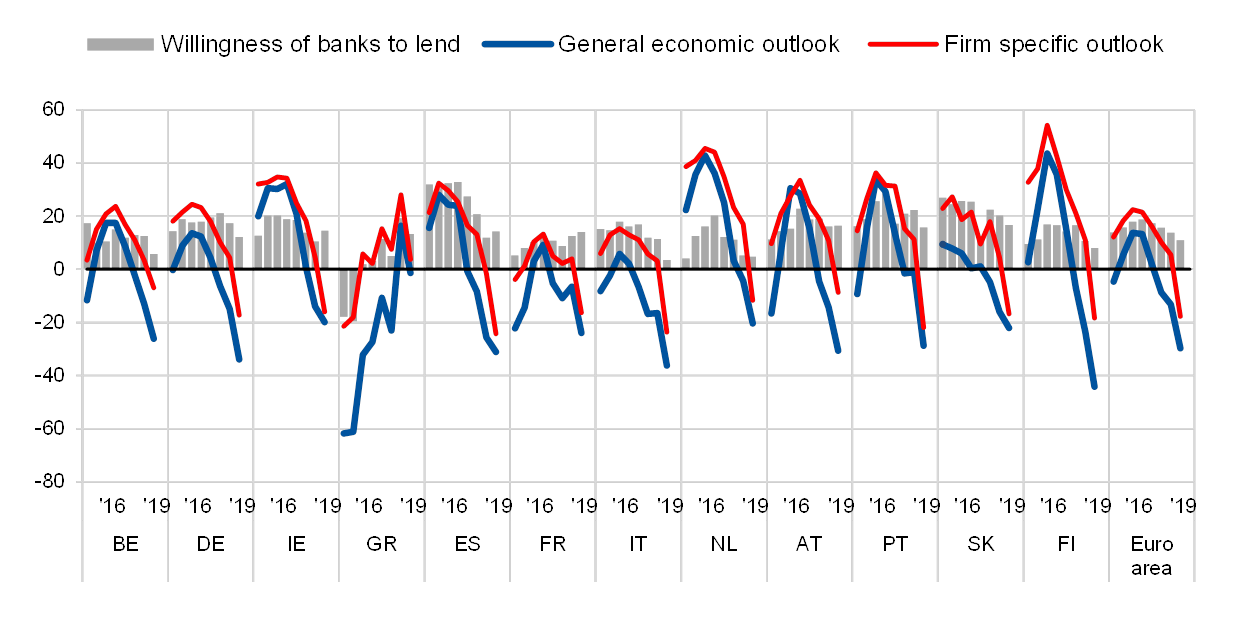
Base: All SMEs. For the category “Willingness of banks to lend”, SMEs for which at least one bank financing instrument (credit line, bank overdraft, credit card overdraft, bank loan or subsidised bank loan) is relevant. Figures refer to rounds 15 (April 2016-September 2016) to 22 (October 2019-March 2020) of the survey.Note: See the notes to Chart 1 and Chart 4.
Q11. For each of the following factors, would you say that they have improved, remained unchanged or deteriorated over the past six months?
Change in the general economic outlook affecting the availability of external finance for euro area SMEs across the main sectors
(over the preceding six months; net percentages of respondents)
Base: All SMEs. Figures refer to rounds 1 (March-September 2009) to 22 (October 2019-March 2020) of the survey.Note: See the note to Chart 1.
Q11. For each of the following factors, would you say that they have improved, remained unchanged or deteriorated over the past six months?
4.2 No significant changes in financing obstacles for SMEs during the period October 2019 to March 2020
The overall indicator of financing obstacles to SMEs in obtaining bank loans increased slightly to 8%, from 7% (see Chart 8 and the last column of the Table 1). This structural indicator is broadly based on the percentage of rejected loan applications and on the percentage of discouraged firms. In this survey round, 29% of SMEs had applied for a loan (from 26%), with 67% (from 72%) of loan applications being successful and only 5% (from 6%) being rejected. The percentage of firms that needed finance but did not ask for it through fear of rejection was 4% (unchanged). While the percentage of SMEs reporting difficulties in obtaining bank loans fell in most countries, it remained relatively high in Greece (22%) and Italy (10%).
Obstacles to obtaining a bank loan for SMEs across euro area countries
(over the preceding six months; percentages of respondents)
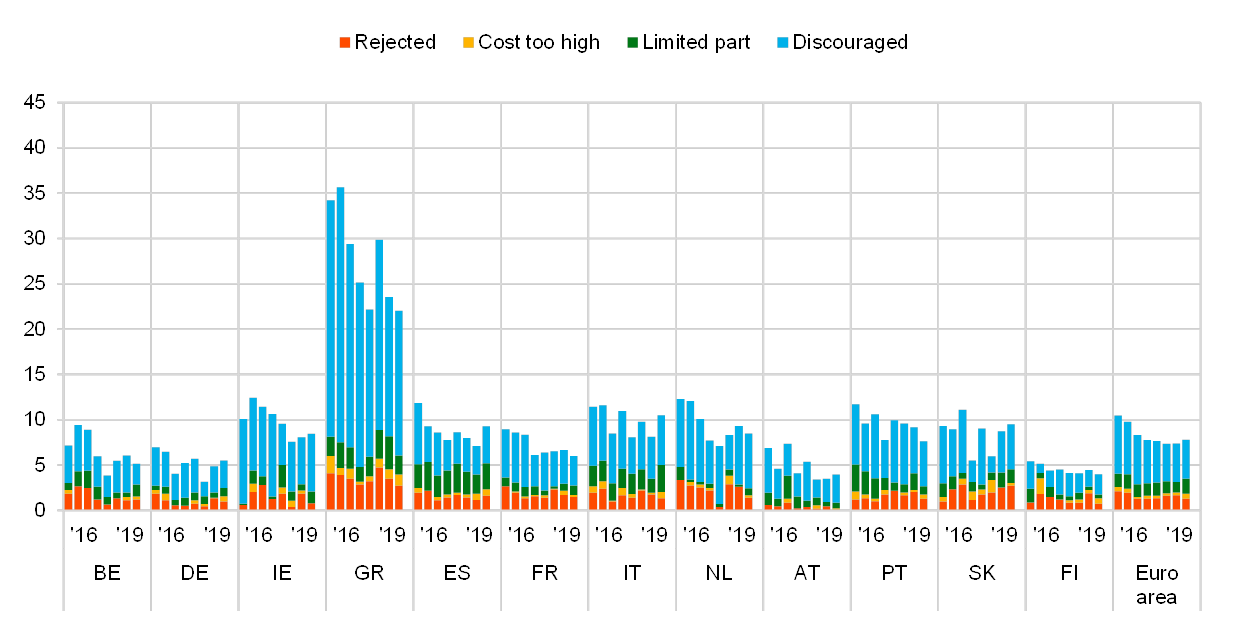
Base: Enterprises for which bank loans (including subsided bank loans) are relevant. Figures refer to rounds 15 (April 2016- September 2016) to 22 (October 2019-March 2020) of the survey.Notes: Financing obstacles are defined here as the total of the percentages of enterprises reporting loan applications that were rejected, loan applications for which only a limited amount was granted, loan applications which resulted in an offer that was declined by the enterprises because the borrowing costs were too high, and enterprises that did not apply for a loan through fear of rejection (discouraged borrowers). The calculation of the indicator started in 2010, when the question on applications for credit lines was first included in the questionnaire. The components of the financing obstacles indicator were affected by the amendments to the questionnaire in round 11 (filtering based on the relevance of the financing instrument and addition of the new category “My application is still pending”), and past data have been revised accordingly. The figures include the categories “My application is still pending” and “Don’t know”.
4.3 Interest rates decline while other costs of financing continue to increase
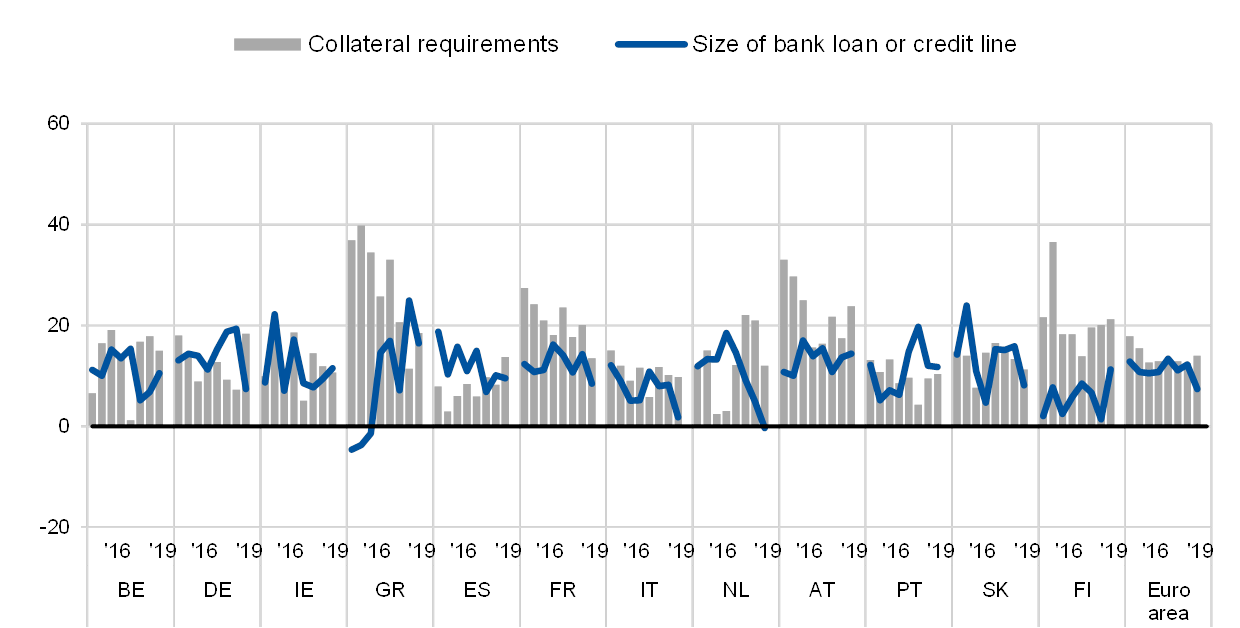
In this survey round, a net percentage of SMEs reported declines in interest rates on bank loans (-10%, from -9%) in the euro area as a whole, although SMEs in Italy (3%) reported higher interest rates and Ireland no changes (0%) (see Chart 9). At the same time, 31% (from 29%) of SMEs signalled higher levels of other costs of financing, such as charges, fees and commissions. As for non-price terms and conditions, SMEs reported increases not only in the size of loans available (7%) and maturity (2%), but also in additional requirements such as collateral (14%) and other requirements (guarantees, procedures, loan covenants, 17%) (see Chart 20 in Annex 1).
Change in the cost of bank financing for SMEs across euro area countries
(over the preceding six months; net percentages of respondents that applied for bank loans)
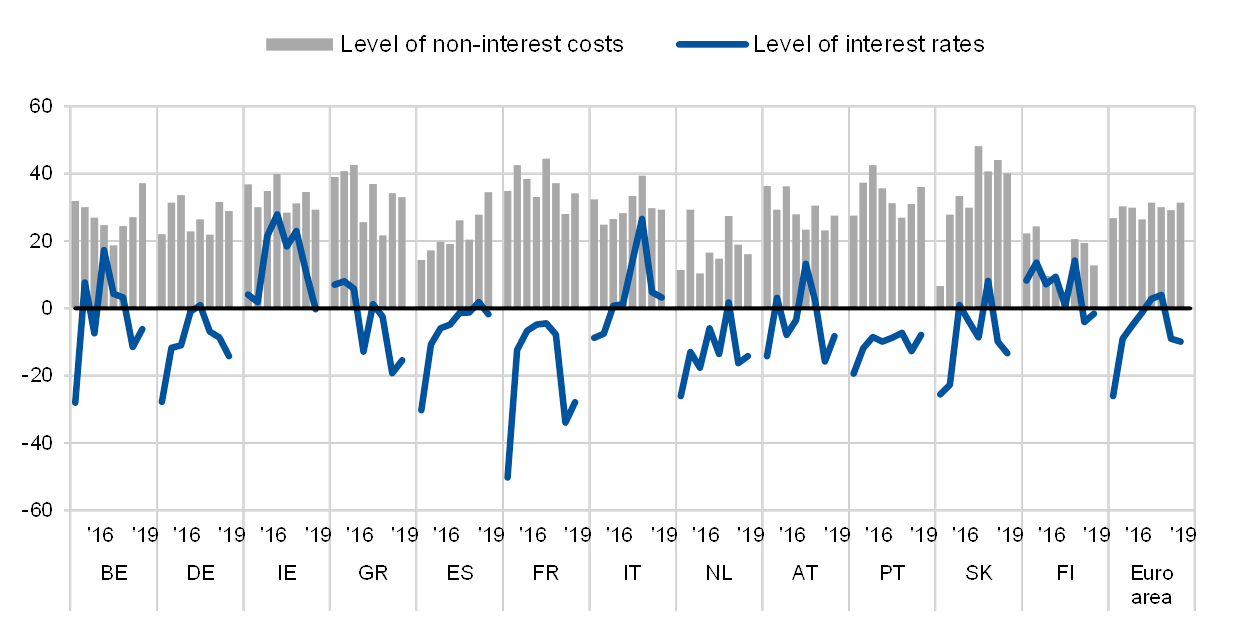
Base: SMEs that had applied for bank loans (including subsidised bank loans), credit lines, or bank or credit card overdrafts. Figures refer to rounds 15 (April 2016- September 2016) to 22 (October 2019-March 2020) of the survey.Note: See the note to Chart 1.
Q10. Please indicate whether the following items increased, remained unchanged or decreased in the past six months.
5 Expectations regarding access to finance
5.1 SMEs expect a sharp deterioration in access to bank loans
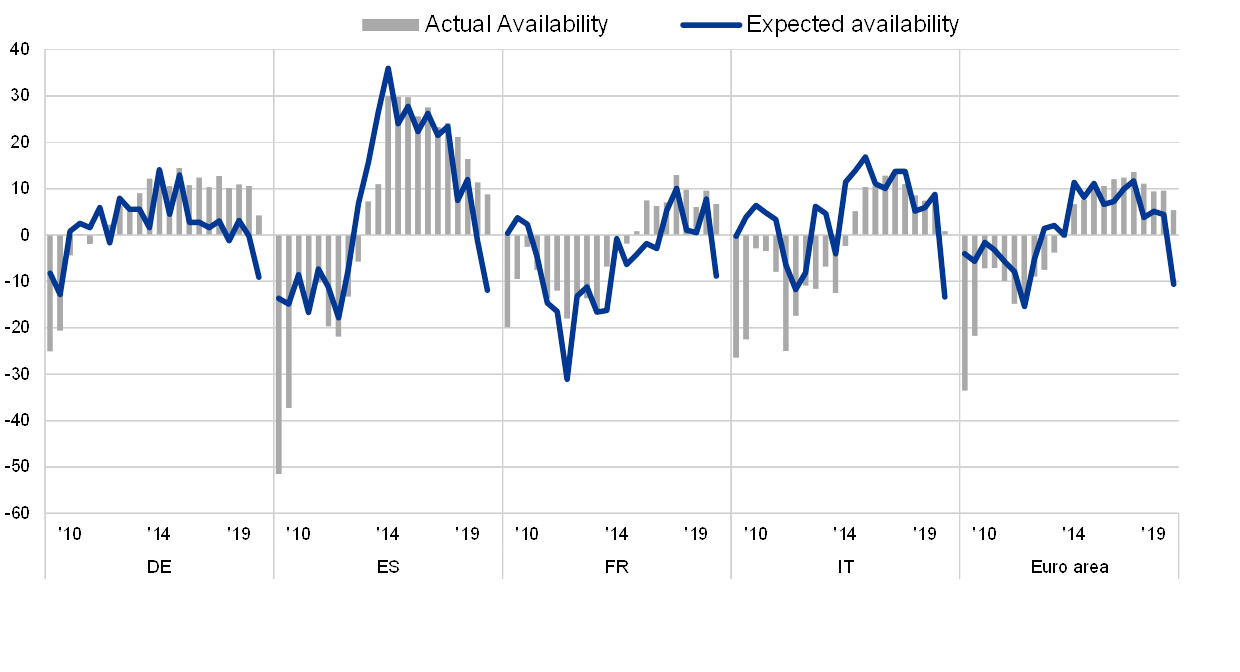
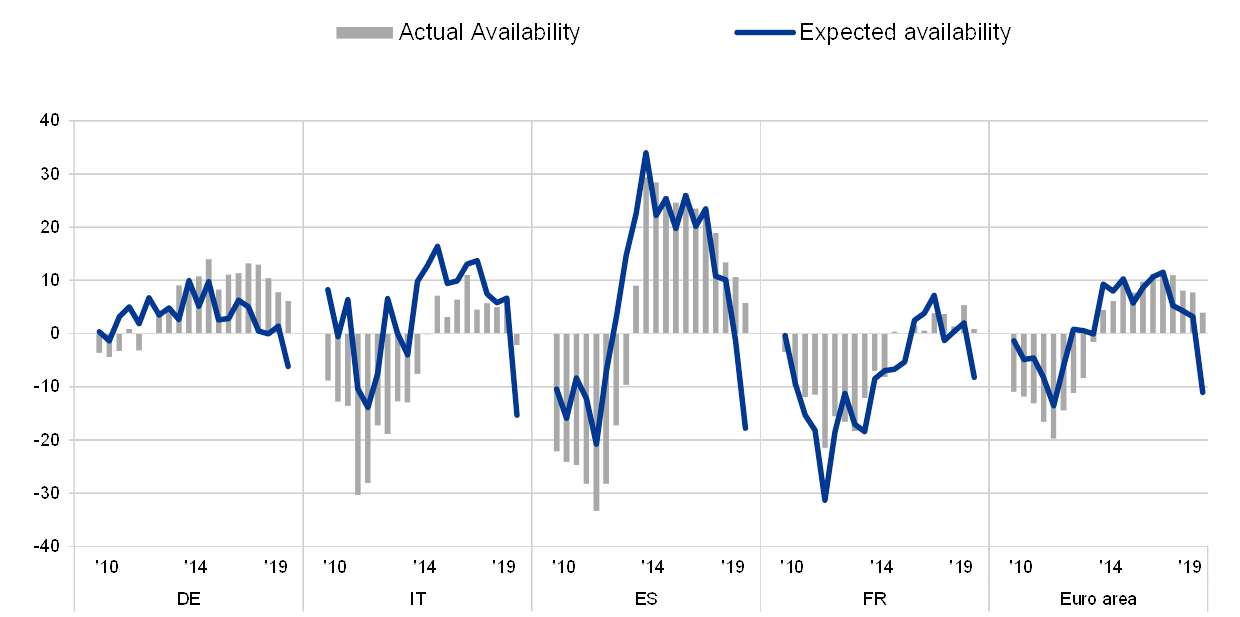
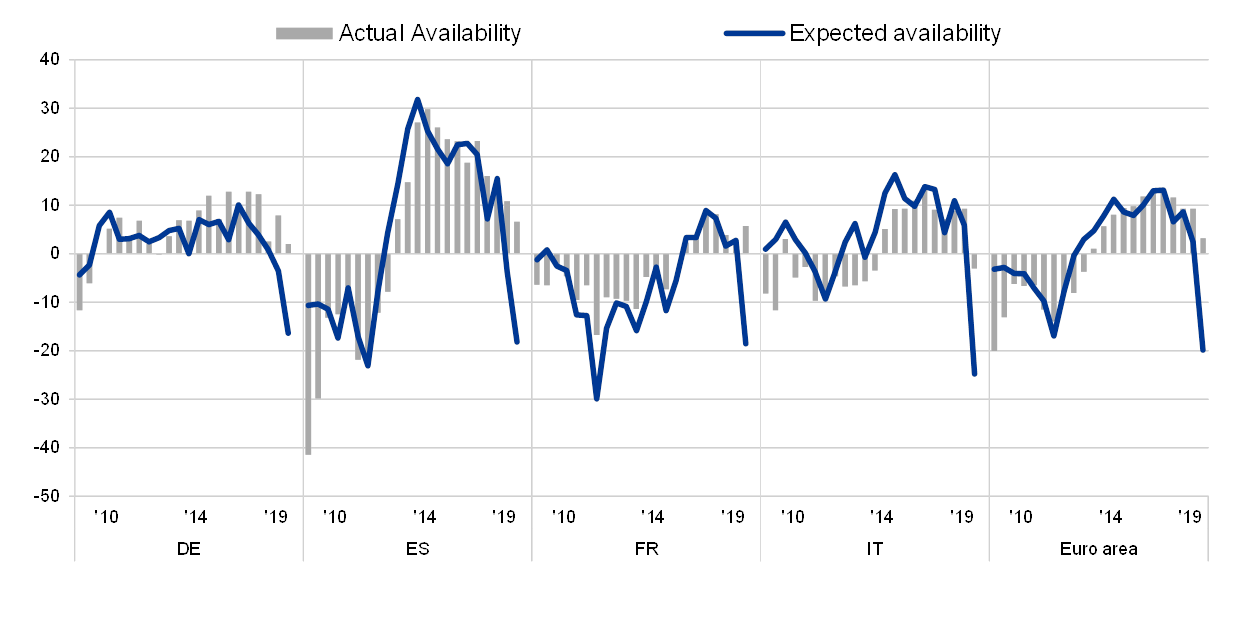
For the first time since March 2013, SMEs reported, in net terms, a decline in the expected availability of bank loans (-11%, from 4% in the previous round) (see Chart 10). Overall, the decline is not yet comparable with the one that occurred at the trough of the sovereign debt crisis (April to September 2012) when 15% of SMEs reported a deterioration in expected availability.
The results of the survey show that expectations were falling significantly in the euro area, with the level of deterioration varying across countries. In line with the fact Italy is at a more advanced stage of the coronavirus pandemic, Italian SMEs have reported the largest deterioration (-13%, from 9%) so far (compared with -12% in 2012). French and Spanish SMEs also signalled a deterioration (-9% and -12%, from 8% and -1% respectively), though this is less acute than that recorded in 2012 (-31% of French and -18% of Spanish SMEs). For German SMEs, the deterioration in this survey round was -9% (down from 0%), which is much worse than in 2012 (-2%).
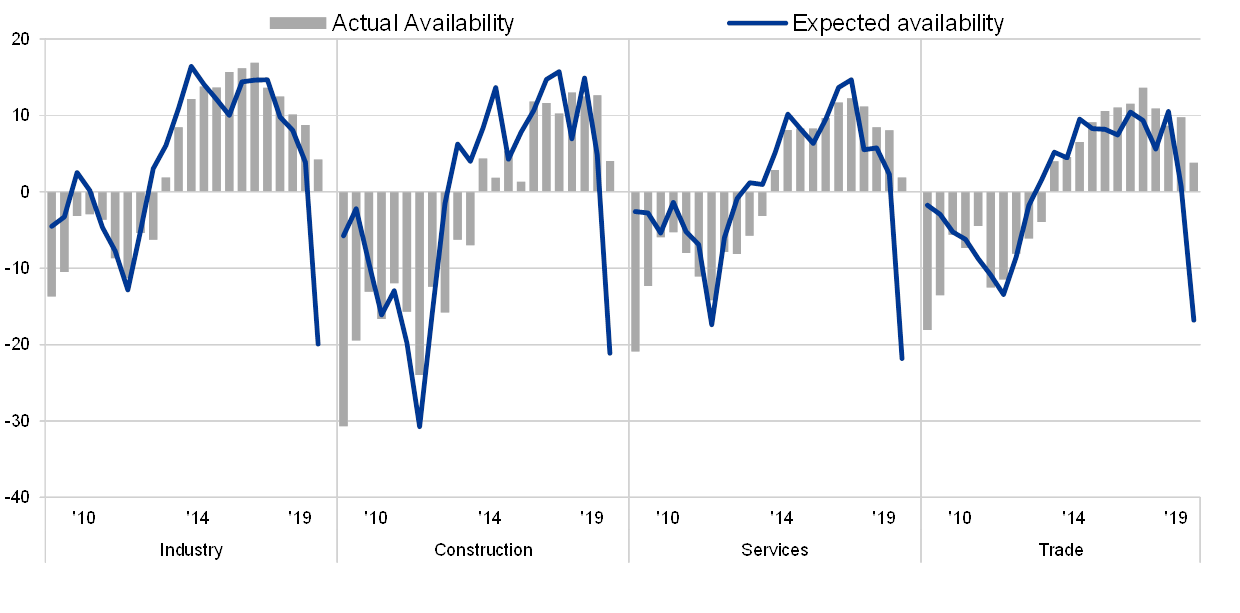
The decline in SMEs’ expectations is widespread across sectors (see Chart 11). In net terms, firms in the construction sector (-12%, from 1%) and the services sector (-13%, from 5%) appear to be somewhat more pessimistic about the change in conditions than those in the trade sector (-9%, from 5%) and the industry sector (-7%, from 3%), possibly reflecting the more severe impact of the lockdown measures. Within countries, Italian SMEs reported larger declines in expectations across all sectors compared with the euro area averages, notably in the construction and services sectors (-16%, both), as well as the industry sector (-11%) and the trade sector (-10%). For Spanish SMEs the deterioration was sharper in the construction (-17%), services (-14%) and trade (-11%) sectors, while in France, SMEs in the trade sector were more pessimistic than their euro area counterparts (-12%).
Change in the actual and expected availability of bank loans for SMEs across countries
(over the preceding six months and over the next six months; net percentages of respondents)
Base: SMEs for which the respective instrument is relevant. Figures refer to rounds 1 (April-September 2009) to 22 (October- March 2020) of the survey.Note: See the notes to Chart 1 and Chart 4.
Q9. For each of the following types of financing, would you say that their availability has improved, remained unchanged or deteriorated for your enterprise over the past six months?Q23. Looking ahead, for each of the following types of financing available to your enterprise, please indicate whether you think their availability will improve, deteriorate or remain unchanged over the next six months.
Change in the actual and expected availability of bank loans for SMEs across sectors
(over the preceding six months and over the next six months; net percentages of respondents)
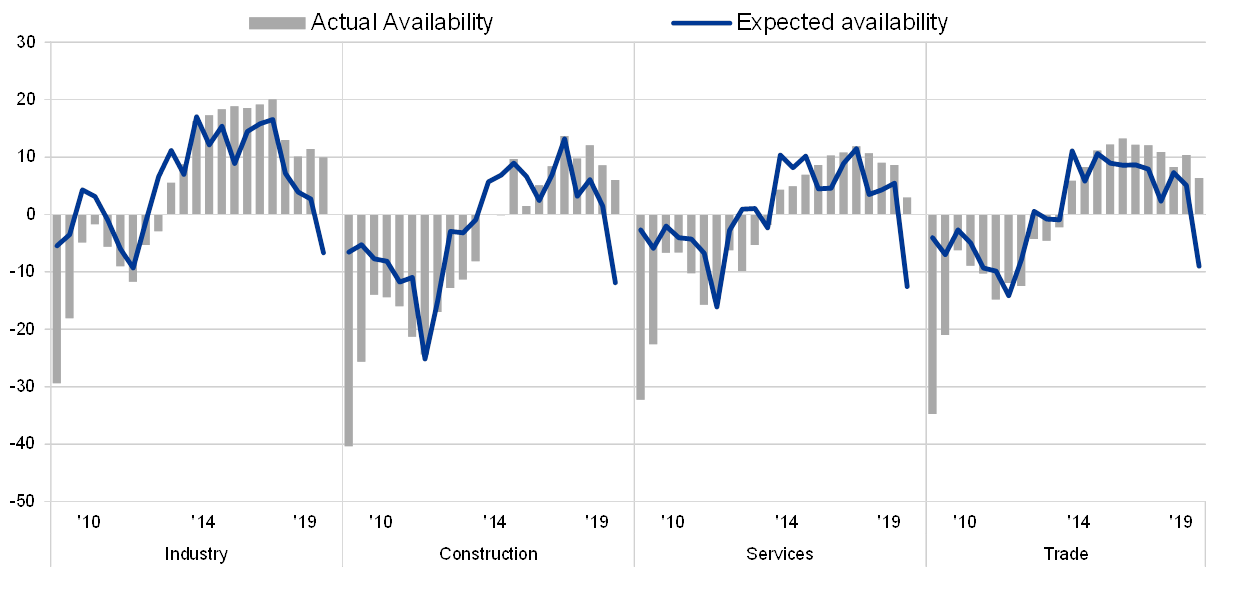
Base: SMEs for which the respective instrument is relevant. Figures refer to rounds 1 (April-September 2009) to 22 (October- March 2020) of the survey.Note: See the notes to Chart 1 and Chart 4.
Q9. For each of the following types of financing, would you say that their availability has improved, remained unchanged or deteriorated for your enterprise over the past six months?Q23. Looking ahead, for each of the following types of financing available to your enterprise, please indicate whether you think their availability will improve, deteriorate or remain unchanged over the next six months.
5.2 Availability of credit lines and bank overdrafts is expected to decrease in the future
SMEs reported, on balance, an expected deterioration in the availability of credit lines/bank overdrafts over the next six months (-11%, from 3%) (see Chart 12). One of the major problems for SMEs during the coronavirus pandemic has been liquidity provisions for working capital and for payments of short-term commitments. Credit lines and bank overdrafts are the short-term instruments that SMEs can easily use to face the associated challenges. In Italy, SMEs were more pessimistic about the availability of credit lines (-2%) over the last six months and expect a further deterioration over the next six months (-15%). In the other large countries, while availability increased over the last six months – in Germany and Spain by 6% and in France by 1% – SMEs also reported a deterioration in expectations (-6% in Germany, -8% in France and -18% in Spain).
In the case of credit lines, the reported deterioration in future availability has so far been less acute than in the previous crises, but is not far off. Back in 2012 higher percentages of SMEs reported a deterioration in the future availability in the euro area (-14%) and across the major countries.
A deterioration in the expected availability of bank overdrafts was reported across all economic sectors (see Chart 13). On balance, the decline in expectations among euro area SMEs in the services sector (-13%, from 3%) was somewhat sharper than that in those in the other sectors (-8% from 4% for industry, -9% from 0% for construction and -10% from 3% for trade). Moreover, these declines followed a downward correction in firms’ expectations about bank overdrafts across all sectors in the last several survey rounds
Change in the actual and expected availability of bank overdrafts for SMEs across countries
(over the preceding six months and over the next six months; net percentages of respondents)
Base: SMEs for which the respective instrument is relevant. Figures refer to rounds 3 (April-September 2010) to 22 (October 2019-March 2020) of the survey.Note: See the notes to Chart 1 and Chart 4.
Q9. For each of the following types of financing, would you say that their availability has improved, remained unchanged or deteriorated for your enterprise over the past six months?Q23. Looking ahead, for each of the following types of financing available to your enterprise, please indicate whether you think their availability will improve, deteriorate or remain unchanged over the next six months.
Change in the actual and expected availability of bank overdrafts for SMEs across sectors
(over the preceding six months and over the next six months; net percentages of respondents)

Base: SMEs for which the respective instrument is relevant. Figures refer to rounds 3 (April-September 2010) to 22 (October 2019- March 2020) of the survey.Note: See the notes to Chart 1 and Chart 4.
Q9. For each of the following types of financing, would you say that their availability has improved, remained unchanged or deteriorated for your enterprise over the past six months?Q23. Looking ahead, for each of the following types of financing available to your enterprise, please indicate whether you think their availability will improve, deteriorate or remain unchanged over the next six months.
5.3 SMEs also expect a sharp deterioration in the availability of trade credit
Although euro area SMEs signalled improvements in the availability of trade credit (3%) over the past six months, they expect a significant reduction (-20%) in the near future, and one worse than in 2012 (-17%) (see Chart 14). For many SMEs, trade credit is crucial to maintaining the supply chain finance needed in the event that there is a lack of bank credit during the coronavirus pandemic. In Italy, the net percentage of SMEs expecting a reduction was much higher (-25%) and this was accompanied by a deterioration in the actual availability of trade credit over the last six months (-3%). In the other countries, the availability of trade credit improved (2% in Germany, 7% in Spain and 6% in France), but expected availability deteriorated significantly (-16% in Germany, -18% in Spain and -19% in France).
The decline in expectations about the availability of trade credit over the next six months was also prevalent across economic sectors, with net percentages of around -20% in the four main sectors (see Chart 15).
Back in 2012, availability of trade credit was expected to deteriorate by higher net percentages of SMEs in Spain (-23%) and France (-30%), but a lower net percentage of SMEs in Italy (-9%). In Germany at the time, 4% of SMEs expected an increase in the future availability of trade credit.
Change in the actual and expected availability of trade credit for SMEs across countries
(over the preceding six months and over the next six months; net percentages of respondents)
Base: SMEs for which the respective instrument is relevant. Figures refer to rounds 1 (April-September 2009) to 22 (October 2019- March 2020) of the survey.Note: See the notes to Chart 1 and Chart 4.
Q9. For each of the following types of financing, would you say that their availability has improved, remained unchanged or deteriorated for your enterprise over the past six months?Q23. Looking ahead, for each of the following types of financing available to your enterprise, please indicate whether you think their availability will improve, deteriorate or remain unchanged over the next six months.
Change in the actual and expected availability of trade credit for SMEs across sectors
(over the preceding six months and over the next six months; net percentages of respondents)
Base: SMEs for which the respective instrument is relevant. Figures refer to rounds 1 (April-September 2009) to 22 (October 2019- March 2020) of the survey.Note: See the notes to Chart 1 and Chart 4.
Q9. For each of the following types of financing, would you say that their availability has improved, remained unchanged or deteriorated for your enterprise over the past six months?Q23. Looking ahead, for each of the following types of financing available to your enterprise, please indicate whether you think their availability will improve, deteriorate or remain unchanged over the next six months.
Annexes
Annex 1 Overview of the survey replies – selected charts
Change in debt-to-total assets ratio and interest expenses of SMEs across euro area countries
(over the preceding six months; net percentages of respondents)
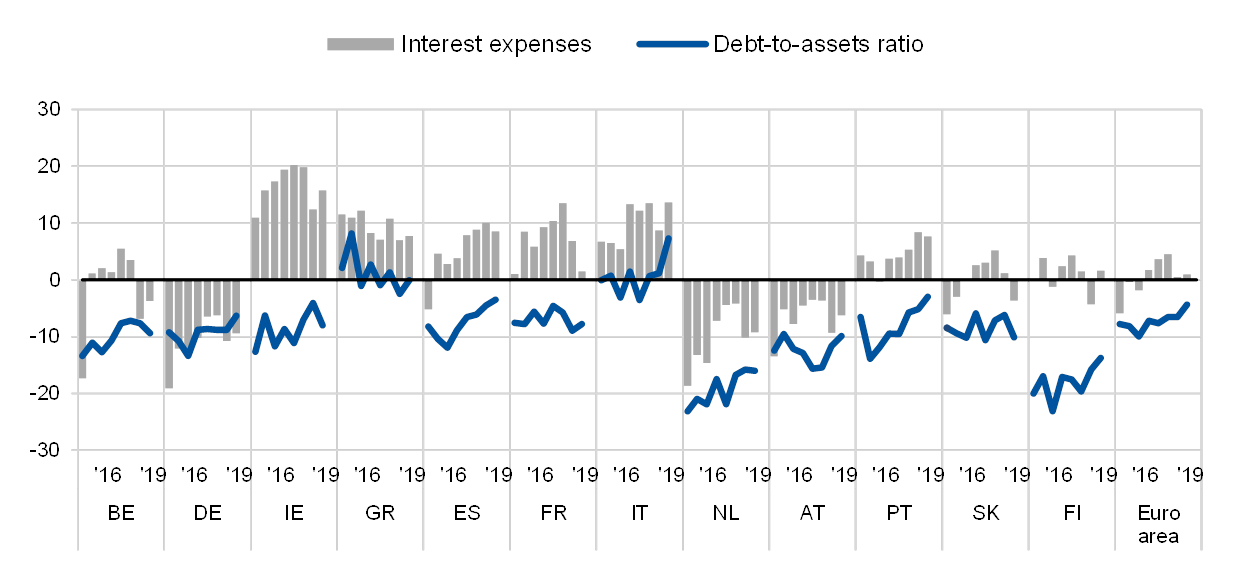
Base: All SMEs. Figures refer to rounds 15 (April 2016- September 2016) to 22 (October 2019-March 2020) of the survey.Note: See the note to Chart 1.
Q2. Have the following company indicators decreased, remained unchanged or increased over the past six months?
Vulnerable and profitable SMEs across euro area countries
(over the preceding six months; percentages of respondents)
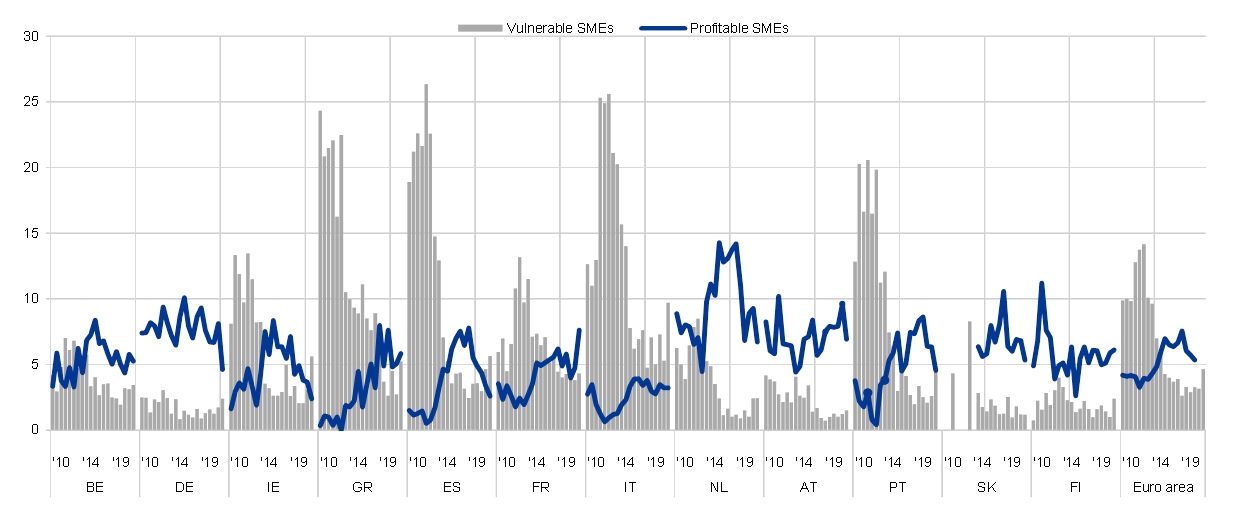
Base: All SMEs. Figures refer to rounds 3 (March-September 2010) to 22 (October 2019-March 2020) of the survey.Notes: For definitions, see footnote 3 of the report. In Slovakia, the survey was initially conducted every two years (first half of 2009, 2011 and 2013). Since 2014 Slovakia has been included in the sample for each survey round.
Q2. Have the following company indicators decreased, remained unchanged or increased over the past six months?
Applications for bank loans by SMEs across euro area countries
(over the preceding six months; percentages of respondents)
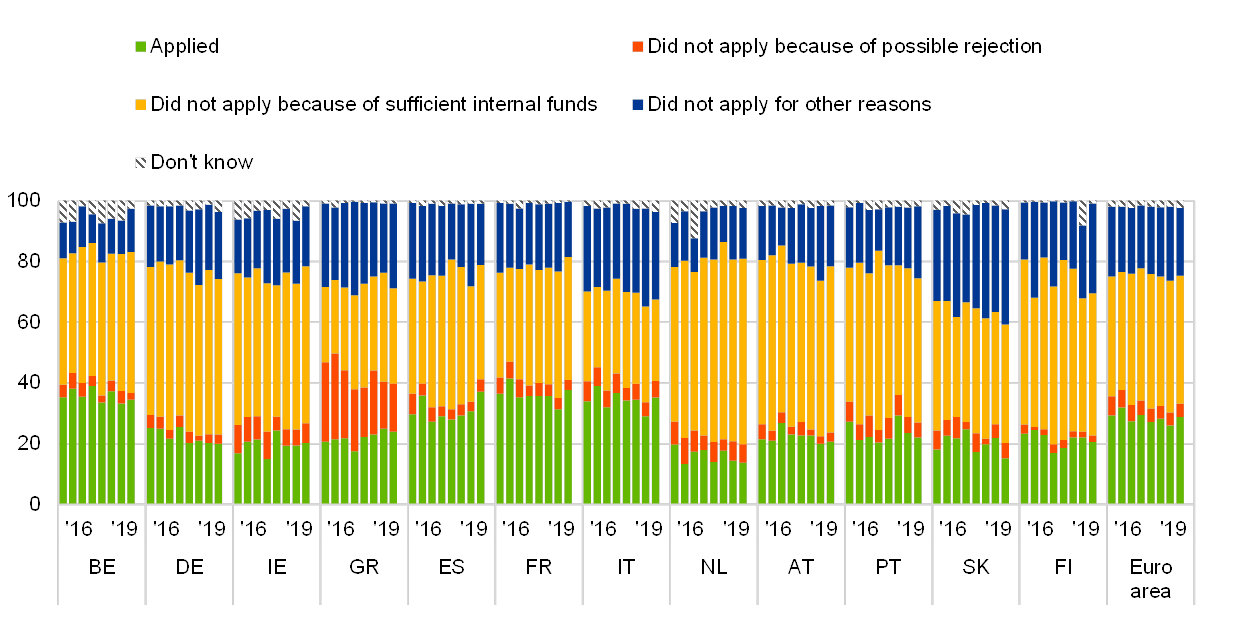
Base: SMEs for which bank loans (including subsided bank loans) are relevant. Figures refer to rounds 15 (April-September 2016) to 22 (October 2019-March 2020) of the survey.Note: See the notes to Chart 4.
Q7A. Have you applied for the following types of financing in the past six months?
Outcome of applications for bank loans by SMEs across euro area countries
(over the preceding six months; percentages of respondents)
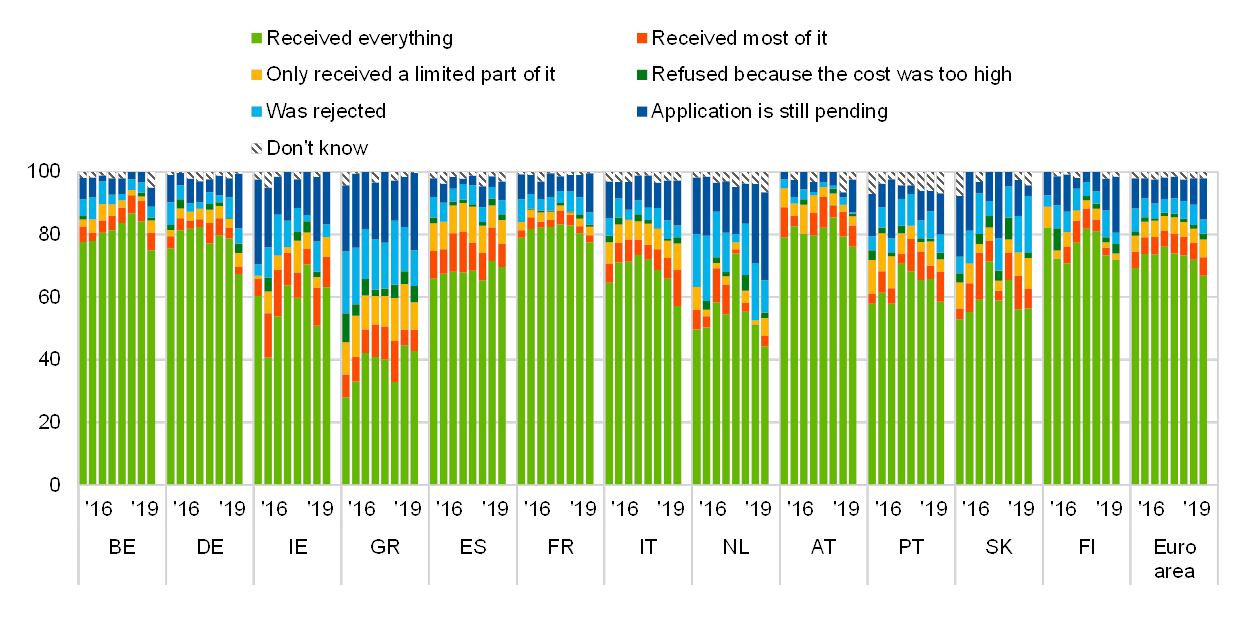
Base: SMEs that had applied for bank loans (including subsided bank loans). Figures refer to rounds 15 (April-September 2016) to 22 (October 2019-March 2020) of the survey.Note: See the notes to Chart 4.
Q7B. If you applied and tried to negotiate this type of financing over the past six months, what was the outcome?
Change in non-price terms and conditions of bank financing for SMEs across euro area countries
(over the preceding six months; net percentages of respondents)
Base: SMEs that had applied for bank loans (including subsidised bank loans), credit lines, or bank or credit card overdrafts. Figures refer to rounds 15 (April- September 2016) to 22 (October 2019-March 2020) of the survey.Note: See the note to Chart 1.
Q10. Please indicate whether the following items increased, remained unchanged or decreased in the past six months.
Annex 2Descriptive statistics for the sample of enterprises
Breakdown of enterprises by sector
(unweighted percentages)
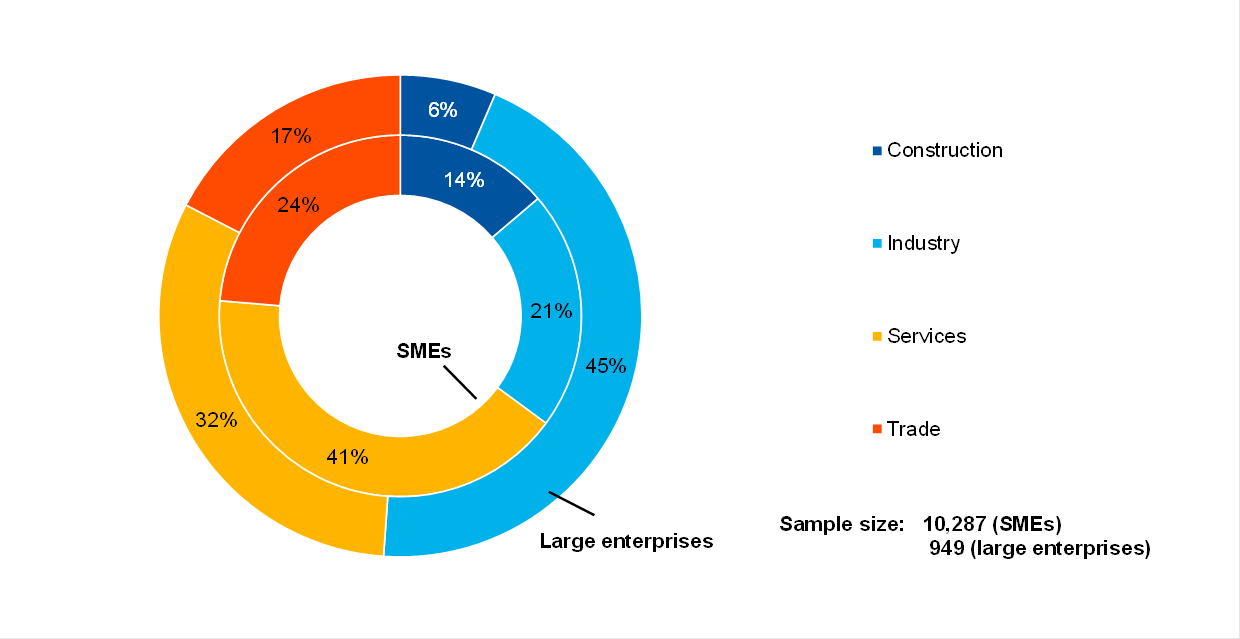
Base: Figures refer to round 22 (October 2019-March 2020) of the survey.
Breakdown of enterprises by age
(unweighted percentages)
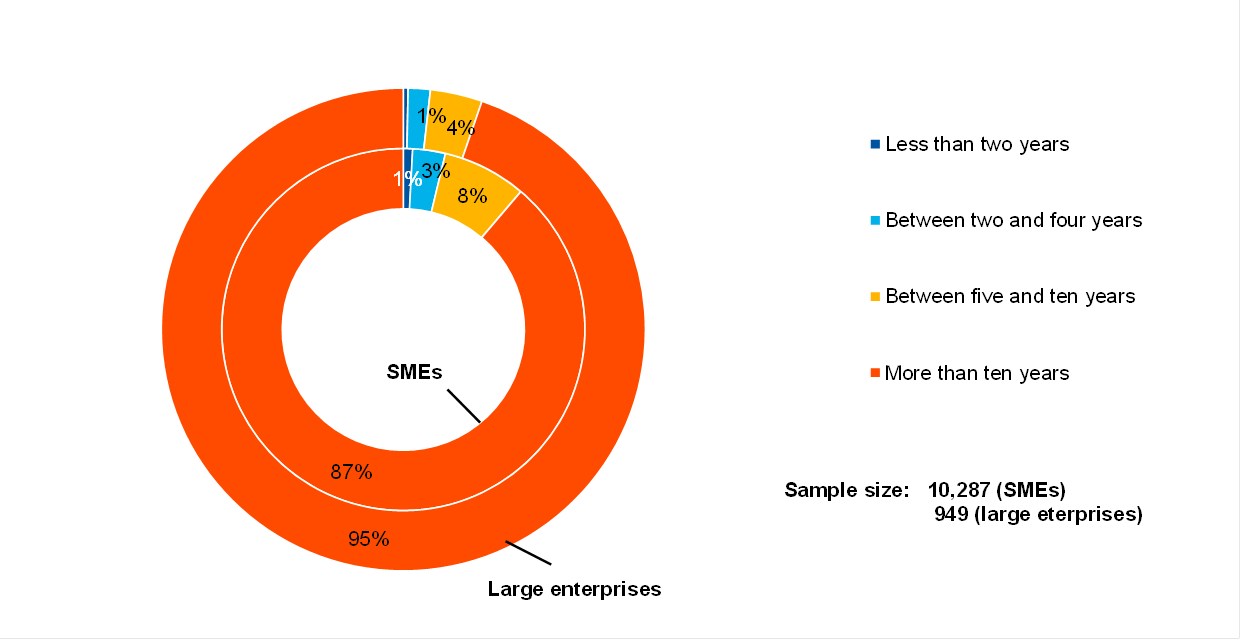
Base: Figures refer to round 22 (October 2019-March 2020) of the survey.
Breakdown of enterprises by ownership
(unweighted percentages)
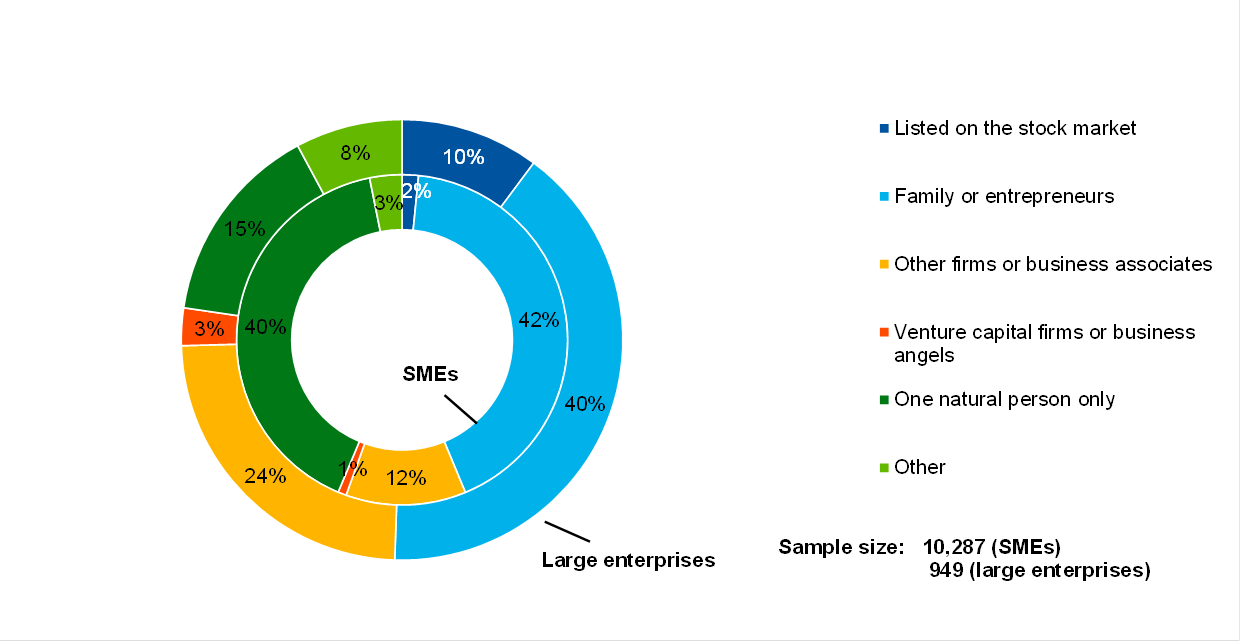
Base: Figures refer to round 22 (October 2019-March 2020) of the survey.
Breakdown of enterprises by exports
(unweighted percentages)

Base: Figures refer to round 22 (October 2019-March 2020) of the survey.
Annex 3Methodological information on the survey
This annex presents the main methodological changes introduced in the latest round of the Survey on the Access to Finance of Enterprises (SAFE). An overview of how the survey was set up, the general characteristics of the euro area enterprises that participated in the survey and the changes made to the methodology and questionnaire over time is provided in the methodological information on the survey.
Since September 2014 the survey has been carried out by Panteia b.v., in cooperation with the fieldwork provider GDCC. To the best of our knowledge, no breaks in the series are attributable to any change of provider over the life cycle of the survey.
However, some changes in the questionnaire may have caused a break between the round covering the second half of 2013 and that covering the first half of 2014. This stems from the review of various components of the survey after ten survey rounds, covering the questionnaire, sample allocation, survey mode and weighting scheme (see Annex 4 of the report on round 11 of the survey).
With regard to the weighting scheme, up to the survey round in the first half of 2015, the calibration targets were updated with each survey round based on the latest available figures from Eurostat’s structural business statistics (SBS). Since then, with all the euro area countries participating in the survey, the weighting scheme has been updated once a year (see the section on weighting in the methodological information on the survey).
In this survey round no major changes were made to the existing questions in the questionnaire.[9]
© European Central Bank, 2020
Postal address 60640 Frankfurt am Main, GermanyTelephone +49 69 1344 0Website www.ecb.europa.eu
All rights reserved. Reproduction for educational and non-commercial purposes is permitted provided that the source is acknowledged.
The cut-off date for data included in this report was 7 May 2020.
For specific terminology please refer to the ECB glossary (available in English only).
PDF ISSN 1831-9998, QB-AP-20-001-EN-NHTML ISSN 1831-9998, QB-AP-20-001-EN-Q
- [1]See Annex 3 for details on methodological issues related to the survey set-up.
- [2]Net terms or net percentages are defined as the difference between the percentage of enterprises reporting that a given factor has increased and the percentage of those reporting that it has declined.
- [3]Vulnerable firms are defined as those firms that have reported simultaneously lower turnover, decreasing profits, higher interest expenses and higher or unchanged debt-to-total assets ratios, while profitable firms are those that report simultaneously higher turnover and profits, lower or no interest expenses and lower or no debt-to-total assets ratios. See the box entitled “Distressed and profitable firms: two new indicators on the financial position of enterprises”, Survey on the Access to Finance of Enterprises in the euro area, October 2017 to March 2018, ECB.
- [4]However, there is a higher proportion of lack of responses in the French sample which complicates its interpretation.
- [5]It has to be borne in mind that the survey was conducted as the COVID-19 pandemic and associated lockdowns were unfolding in the euro area, and therefore their full implications are only partially incorporated into the responses. However, the survey provides some key insights into the sources and magnitude of the inflationary pressures perceived by euro area SMEs.
- [6]Upward pressure on prices from labour costs and other input costs was also reported by SMEs in Austria (48% and 45%), the Netherlands (52% and 45%), Finland (64% and 57%) and Slovakia (57% and 54%).
- [7]For example, Finland (34%), Greece (26%) and Ireland (21%).
- [8]A negative financing gap indicates that the increase in the need for external finance is smaller than the improvement in access to external funds.
- [9]The questionnaire is available on the SAFE website. It was translated into the respective languages for the purposes of the survey.
-
8 May 2020