


The disciplining effect of supervisory scrutiny on banks’ risk-taking: evidence from the EU wide stress test
The disciplining effect of supervisory scrutiny on banks’ risk-taking: evidence from the EU‑wide stress test
Published as part of the Macroprudential Bulletin 9, October 2019.
This article aims to contribute to the ongoing discussion about the long-term strategy for stress testing in the euro area. In particular, it highlights some of the strengths and weaknesses of the constrained bottom-up approach, which is currently used in the EU‑wide stress-testing exercise. Under this approach, banks use their own models to generate stress test projections on the basis of a common macroeconomic scenario and under the constraints imposed by the European Banking Authority methodology. This set-up provides banks with some scope to underestimate their vulnerabilities in order to appear more resilient than their peers. This article confirms previous empirical evidence showing that such behaviour may indeed be practised by banks. This, in turn, requires a robust quality assurance of banks’ stress test projections by the competent authorities (including the European Central Bank), to enforce more realistic results. Against this background, the article presents a novel empirical analysis providing indicative evidence that the “supervisory scrutiny” relating to the quality assurance may be having a disciplining effect on banks’ risk-taking.
1 Introduction
Since the financial crisis, stress tests have become an important tool for central banks and banking supervisors and have been used for different goals. During, and in the immediate aftermath of, the financial crisis, stress tests were used mainly as crisis solution tools aiming at identifying capital shortfalls in the banking sector and enhancing market discipline through the publication of consistent and granular data on a bank‐by‐bank level. In more recent years, stress tests have rather served the purpose of crisis prevention, thus aiming to identify vulnerabilities in the financial system and to assess the resilience of the banking sector and individual banks to adverse macro-financial shocks, thereby informing supervisory evaluations[1] and contributing towards macroprudential policy discussions.
Stress tests can be carried out by following either a bottom-up or a top-down approach. In a bottom-up stress test, banks produce stress test projections relying on their own models and granular data, while in a top-down stress test prudential authorities produce stress test projections in a centralised fashion relying on their own models, often based on less granular data.
The EU‑wide stress test follows a so-called constrained bottom-up approach. Under this approach, banks generate their stress test projections using their own models, relying on a common predefined macro-financial scenario and subject to a pre-set methodology. In the euro area, the European Central Bank (ECB) quality-assures the projections of banks under its direct supervision through an intense review process to ensure the consistency and credibility of banks’ projections.
This article aims to contribute to the ongoing discussion about the long-term strategy for stress testing in the euro area. Specifically, it argues that the constrained bottom-up approach used in the EU‑wide stress tests may be prone to “gaming” by banks given their incentives to appear more resilient to adverse macroeconomic developments than their peers.[2] At the same time, authorities can effectively correct this outcome through an intense supervisory scrutiny and quality assurance process. Based on novel empirical evidence, this article argues that the current set-up is also likely to provide some benefits in terms of reducing the risk-taking of those banks participating in the stress tests. In particular, it is shown that this risk reduction may partly be explained by the intense supervisory scrutiny of banks’ stress test projections during the exercises – also relying on top-down and peer benchmark challenger models – carried out by the ECB (and other competent authorities).
The article is structured as follows. The following section describes the design of the EU‑wide stress test. Section 3 summarises the stress test quality assurance process at the ECB. Section 4 provides novel empirical evidence on the disciplining effect of the supervisory scrutiny during the stress test on banks’ risk-taking. Section 5 concludes.
2 The EU‑wide stress test as a constrained bottom-up exercise
The EU‑wide stress test is a complex exercise involving several stakeholders. In line with the European Banking Authority (EBA) regulation[3], it is initiated and coordinated by the EBA in cooperation with the European Systemic Risk Board (ESRB), the ECB and national competent authorities. Specifically, the ECB provides the macroeconomic baseline scenario, contributes to the design of the adverse macroeconomic scenario and is responsible for the quality assurance (QA) process for the banks under its direct supervision. In addition to the EU‑wide exercise, the ECB conducts the Supervisory Review and Evaluation Process (SREP) stress test also for those banks under its direct supervision but which are not in the EBA sample, in line with a fully consistent approach.[4]
The current constrained bottom-up design of the EU‑wide stress test allows supervisors and market participants to compare banks’ resilience to stress in a consistent manner and helps foster banks’ risk management capabilities. The EU‑wide stress test has helped to provide supervisors and market participants with a quantitative assessment of banks’ risk profiles and vulnerabilities and to determine adequate levels of capital for euro area banks[5]. Furthermore, the current approach has the potential to strengthen banks’ incentives to improve their general risk management capabilities and, in particular, their stress testing expertise. Finally, by relying on banks’ internal models and data, this approach has the capacity to better capture bank specificities (than a pure top-down approach, for instance).
The constrained bottom-up design also entails certain weaknesses, including substantial scope for banks to understate their vulnerabilities. As claimed by some observers, the stress tests could constitute a kind of “beauty contest” among the banks in the sense that each bank has strong incentives to emerge from the exercise appearing relatively more solid in comparison to its peers.[6] The bottom-up nature of the European stress tests provides banks with some leeway to optimise their initial stress test submissions before QA, in such a way that they may materially understate their vulnerabilities (see Box 1 for a more detailed analysis). This element necessitates a thorough and resource-intensive QA process (see following section). As a result of the aforementioned limitations, the informative value of the stress test outcome to participating banks and investors may be only partial.
Box 1
Do banks “game” the EU‑wide stress test?
One of the frequently raised criticisms of the constrained bottom-up approach of the EU‑wide stress test is that it provides banks with leeway to “game” the exercise allowing them to exploit their internal models to generate insufficiently prudent stress test projections.
In order to explore whether banks under the ECB banking supervision effectively “game” the EU‑wide stress-testing exercise, the analysis of Niepmann and Stebunovs (2018)[7] is replicated for a large sample of 85 significant institutions (SIs) which participated both in the 2014 and in the 2016 stress tests. Unlike Niepmann and Stebunovs (2018), our sample includes both EBA and SREP banks and relies on confidential ECB stress test data.
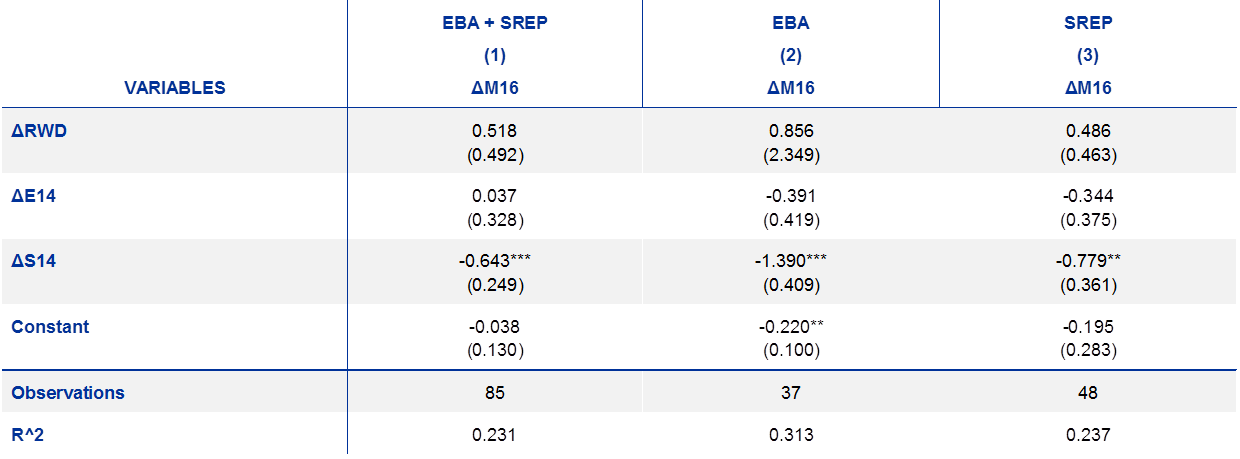
Specifically, by relying on a bank regression analysis using SIs’ stress test submissions related to credit risk, it is assessed how changes in the models ( banks used to predict loan losses in 2014 and 2016 stress tests, respectively, can be explained by changes in the riskiness of the banks’ portfolios (measured by risk-weight density, i.e. ), changes in their exposures (i.e. ) or changes in the scenario (i.e. ). This regression is estimated for all banks in the sample, but also for the EBA banks and the SREP banks separately.
The regression results are shown in Table A. It can be observed that banks whose losses would have increased the most between the 2014 and 2016 stress tests due to changes in the adverse scenario are those that adjusted more materially their internal credit risk models to reduce their projected loan losses. The results hold for all banks in the sample, but also for the EBA and SREP banks separately. It was also found that the effect is stronger for the EBA banks (as evidenced by the more negative coefficient), which presumably reflects on their relatively stronger reliance on internal models.[8]
Table A
Regressions explaining stress test model changes between 2014 and 2016 stress tests
Source: ECB stress test data.
Notes: ECB calculations. Standard errors in parentheses; *** p<0.01, ** p<0.05, * p<0.1.
While these results provide some indications of “gaming” by stress-tested banks, a number of caveats should be highlighted, as also suggested by Covas (2018). First, the approach does not include the lagged loan losses among the considered explanatory variables nor does it control for the starting values of default rates in the loan loss model. This ignores the fact that loan losess are path-dependent (i.e. starting values of default rates influence their dynamics over the prediction years).[9] Moreover, the Niepmann-Stebunovs study considers only (the published) final stress test results, which, as will be argued below, is not a pure bottom-up outcome but rather a hybrid between the banks’ original submissions and supervisory overlays during the quality assurance process. To assess whether this would have a major effect on the results, the same analysis was conducted on the original bank submissions (i.e. without overlays), and the results (available upon request) largely still hold.
3 Quality assurance of the bank stress test submissions
The key objective of the ECB’s quality assurance work is to ensure that banks’ stress test projections are credible and reliable. During the QA process, the ECB, as competent authority, challenges banks’ submitted stress test projections from several perspectives. First, the ECB assesses the compliance of banks’ submissions with the constraints imposed by the EBA methodology. Second, it assesses the credibility of banks’ submissions by comparing them with the projections produced by the ECB top-down (TD) models and with the projections submitted by peer banks.
Figure 1
High-level overview of the ECB stress-testing quality assurance process

Source: ECB.
The ECB QA is a fair and thorough process lasting several months over three cycles. At the end of the first QA cycle, banks receive reports providing them with detailed assessments of their submissions and informing them of any material deviations, called QA flags, between their own projections and the ECB challenger views and are asked to “comply or explain”. This implies that in the presence of material deviations, banks are asked to provide quantitative and qualitative evidence supporting their own projections. In the last QA cycle, if the deviations persist and banks’ explanations are not deemed sufficient, banks are asked to “comply” with the supervisory challenger view. The QA process, which also benefits from the bank-specific knowledge of the direct supervisors on the Joint Supervisory Teams (JSTs), involves extensive interaction between different stakeholders, a substantial amount of resources and overall implies close supervisory scrutiny. Figure 1 presents an overview of the steps undertaken by the ECB during each cycle of the QA process.[10] In the following section, it is explored the extent to which this extended and intensive supervisory scrutiny could impact banks’ risk-taking behaviour.
4 The disciplining effect of supervisory scrutiny in the EU‑wide stress test[11]
An empirical analysis is conducted to examine the effect of the EU‑wide stress test on banks’ risk-taking. The analysis focuses on euro area banks’ risk-taking behaviour around the time of the 2016 EU‑wide stress-testing exercise. Two hypotheses are tested empirically: (i) banks’ participation in the stress test has an attenuating effect on their risk-taking in subsequent quarters; and (ii) this effect on banks’ risk-taking may at least partly be due to the tighter supervisory scrutiny prompted by the QA process.
These two hypotheses are tested using a difference-in-differences approach and rely on confidential data available at the ECB. The use of this approach makes it possible to identify the effect prompted by the participation in the stress test, on the one hand, and the intensity of the supervisory scrutiny during the exercise, on the other hand. The analysis is based on bank-level supervisory data on balance sheet exposures, profit and loss and capital requirements for the period between 2015 and 2018 and confidential data on the stress test projections submitted by banks in each of the three QA cycles of the 2016 EU‑wide stress test, including detailed information on the intensity of the QA process for each bank. The empirical approach is described in more detail in Box 2.
Box 2
A difference-in-differences approach to test the effect of stress testing on risk-taking
To examine if there was a change in the risk-taking of banks that were stress tested (a so-called “treatment” group) and banks that were not stress tested (a so-called “control” group) during the 2016 EU‑wide stress test, a difference-in-differences approach is employed (known as hypothesis 1). Accordingly, the following regression is estimated:
Where is the risk-weight density for credit risk exposures of bank i at time t and is the measure of bank risk. is a dummy variable which takes a value equal to 1 in the 4 quarters of 2017 and 0 in the 4 quarters of 2015. In other words, a symmetric window around the event is used, meaning that the four quarters of 2016 during which the stress test was performed are omitted.[12] is a dummy variable which takes a value equal to 1 if a bank participated in the 2016 stress test and 0 otherwise. is a vector of bank-specific controls. and are respectively bank and time-fixed effects. is an interaction term between country and time-fixed effects, which is included in the regressions to control for loan demand effects. A number of control variables are included to account for bank-specific characteristics. They comprise the regulatory capital ratio[13], which allows disentangling the effects of supervisory scrutiny and higher capital requirements, and the voluntary capital ratio, which means the capital held by banks in addition to the amount required by the regulations and the supervisors. Furthermore, other control variables include the ratio of loan loss provisions over total loans to account for asset quality, the cost-income ratio to measure management capability, the return on equity as a yardstick for earnings, the share of cash and other liquid assets over total assets to capture bank liquidity risk, the retail ratio[14] and the share of interest income as proxies for banks’ business models. Finally, bank size is controlled by using the logarithm of banks’ total assets, as this variable is key in determining the selection for the control and treatment groups.
The “treatment” group used in this difference-in-differences approach comprises a sample of significant institutions (SIs) that took part in the 2016 EU‑wide stress test. The “control” group is composed of a number of large less significant institutions[15] (LSIs) that did not take part in the 2016 stress test. Banks that were either undergoing resolution, took part in a merger, or formed part of the banking groups that were stress tested within or outside of the euro area (subsidiaries or branches) were excluded from the sample. Hence, only banks at the highest level of consolidation are included in the analysis which, after balancing according to the availability of the covariates, results in a “treatment” group of 63 SIs[16] and a “control” group of 69 LSIs.
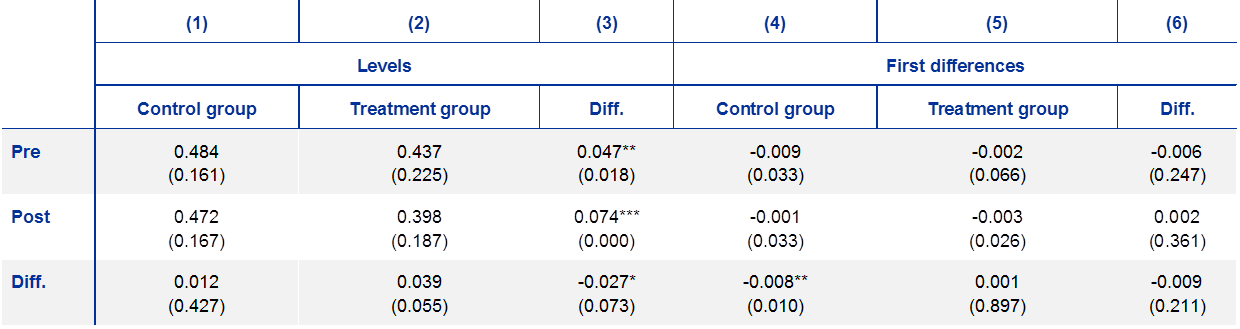
Table A confirms that a key identifying assumption needed in a difference-in-differences setting is satisfied; namely, the trend of change in bank risk between the “control” and “treatment” group is parallel in the period before the stress test. Columns (4) to (6) of Table A show means and differences in means for the quarter-on-quarter change in RWD for the “control” (non-stress tested banks) and “treatment” (stress tested banks) groups. Stress tested as well as non-stress tested banks reduced RWD on average over the whole observation period. However, column (6) shows that differences between non-stress tested and stress tested banks in the slope of RWD in the pre-period are not significantly different from zero, which confirms that the parallel trend assumption is valid.
Table A
Summary statistics of the dependent variable risk-weight density for the “treatment” and “control” groups and test for significant differences in pre-period trends
Source: ECB stress test data.
Notes: ECB calculations. Columns (1), (2), (4) and (5) show means and standard deviations in parentheses. Columns (3) and (6) show the difference in means between groups and p-value of t-test in parentheses: *** p<0.01, ** p<0.05, * p<0.1.
Furthermore, Columns (1) and (2) of Table A show the average RWD of the “treatment” and “control” groups in the pre- and post-stress test period. The last row indicates that while both groups exhibit lower RWD on average in the period after the stress test compared to the average RWD beforehand, this difference is only significantly different from zero for the group of tested banks. Column (3) further documents that the mean RWD of stress-tested banks is significantly lower than the average RWD of control banks in the pre-period as well as in the post-period. The analysis accounts for this difference in levels by effectively demeaning the outcome variable through the introduction of bank-fixed effects. Finally, the bottom row of Column (3) shows the unconditional difference-in-differences effect, which provides preliminary evidence for the hypothesis that the stress-testing exercise impacted banks' risk-taking behaviour.
In this analysis, participation in the stress test is used as a treatment that is only applied to a subset of European banks. This strategy, however, implies that this subset of banks is not selected randomly from a homogeneous population as would occur in a perfect experimental setting. In fact, whether or not a bank was stress tested largely depended on its membership in the group of SIs which is, largely, a function of its size. This implies that there is a material difference in the average size in terms of total assets between the banks in the treatment and control groups. However, as the selection was based on observable characteristics, the selection criteria can be controlled for allowing for the estimation of the effect on bank risk of being stress tested. This notwithstanding, the results hinge on the notion that the control group of LSIs is comparable to the stress-tested banks. In order to reduce the concern that the results are driven by the differences between the banks in the control and treatment groups, following a similar strategy to that proposed by Gropp, Mosk, Ongena and Wix (2018), matching estimation techniques were employed to run the estimation on a more homogeneous subsample of banks.[17] The results still hold.[18]
In a second step, to examine hypothesis 2 as to whether the identified reduction in risk-taking is related to the close scrutiny to which the ECB subjects the banks during the QA process, a further interaction term is added to the regression. The QA process and the related supervisory scrutiny and interactions between the ECB and the banks provide information about the variation in the intensity of the QA process across banks that can be exploited, as a measure of the intensity of the treatment. Hence, the following regression is estimated:
Where is a bank level measure of the intensity of the QA process. More specifically, three different measures to capture the intensity of the QA process are used. The first yardstick, , is the number of credit risk flags which were raised and communicated to the banks during the QA process. The second measure,, is the sum of the potential impact that the QA credit risk flags communicated to the banks could have in terms of CET1 depletion. The third measure,, is an indicator ranging from 1 to 3 depending on the number of QA cycles during which a bank was communicated a credit risk flag.[19] Since two of these measures are continuous and one is ordinal, the regression is estimated using two different approaches. First, all three measures are treated as continuous . Second, for each of the three measures a binary variable is created, namely, , which is equal to 1 for values above the median QA treatment of the respective category (and equal to 0 if below the median). This latter approach eases the interpretation of the triple interaction term and makes the various results comparable.[20]
Banks that participated in the 2016 stress test reduced their average risk weight density (RWD) by about 4.2 percentage points relative to banks that were not tested. Table 1 reports the outcome of the test of whether stress-tested banks reduced their risk by more than non-stress tested banks in the period after the stress-testing exercise (hypothesis 1). As can be observed, the coefficient of the interaction term is negative and significant in all considered regressions. This effect is economically significant, as it amounts to a change in RWD of about 20% from the standard deviation of the RWD of the tested banks. This result indicates that banks’ participation in the 2016 EU‑wide stress test led to a material reduction in their risk-taking.[21] This result still holds when only the exposures under the Standardised Approach are considered. This indicates that the decline observed in the RWD reflects an effective reduction in risk (and not just an “optimisation” of risk weights).[22]
Table 1
Effect of participating in the stress test on banks’ risk-taking

Source: ECB supervisory data.
Notes: ECB calculations. Clustered standard errors at the bank level in parentheses; *** p<0.01, ** p<0.05, * p<0.1.
Closer supervisory scrutiny related to the QA process applied by the ECB during the EU‑wide stress test seems to have contributed to a reduction in stress-tested banks’ risk-taking.[23] Table 2 reports the outcome of the test of whether stress-tested banks reduced their risk more significantly when they were subject to more intense supervisory scrutiny during the stress-testing exercise (hypothesis 2). In columns (1), (3), and (5) of Table 2, the three QA measures are treated as continuous variables while in columns (2), (4), and (6) they are transformed into a dummy variable. Columns (1) and (2) show that there is a negative significant triple interaction for the QA intensity measure. Column (2) illustrates that the tested banks that received an above median number of flags reduced, on average, their RWD by 5.6 percentage points more than the below-the-median tested banks. Results in Columns (3) and (4) indicate that the potential impact, in terms of capital depletion, of the flags on the final stress test result does not seem to matter for the risk reduction since both coefficients for the triple interaction are insignificant. In Columns (5) and (6), some evidence is shown that a longer duration of the QA process had a negative significant effect. It is found that having a third round of QA results in an additional 2.5 percentage point drop in RWD compared to banks that had no further flags to discuss.
Table 2
Effect of being stress tested on banks’ risk-taking through the QA channel
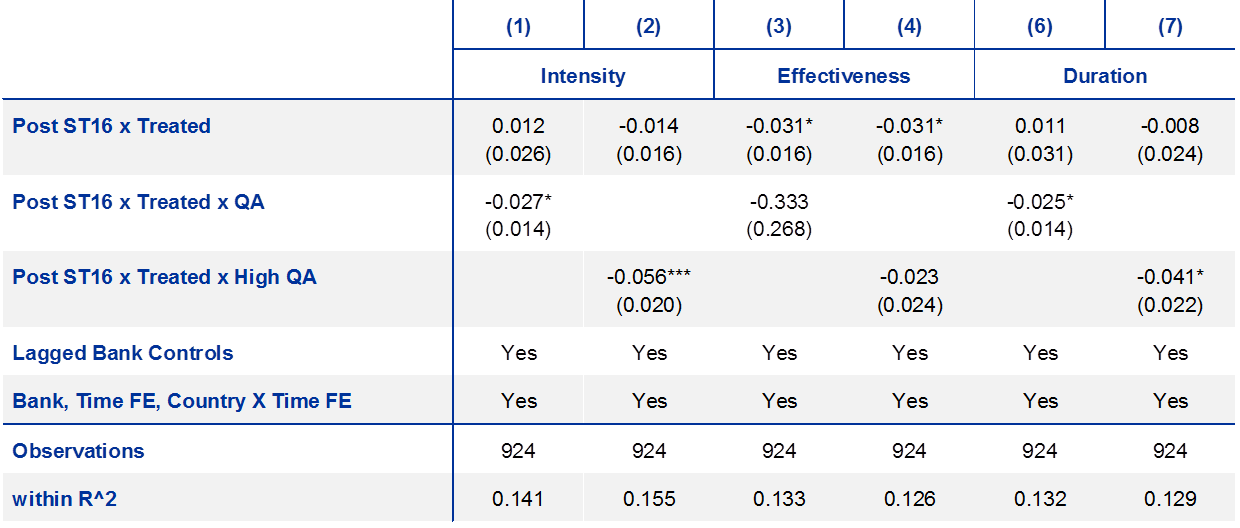
Sources: ECB supervisory and stress-testing data.
Notes: ECB calculations. Clustered standard errors at the bank level in parentheses; *** p<0.01, ** p<0.05, * p<0.1.
5 Conclusions
This article has highlighted certain strengths and weaknesses of the current constrained bottom-up approach of the EU‑wide supervisory stress tests. On the one hand, the bottom-up nature of the exercise provides banks with leeway and incentives to underestimate their vulnerabilities in order to appear better than their peers. On the other hand, the stress tests are conducted applying a robust quality assurance of banks’ stress test submissions by competent authorities (including the ECB), which ensures the credibility and reliability of the results and may have beneficial disciplining effects on stress tested banks’ risk-taking. This analysis has provided empirical evidence both of the possibility that banks “game” the stress-testing exercise and of the possible disciplining effects of the supervisory scrutiny that is entailed by the quality assurance process. These findings may be relevant for ongoing discussions about the long-term strategy for the European banking sector stress tests.
6 References
Acharya, V., Berger, A. and Raluca, R. (2018), “Lending Implications of U.S. Bank Stress Tests: Costs or Benefits?”, Journal of Financial Intermediation, Volume 34, p.p. 58‑90.
Calem, P., Correa, R. and Lee, S. J. (2017), “Prudential Policies and their Impact on Credit in the United States”. BIS Working Paper Series, No. 635.
Cortes, K., Demyanyk, Y., Li, L., Loutskina, E. and Strahan, P. (2019), “Stress Tests and Small Business Lending”, Journal of Financial Economics, forthcoming.
Hirtle, B., Kovner, A., and Plosser, M. (2019), “The Impact of Supervision on Bank Performance”, Federal Reserve Bank of New York Staff Report, Number 768.
Covas, F. (2018), “A Critical Assessment of “Modelling your Stress Away” by Niepmann and Stebunovs (2018)”, Blog Post, Bank Policy Institute.
Enria, A. (2019), “The Future of Stress Testing – Realism, Relevance and Resources”, Keynote Speech at the European Systemic Risk Board annual conference, 26 September.
Gropp, R., Mosk, T., Ongena, S. and Wix, C. (2019), “Bank Response to Higher Capital Requirements: Evidence from a Quasi-Natural Experiment”, The Review of Financial Studies, Volume 32, Issue 1, pp. 266‑299.
Kok, C., Müller, C. and Pancaro, C. (2020), “The Disciplining Effect of Supervisory Scrutiny in the EU‑wide Stress Test”, Working Paper Series, European Central Bank, forthcoming.
Mirza, H. and Zochowski, D. (2017), “Stress Test Quality Assurance from a Top-Down Perspective”, Macroprudential Bulletin, Issue 3.
Niepmann, F. and Stebunovs, V. (2018), “Modeling Your Stress Away”, International Finance Discussion Papers, No 1232.
Philippon, T., Pessarossi, P. and Camara, B. (2017), “Backtesting European Stress Tests”, Working Paper, National Bureau of Economic Research, No 23083.
Pierret, D. and Steri, R. (2019), “Stressed Banks”, Swiss Finance Institute Research Paper Series, No. 58.
Quagliarello, M. (2019), “Are Stress Tests Beauty Contests? (And What We Can Do About It)”, EBA Staff Paper Series, No 4.
ECB Banking Supervision uses both the qualitative results (quality and timeliness of banks’ submissions) and the quantitative results (capital depletion and banks’ resilience under the adverse scenario) as input into the Supervisory Review and Evaluation Process (SREP) to inform the setting of Pillar 2 capital requirements (P2R) and Pillar 2 capital guidance (P2G) respectively.
Quagliarello (2019) describes the “beauty contest” problem and also discusses how some changes to the current design of the EU‑wide stress test could help to mitigate this phenomenon.
Regulation No 1093/2010 of the European Parliament and of the Council of 24 November 2010 establishing a European Supervisory Authority (European Banking Authority) states, inter alia, that the EBA may “initiate and coordinate Union-wide stress tests…to assess the resilience of financial institutions to adverse market developments, and evaluate the potential for systemic risk to increase in situations of stress, ensuring that a consistent methodology is applied at the national level to such tests and, where appropriate, address a recommendation to the competent authority to correct issues identified in the stress test”.
The stress test results of the banks in the EBA sample are published while the results of the banks in the SREP sample are typically not published at the level of individual banks.
In this article, the focus is primarily on the euro area banks, which are part of the EBA sample for the EU‑wide stress tests, as well as other euro area significant institutions that are also being stress tested by the ECB in parallel with those being tested in the EBA-coordinated part of the exercise.
See e.g. Quagliarello (op.cit.) and Enria (2019).
Niepmann and Stebunovs (2018) build on the approach developed by Philippon, Pessarossi and Camara (2017).
In line with the findings of Niepmann and Stebunovs (2018), it was also found that if banks had used their 2014 models in the 2016 stress test, their projected loan losses would have been materially higher. These results are available on request.
Both points of criticism are in principle valid. However, due to the fact that the stress test data submissions are “snapshots” of biennial frequency it is difficult to establish a dynamic loan loss model. In addition, in principle bank fixed effects should capture differences in starting values (by demeaning for each stress test). It cannot, however, be completely excluded that changes to the estimated models might reflect other factors than “strategic behaviour”.
Mirza and Zochowski (2017) provide a detailed overview of the different steps and components of the ECB stress-testing quality assurance process.
The analysis in this section is based on Kok, Müller and Pancaro (2020).
However, results are robust to the selection of different time windows around the event.
This variable is based on supervisory data and comprises Pillar 1, Pillar 2, as well as macroprudential capital buffers.
The retail ratio is calculated as the ratio between the sum of loans and deposits over total assets.
Less significant institutions are SSM banks that do not fulfil any of the significance criteria to be qualified as significant institutions. Less significant institutions are not under the direct supervision of the ECB.
Among these 63 banks, 31 are EBA and 32 are SREP banks.
To further control for the difference in size between the banks in the treatment and in the control group, we also re-estimated our baseline regression by gradually reducing the sample by progressively excluding the smallest non-tested and the largest tested banks. The results still hold.
Further details are provided in Kok, Müller and Pancaro (2020).
All of these three measures refer to flags which were triggered under the stress-test adverse scenario.
To control whether the ECB’s supervisors pay greater attention to riskier banks during the QA, we separately regress the three yardsticks, which measure the intensity of the QA process, for the RWD and bank controls and we find that, depending on the observables, there is no significant relationship between the intensity of the QA and risk.
This finding is broadly in line with similar studies for the US stress tests. See e.g. Pierret and Steri (2019), Acharya et al. (2018), Cortes et al. (2019), Calem et al. (2017).
Further robustness checks have been conducted, replacing the RWD as dependent variable with alternative measures of bank risk taking (e.g. leverage ratio). For more details, see Kok, Müller and Pancaro (2020).
The finding that supervisory scrutiny can have a disciplining effect on banks’ risk taking is consistent with comparable US-based studies; see e.g. Hirtle, Kovner and Plosser (2019) for a recent analysis.