
Financial Stability Review, November 2020
Foreword

As the end of 2020 approaches, the disruption caused by the coronavirus COVID-19 pandemic remains the predominant force shaping both the current economic and financial environment and the future prospects for euro area financial stability. In turn, efforts to mitigate the economic damage to corporates and households from the pandemic remain the primary focus of policymakers in the euro area and elsewhere.
While the signs of recovery in economic activity over the summer and recent progress on vaccines give cause for some optimism, governments continue their efforts to contain the spread of the virus. So there is a long road ahead, and authorities will have to make difficult decisions on whether and how to extend policy measures and, eventually, deal with the debt they create. At the same time, global risks, particularly from climate change, cannot be forgotten and are also becoming more pressing issues as time goes on.
Against this backdrop, the November 2020 Financial Stability Review assesses the implications of the ongoing pandemic and the associated change in prospects for financial market functioning, debt sustainability, bank profitability and the non-bank financial sector. It also sets out policy considerations for both the near term and the medium term. It does so to promote awareness of systemic risks among policymakers, the financial industry and the public at large, with the ultimate goal of promoting financial stability. By providing a financial system-wide assessment of risks and vulnerabilities, the Review also provides key input to the ECB’s macroprudential policy stance.
The Review has been prepared with the involvement of the ESCB Financial Stability Committee, which assists the decision-making bodies of the ECB in the fulfilment of their tasks.
Luis de Guindos
Vice-President of the European Central Bank
Overview

The euro area economy faces a fragile and uneven recovery, notwithstanding considerable policy support
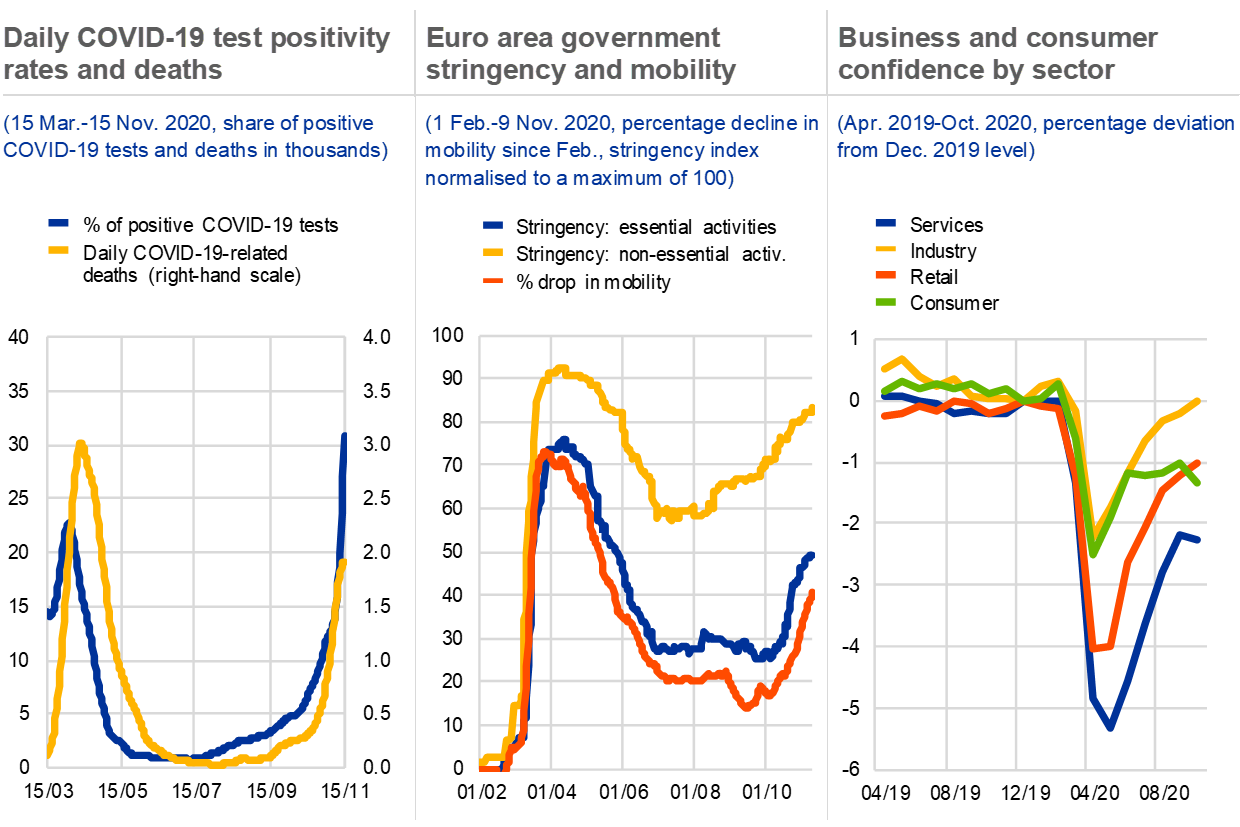
The coronavirus (COVID-19) pandemic continues to weigh on the outlook for economic activity and financial stability in the euro area as well as globally. Economic activity contracted sharply in all euro area countries in the second quarter of 2020, with countries more affected by the pandemic and associated containment measures facing the sharpest GDP falls (see Chart 1, left panel). The easing of measures as of late spring brought about a rebound in economic activity. Nevertheless, with the recent resurgence in new infection rates and the related reimplementation of social distancing measures in many countries, the economic recovery in the euro area has lost momentum more rapidly than expected. Professional forecasters now expect that the euro area economy will not exceed pre-pandemic GDP levels until 2023 (see Chart 1, right panel). Downside risks remain significant, including from an adverse outcome of Brexit negotiations (see Section 1.1). On the upside, the availability of a vaccine in the near future may help the euro area return to pre-pandemic levels of economic activity faster.
Chart 1
The euro area economy has been hit hard by the pandemic amid continued uncertainty surrounding its overall economic impact and the path of the recovery

Sources: ECB, Hale et al. (2020), Johns Hopkins University (CSSE COVID-19 data) and ECB calculations.
Notes: Left panel: the Oxford COVID-19 Government Response Tracker (OxCGRT) is based on 18 indicators, ranging from information on containment and closure policies (e.g. school closures, restrictions on movement) to economic (e.g. income support to citizens) and health system (e.g. coronavirus testing regime or emergency investments in health care) policies. The stringency index shown here reports the strictness of lockdown-style policies that primarily restrict people’s behaviour, as well as numbers between 1 and 100, giving the average index value per country between 1 March and 30 June 2020. See Hale, T., Webster, S., Petherick, A., Phillips, T. and Kira, B., “Oxford COVID-19 Government Response Tracker”, Blavatnik School of Government, 2020. For data on coronavirus deaths, see Dong, E., Du, H. and Gardner, L., “An interactive web-based dashboard to track COVID-19 in real time”, The Lancet Infectious Diseases, Vol. 20, Issue 5, May 2020, pp. 533-534. Right panel: the shaded areas indicate GDP paths based on growth rates that are one standard deviation above/below the average ECB Survey of Professional Forecasters forecast.
The economic impact of the pandemic has been highly uneven. This is reflected by the record high dispersion of value-added growth across sectors of economic activity and euro area countries (see Chart 2, left panel). Looking ahead, at the sector level, manufacturing is expected to rebound earlier than several segments in the services sector, such as catering, arts and entertainment, and travel services. Meanwhile, countries that were more affected by the ramifications of the pandemic and have less (fiscal) policy space to deal with them are projected to recover more slowly than others. That said, alongside the asset purchases carried out by the Eurosystem under the pandemic emergency purchase programme (PEPP), the recently launched European initiatives, such as the SURE and the Next Generation EU (NGEU) instruments, should help ensure a more balanced economic recovery across EU countries and avoid the economic and financial fragmentation risks observed during the euro area sovereign debt crisis. The impact of the NGEU, and in particular of the Recovery and Resilience Facility, will depend on its timely operationalisation and effective use.
Chart 2
Economic and financial market developments have been strikingly uneven across countries and sectors of economic activity

Sources: Eurostat, Bloomberg Finance L.P. and ECB calculations.
Notes: Left panel: the dispersion of growth across countries is measured as the weighted standard deviation of year-on-year growth in value added in the euro area. Ireland and Malta are excluded because of data consistency and availability issues respectively. The dispersion of growth across sectors is measured as the weighted standard deviation of year-on-year growth in euro area value added in the main NACE economic activities.
Strength in asset prices and renewed risk-taking make some markets increasingly susceptible to corrections
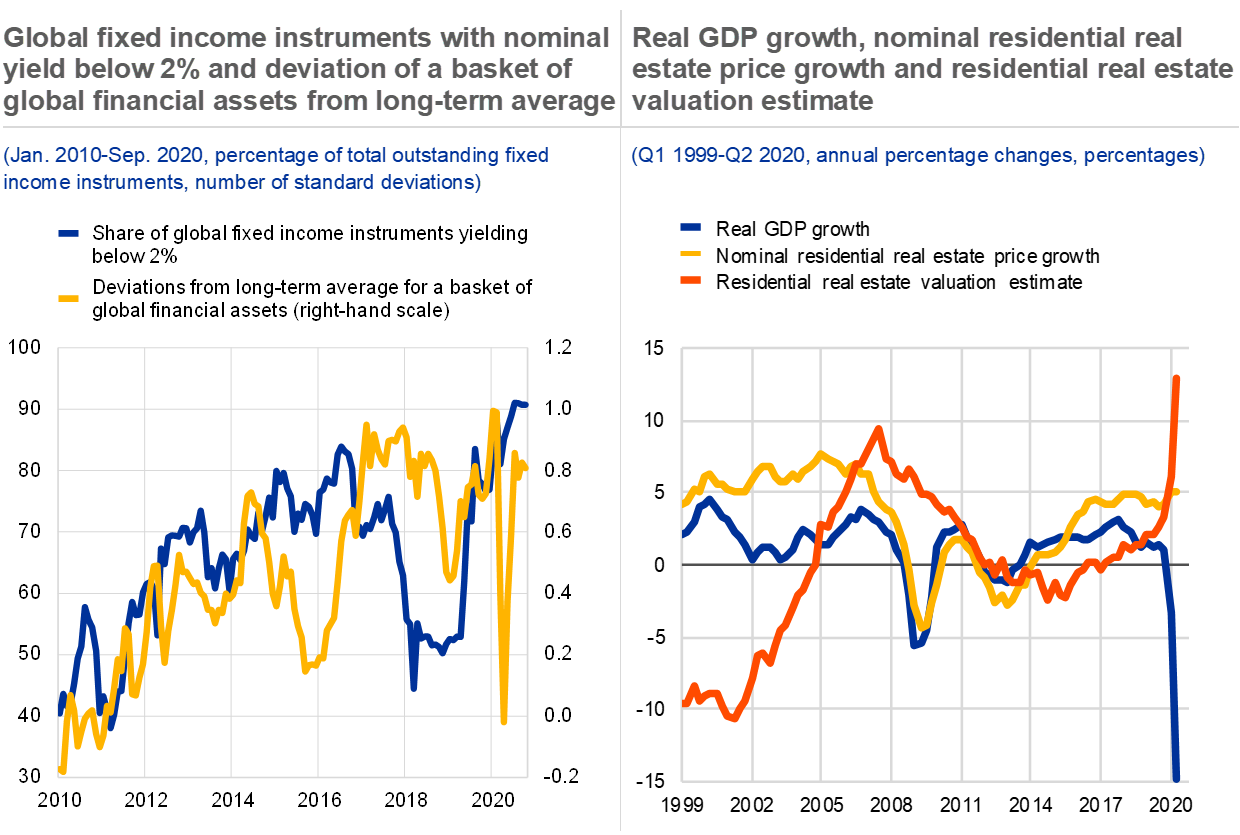
A notable rebound in financial markets over the summer has contrasted with weak economic fundamentals – increasing the risk of a correction. There was a remarkable recovery in financial asset prices over the summer, reflecting historically loose financial conditions and confidence in the monetary and fiscal policy response. In particular, the buoyancy of some equity markets has led to some concern about a disconnect from underlying economic fundamentals. That said, advances in equity markets have varied across both countries and sectors, with the largest rebounds concentrated in the United States and the technology sector (see Chart 2, right panel), reflecting a large dispersion of sectoral earnings expectations (see Chapter 2). Credit spreads have fallen back to pre-pandemic levels across the rating spectrum and appear tight in view of the near-term economic outlook, particularly for the high-yield segment of the corporate bond market. Globally, rising asset prices have resulted in 90% of outstanding fixed income securities offering nominal yields of 2% or less and the average real yield of a basket of 17 global financial assets stands at 0.8 standard deviations away from its long-term average (see Chart 3, left panel). Taken together, equity and credit valuations seem increasingly contingent on, and sensitive to, changes in the benchmark yield curve, and investors could reassess asset valuations swiftly if the course of the pandemic were to lead to materially weaker economic outcomes.
Chart 3
Risk-taking resumed in a prolonged low interest rate environment amid signs of stretched valuations in some asset classes
Sources: IHS Markit, Refinitiv, Eurostat, national central banks, Bank for International Settlements, ECB and ECB calculations.
Notes: Left panel: the basket of global financial assets used to compute the valuation metric includes: real yields on Japanese, US, UK and euro area ten-year government bonds; US and euro area investment-grade and high-yield bonds; Japanese, US, UK and euro area equity; US real estate investment trusts and mortgage-backed securities; and emerging market sovereigns and equity. Right panel: the valuation estimate is the simple average of the price-to-income ratio and an estimated Bayesian vector autoregression (BVAR) model. For details of the methodology, see Box 3 in Financial Stability Review, ECB, June 2011, and Box 3 in Financial Stability Review, ECB, November 2015. Overall, estimates from the valuation models are subject to considerable uncertainty and should be interpreted with caution. Alternative valuation measures can point to lower/higher estimates of overvaluation.
The risk of correction in tangible asset markets – namely residential and commercial property markets – has also increased. Euro area residential real estate markets have proved resilient to the pandemic so far, as the low interest rate environment has continued to underpin demand, while loan moratoria and job protection schemes have helped to sustain household debt servicing capacity. Even so, signs of overvaluation are increasingly visible for the euro area as a whole (see Chart 3, right panel). By contrast, the pandemic has led to an abrupt and sustained drop in activity in commercial real estate (CRE) markets, with a disproportionate drop in activity by more flighty foreign investors. A longer than expected economic shock, coupled with preference shifts arising from the pandemic (e.g. lower demand for office space), could prompt an extended decline in the euro area CRE market.
Chart 4
Following a risk-off period during the March turmoil, non-banks resumed increasing their credit and liquidity risk
Sources: ECB securities holdings statistics, Refinitiv and ECB calculations.
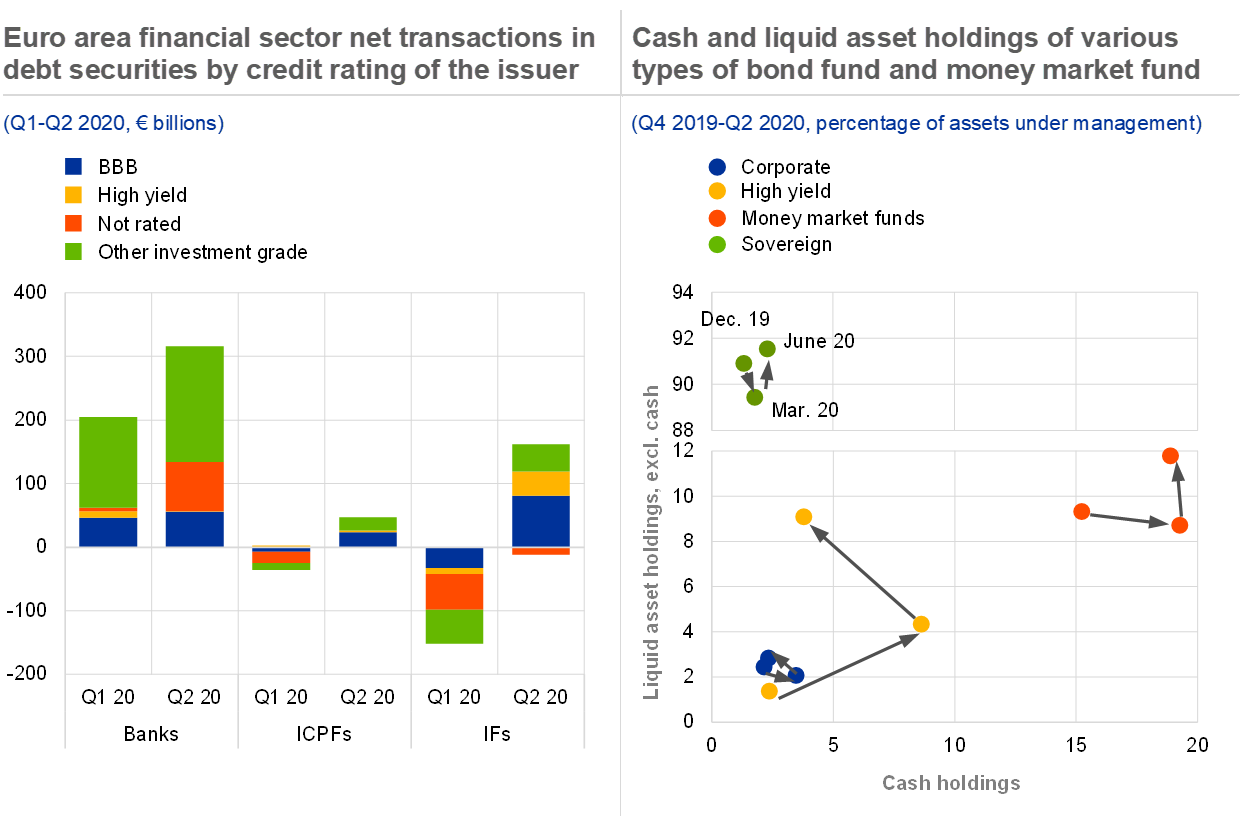
Notes: Left panel: the chart covers all debt securities purchased or sold by euro area banks, insurers, pension funds and investment funds, including those issued by financial and non-financial corporations as well as sovereigns, in the euro area and globally. ICPFs: insurance corporations and pension funds; IFs: investment funds. Right panel: liquid holdings comprise Level 1 high-quality liquid assets (the concept from Basel III banking regulation) consisting of euro-denominated bonds issued by EU governments and non-euro-denominated bonds issued by foreign governments, rated at least AA. Data refer to euro area-domiciled bond funds and money market funds only. High-yield bond funds refer to euro area-domiciled funds which primarily invest in high-yield bonds. This sample is distinct from the corporate bond fund sample, which has a broader investment focus.
Non-bank financial intermediaries appear to have increased their risk-taking (see Chart 4, left panel). The non-bank financial sector continued to provide significant financing for firms after the initial coronavirus shock. However, following a return of inflows in recent months, euro area investment funds have increased their longer-duration and lower-rated non-financial corporate (NFC) debt exposures, increasing the likelihood of outflows and losses if corporate credit risk rises materially. After a temporary increase in cash positions following the March turmoil and despite significant inflows, cash holdings of corporate bond funds have reverted to previous levels (see Chart 4, right panel). Bond funds have increased the share of liquid bonds in their portfolios, but the fund sector as a whole has ventured further into less liquid assets. This leaves funds vulnerable to large outflows in the event of possible future turmoil. While insurers’ aggregate liquidity positions appear stable, cash needs, for example arising from margin calls, might rise if the risk of renewed market volatility were to materialise. Profitability pressures arising from lower underwriting volumes and higher claim provisions stemming from both the pandemic and a relatively large number of natural catastrophes in 2020 could induce insurers to further rebalance their portfolios towards higher-yielding, but riskier assets.
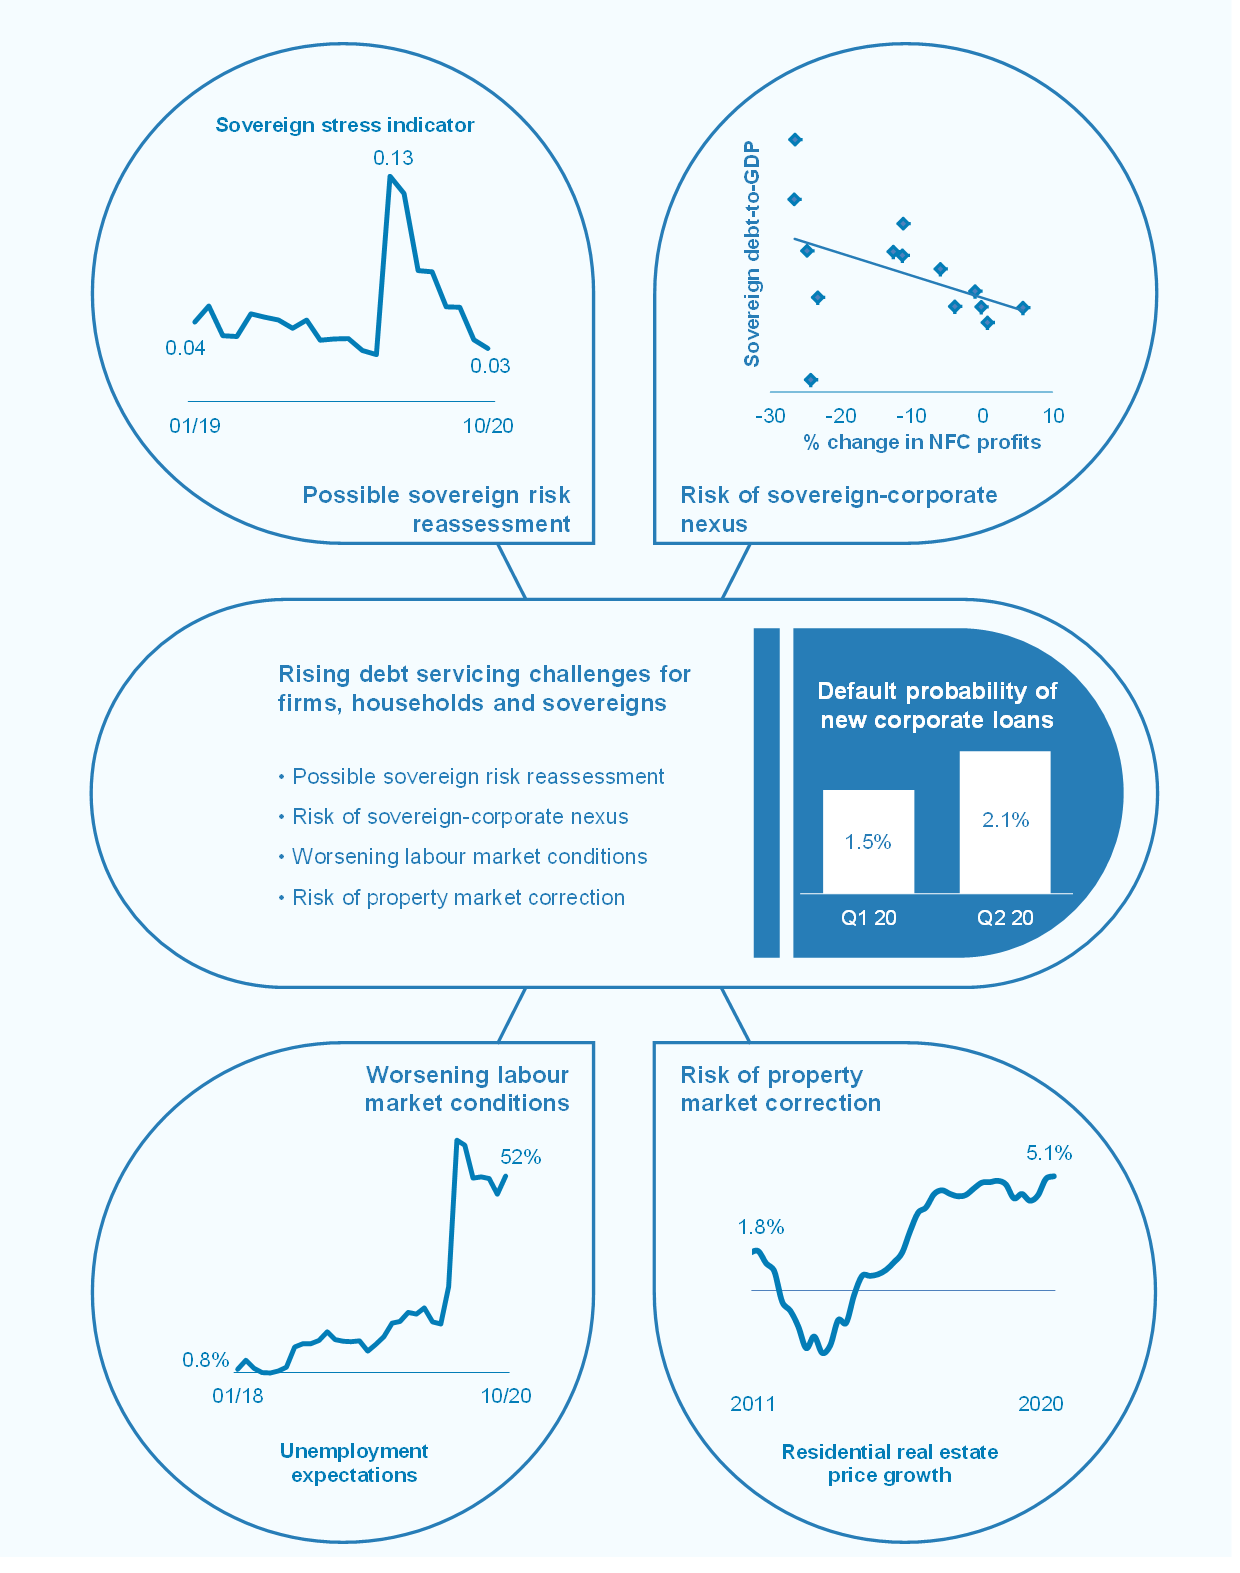
Rising fragilities among firms, households and sovereigns amid higher debt burdens and reliance on policy support
Balance sheet vulnerabilities in the public and non-financial private sectors have increased markedly in the wake of the pandemic. Debt-to-GDP ratios across sectors have risen to even more elevated levels in many euro area countries (see Chart 5, left panel). In particular, sovereign debt levels rose sharply as governments have financed extensive support to the economy in order to boost healthcare services, replace lost incomes and protect firms. This rise in debt ratios should reverse partially once GDP recovers, but the reversal is unlikely to be complete. Contingent liabilities could increase sovereign debt levels further if the economic situation deteriorates and loan guarantees are called. At the same time, firms have been drawing down on credit lines and have issued large amounts of bonds to meet liquidity needs, pushing corporate debt levels higher in many countries, in particular in the lowest investment-grade and high-yield segments (see Chapter 2). Household balance sheets have been affected modestly so far, thanks to government income support schemes, record high saving rates and continued robust developments in euro area residential property markets. Even so, households in a number of euro area countries continue to be burdened by high legacy debt.
Chart 5
Debt sustainability concerns are on the rise, but mitigated in the near term by favourable financing conditions and large-scale supranational support

Sources: ECB, European Commission and ECB calculations.
Notes: Left panel: the non-financial private sector comprises households and non-financial corporations, including debt relating to special-purpose entities. Non-financial private sector debt figures are on a consolidated basis. The horizontal line represents the threshold of 133% of GDP for non-financial private sector debt based on the European Commission’s macroeconomic imbalance procedure (MIP) scoreboard. The vertical line represents the threshold of 60% of GDP for sovereign debt as defined in the excessive deficit procedure under the Maastricht Treaty. Consolidated non-financial corporate debt figures also include cross-border inter-company loans, which tend to account for a significant part of debt in countries where a large number of foreign entities, often multinational groups, are located (e.g. Belgium, Cyprus, Ireland, Luxembourg and the Netherlands). Right panel: EIB: European Investment Bank; ESM: European Stability Mechanism; NGEU: Next Generation EU; SURE: European instrument for temporary Support to mitigate Unemployment Risks in an Emergency.
Favourable financing conditions and supranational support schemes alleviate near-term debt sustainability concerns. The availability and cost of funding have improved across sectors since the end of March on the back of large-scale monetary policy support, while the provisional agreement on the EU recovery fund in July has also helped stem the re-emergence of fragmentation in euro area sovereign bond markets. In the year to date, euro area governments have issued more than €1 trillion of debt on a net basis (see Chart 5, right panel) to finance a range of support schemes. But a large part of this new debt has been issued at the short end of the maturity spectrum, which increases near-term rollover risks. Similarly, euro area investment-grade firms issued record amounts in corporate bond markets in 2020, and high-yield companies’ debt issuance has rebounded markedly in recent months.
While supporting aggregate demand, higher indebtedness in the non-financial private and public sectors increases risks to financial stability in the medium term. In addition to mitigating the economic fallout from the pandemic and helping economic growth to recover more quickly, government support to the private sector can also be supportive of medium-term debt sustainability. However, higher sovereign and corporate debt levels may also reignite debt sustainability concerns in the future, especially in the event of a slower economic recovery than currently expected or if market participants were to reassess sovereign and/or corporate credit risk. Similarly, if interest rates were to normalise, risks could materialise in the medium term due to a rise in debt servicing costs, in particular in countries with elevated debt levels and a predominance of floating rate contracts.
Chart 6
Euro area non-financial firms and households are cushioned for the time being by various government support measures, but cliff-edge risks loom large

Sources: European Banking Authority, national authorities, Eurostat, ECB and ECB calculations.
Notes: Left panel: data on guaranteed loans capture information for the five largest euro area countries in terms of GDP, i.e. Germany, Italy, France, Spain and the Netherlands. Right panel: no data on jobs supported by government measures are available for Greece, Luxembourg, Malta or Finland, while the latest available data points from April were used for Cyprus and Italy.
An abrupt end to government policy support schemes would pose cliff-edge risks to the debt servicing capacity of euro area firms and households. The resilience of the non-financial private sector depends on the path of the economic recovery and the time span, breadth and effectiveness of government support measures. To overcome liquidity pressures, governments stepped in with loan guarantee schemes and direct transfers, while loan moratoria alleviated firms’ near-term debt servicing pressures. By the end of August 2020 guaranteed loans and loans under moratoria accounted for 7% and 15% respectively of the total stock of euro area corporate loans (see Chart 6, left panel). Already fragile corporate fundamentals could weaken further in the event of a premature withdrawal of government support and translate into sharply increasing default rates (see Box 1). This is particularly true for riskier firms, which have levered up in recent years amid low funding costs and now face downgrade risk. Similarly, policy action (including short-time work schemes, government transfers and public loan moratoria) to safeguard employment, income and debt servicing capacity mitigates the risks arising from the pandemic for euro area households. Households in countries with greater reliance on support measures seem more exposed to cliff-edge risks (see Chart 6, right panel). The materialisation of such risks could have a knock-on effect on economic activity and an adverse impact on banks’ balance sheets and capitalisation (see Special Feature A).
Euro area banks are well capitalised, but face credit losses and weak profitability prospects
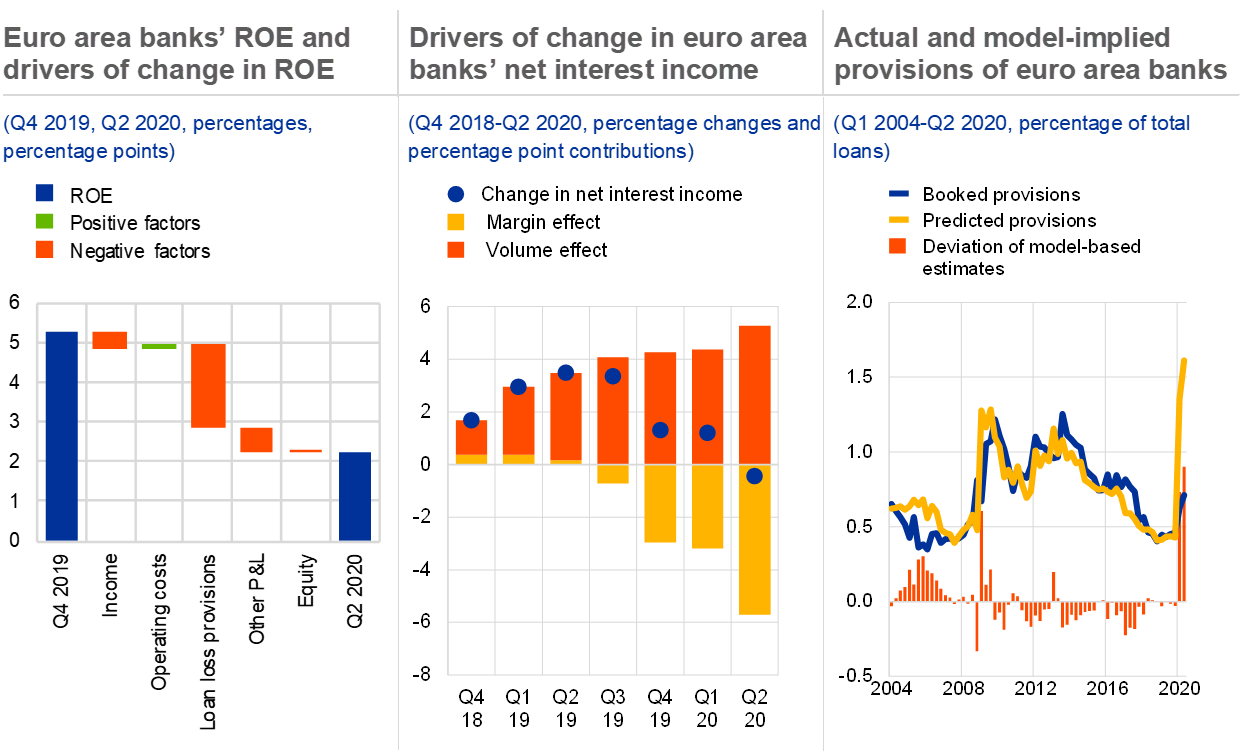
Despite the increased resilience of euro area banks since the global financial crisis, weak profitability prospects continue to weigh on bank valuations. The first half of 2020 saw a marked decline in euro area banks’ return on equity (ROE), from over 5% in the fourth quarter of 2019 to just above 2% in the second quarter of 2020. This change was driven predominantly by higher loan loss provisions and banks’ impaired income-generation capacity as a result of the economic fallout from the pandemic. Cost reductions have only partially offset this (see Chart 7, left panel). Looking ahead, bank profitability is expected to remain weak and to recover only very gradually to levels seen before the outbreak of the pandemic. Market analysts have revised down their ROE forecasts for euro area banks on account of higher expected credit losses. This weak profitability outlook is also reflected in historically low bank valuations (see Chapter 3).
Downside risks to bank profitability arise from a weaker outlook for lending volumes and signs of optimistic provisioning. In an environment characterised by low interest rates, an expected increase in credit losses, tightening credit standards and the phasing-out of state guarantees, euro area banks may find it increasingly difficult to generate income by compensating for lower margins with higher lending volumes (see Chart 7, middle panel). This may translate into lower profits or even losses going forward. At the same time, euro area banks have continued to set aside loan loss provisions to cover higher expected credit losses as they are increasingly confronted with missed payments and a growing number of corporate defaults. But provisioning remains below levels observed during previous crises and those in other jurisdictions, notably the United States. Provisioning levels are also lower than what would have been suggested by historical regularities (see Chart 7, right panel, and Chapter 3), although this may be partly explained by the impact of extraordinary policy measures in reducing credit risk (see Box 5). A weaker than expected economic recovery or premature end of loan guarantees coupled with growing vulnerabilities in the non-financial private sector may entail higher loan loss provisioning needs and weigh on bank profitability.
Chart 7
Bank profitability fell markedly due to continued margin compression and higher loan loss provisioning, which still seems lower than suggested by fundamentals
Sources: ECB supervisory data and ECB calculations.
Notes: Left panel: the return on equity figure for the second quarter of 2020 depends on the way net income is annualised. In the FSR, the four-quarter average of total equity is used in the denominator, while net income is annualised using four-quarter trailing sums. ECB Banking Supervision annualises quarterly/semi-annual data by multiplying it by four/two respectively, resulting in a different headline profitability figure. Right panel: the decomposition is based on a bank-level panel model for the provisions-to-total loans ratio. The explanatory variables and estimated signs (in brackets) are as follows: asset quality factors: non-performing assets ratio (+), annual change in non-performing assets ratio (+) and reserves/non-performing assets (+), pre-provision return on assets (+), loans/total assets (+), log of total assets (+); macro factors: output gap (-) and annual real GDP growth (-), year fixed effects, country fixed effects. The model does not include the impact of policy support measures. The model is estimated on a quarterly unbalanced panel covering around 60 euro area banks between the first quarter of 2000 and the second quarter of 2020.The in-sample fit of the model is fairly good with an adjusted R-squared of around 55%. The estimated year fixed effect for 2020 is highly negative at -1.22% and statistically significant at the 1% confidence level.
Vulnerabilities in the sovereign and corporate sectors could test euro area banks in the future. Euro area banks have significantly increased their lending to non-financial corporations during the pandemic. Guarantees and moratoria appear to have lengthened the time it takes for weak economic performance to translate into credit losses and non-performing loans (NPLs). However, higher volumes of lending to corporates could imply additional credit risk exposures, especially for banks in countries with a high legacy stock of corporate NPLs (see Chart 8, left panel). Guarantees and moratoria may harbour the risk of forbearance going forward. At the same time, banks in some countries have increased their domestic sovereign debt holdings, triggering concerns that the sovereign-bank nexus could re-emerge (see Box 4). Vulnerabilities intensifying in one sector could spill over to other sectors, leading to an adverse sovereign-corporate-bank feedback loop as well.
Chart 8
Resurfacing sovereign-bank nexus and worsening corporate credit quality coupled with climate-related transition risks may challenge euro area banks in the future

Sources: ECB (balance sheet item statistics and supervisory data), Bloomberg Finance L.P., Reuters, Refinitiv and ECB calculations.
Notes: Left panel: white bubbles indicate negative values. There are no ten-year sovereign debt securities for Latvia and Estonia; two-year sovereign bond yields are shown instead as a proxy for Latvia, whereas no suitable proxy could be identified for Estonia. The red horizontal and vertical lines indicate sample medians. Right panel: the x-axis shows the share of banks’ exposures to coronavirus-sensitive sectors in total exposures. Coronavirus-sensitive sectors are defined in line with the May 2020 FSR and include mining, manufacturing, retail and wholesale trade, transport, accommodation and food services, and arts and entertainment. The data refer to the second quarter of 2020. The y-axis shows the bank average volume-weighted emission intensity using direct and indirect energy-related carbon emissions of firms. Emission intensities are calculated as emissions over sales and are averaged over all firms to which banks have large exposures; these averages are then weighted by the share of each bank’s exposure to a firm compared with the banks’ total large exposures. The sample comprises 28 significant institutions for which at least ten large exposures can be matched with emission data. The data refer to the fourth quarter of 2019. The red horizontal and vertical lines indicate sample medians.
Euro area banks must also manage legacy structural problems and the increasing need to address climate risk. In particular, low cost-efficiency, limited revenue diversification and overcapacity afflict the euro area banking sector. Banks appear to have stepped up cost-cutting efforts as a result of the pandemic by further reducing the number of staff and branches, but low profitability may hinder meeting digital transformation needs. Consolidation via mergers and acquisitions (M&As) could be one potential avenue for reducing overcapacity in the sector. While M&A activity, both within and across borders, has been subdued in recent years in the euro area banking sector, the planned domestic mergers in some countries provide an encouraging sign. This process should be market-driven, but authorities may support it by completing the banking union and removing barriers to consolidation, as implied, for example, by differences in national insolvency and taxation regimes. In parallel, banks face increasing urgency to manage the implications of the transition to a greener economy. Medium-term risks may emerge for banks heavily exposed to sectors with high carbon emissions (see Chart 8, right panel).
Policymakers need to avoid near-term cliff-edge risks, while also considering medium-term vulnerabilities
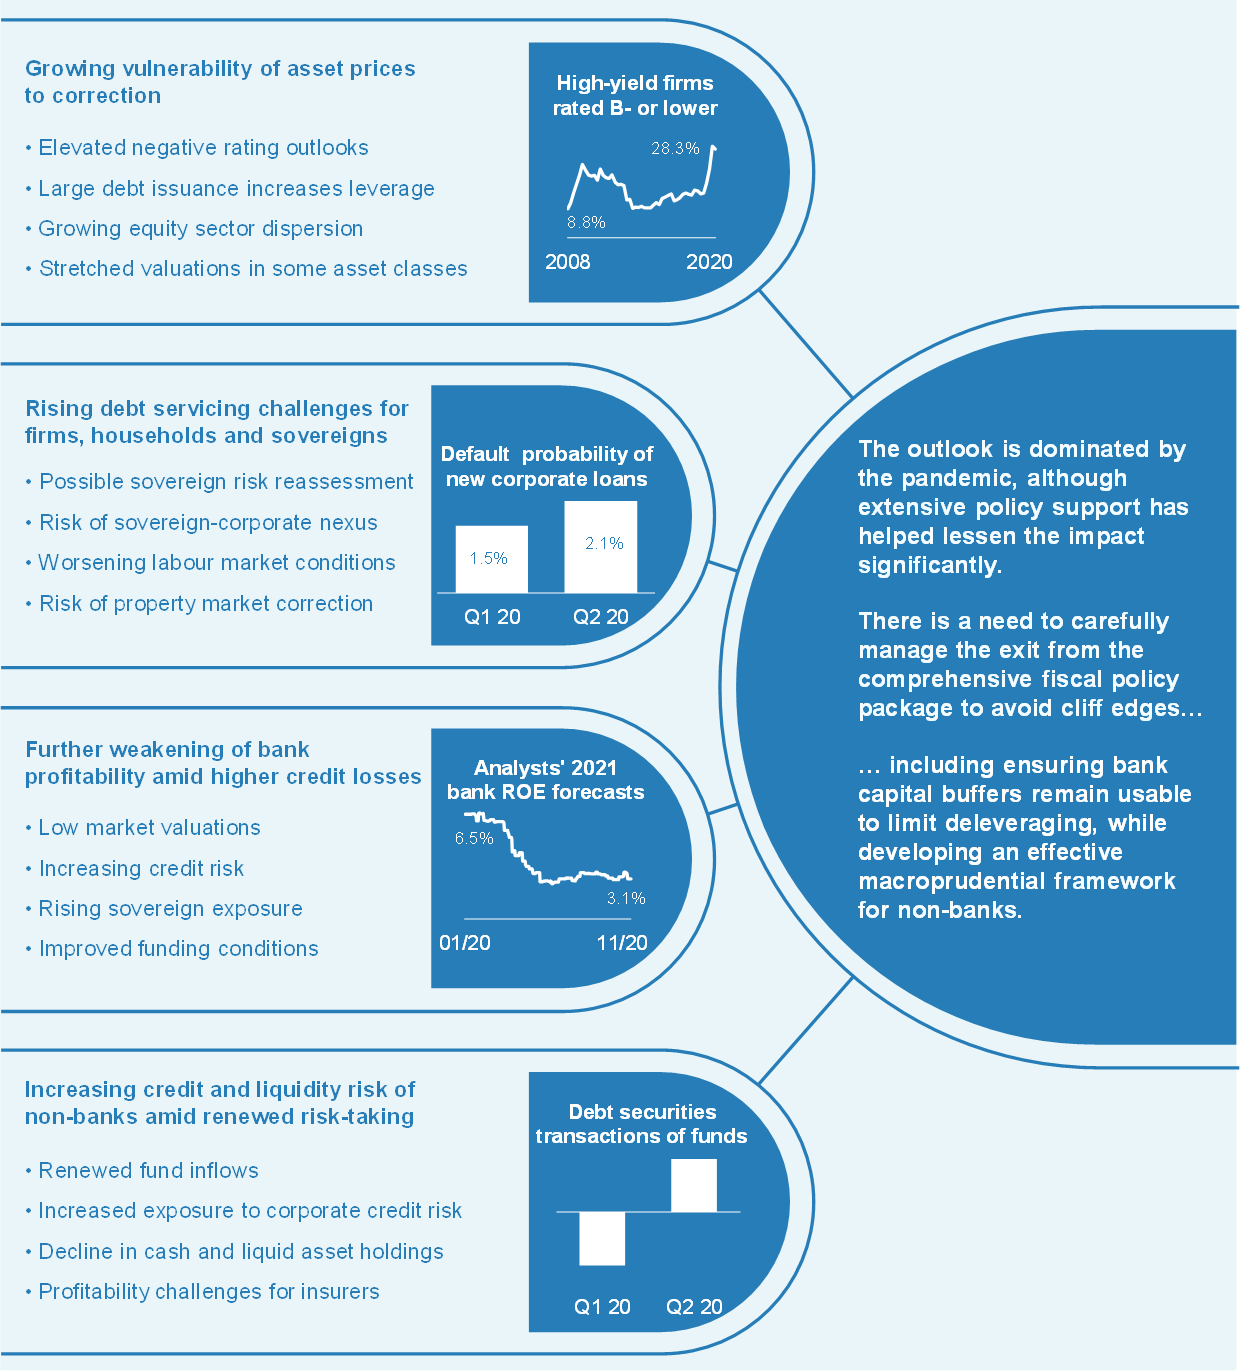
The importance of policy measures in containing the economic and financial stability impact of the pandemic makes managing the exit from this support equally important. Economic and financial sector policy measures have so far limited the materialisation of credit risk and adverse feedback loops between the real economy and the financial system. A continued, powerful and targeted policy response is vital to protect the economy, until the pandemic passes. Even then, risks for households and firms facing a cliff edge from the withdrawal of policy support must be balanced against the risks related to prolonged support (e.g. possible misallocation of capital, postponed loss recognition, etc.). Looking ahead, medium-term vulnerabilities for euro area financial stability have remained elevated and relate to: (i) a mispricing of some asset classes and possible corrections in markets; (ii) growing fragilities in the non-financial private and public sectors; (iii) weaker bank profitability in the light of lower interest rates and expected higher credit losses; and (iv) renewed risk-taking by non-banks, in particular investment funds. The potential for these vulnerabilities to materialise simultaneously and possibly amplify each other further increases the risks to financial stability.
Bank capital buffers should remain available to absorb losses for an extended period, and any impediments to banks using buffers should be addressed. Ensuring that banks are willing to use capital buffers if losses arise in the coming months is crucial to averting the risk of bank deleveraging and a credit crunch. In particular, against the backdrop of limited bank capital-generation capacity, communication about future buffer replenishment can play an important role in ensuring that banks are willing to use buffers if needed.
Near-term actions need to be accompanied by policy planning for medium-to-long-term risks. While policymakers focus mostly on addressing the immediate situation, attention also needs to be paid to a number of risks that could arise further ahead. First, in the face of an uneven recovery, integrated and resilient markets could be supported by completing the banking union and achieving progress in establishing the capital markets union (CMU), including enhancing the regulatory framework for non-banks in a way which reflects macroprudential perspectives (see Figure 1). Second, while facilitating the financing of the transition to a carbon-neutral economy offers opportunities for financial integration and growth, the financial stability risks posed by climate change must be managed. Finally, the experience of recent months shows the benefits of releasable bank capital and suggests rebalancing capital requirements to create macroprudential policy space in the medium term.
Figure 1
Policy roadmap

Source: ECB.
1 Macro-financial and credit environment
1.1 Policy support facilitates a rebound, but an uneven and protracted recovery looms
The resurgence of coronavirus cases in autumn dampened the economic recovery as governments reintroduced tighter albeit more targeted restrictions. As new cases declined in late spring, authorities began to ease the strict social distancing measures that had aimed to control the initial spread of the virus (see Chart 1.1, left and middle panels). At the same time, the major fiscal and monetary policy measures had started to take effect, which supported a sharp rebound in economic activity and business confidence over the summer (see Chart 1.1, right panel). Although the resurgence of infections since August has triggered a renewed tightening of restrictions, these have become more targeted (see Chart 1.1, middle panel), thereby limiting their overall economic impact somewhat. Nonetheless, there have already been signs of weaker business confidence and economic activity (see Chart 1.1, right panel).
Chart 1.1
Rebound in business confidence slows down as resurging infections trigger reintroduction of tighter albeit more targeted government restrictions
Sources: Eurostat, Google LLC "Google COVID-19 Community Mobility Reports" (accessed: 17/11/2020) and European Commission business and consumer confidence surveys. For data on government stringency, test positivity rates and COVID-19-related deaths see sources and notes of Chart 1, in the Overview.
Notes: Left panel: seven-day moving average of the share of positive new COVID-19 cases among all new cases (in %) and new deaths (in thousands) in the euro area. Middle panel: essential activities refer to closure of work places, schools and public transport as well as stay-at-home orders and restrictions on domestic travel. Non-essential activities refer to events, public gatherings and international travel. An index of one indicates the maximum possible stringency on an ordinal scale of that measure. The measures reflect and unweighted average across euro area countries. Right panel: drop in business confidence relative to December 2019 normalised by the standard deviation of the respective indicator.
The economic impact of the pandemic is highly skewed towards sectors that are directly affected by social distancing measures. While government restrictions were broad-based during the first wave of the pandemic, the current restrictions are more focused on activities judged as particularly conducive to spreading the virus, such as public gatherings and travel (see Chart 1.1, middle panel). Together with the more cautious behaviour of consumers, these targeted restrictions have weighed on consumption in general and in particular for those sectors that are most exposed to social distancing measures. The output contraction is therefore much more asymmetric across sectors than in previous crises (see Chart 1.2, left panel).
Governmental support to firms has preserved production capacity so far, but this could be challenged if the economic situation deteriorates further. Loan guarantees, loan moratoria, tax deferrals and direct transfers have alleviated immediate liquidity constraints for many companies, containing insolvencies during the first wave of the pandemic in spring. In labour markets, companies reduced labour input by cutting hours instead of laying off employees which was supported by short-time work schemes (see Chart 1.2, right panel). This adjustment mostly along the intensive margin (i.e. average hours worked) is mirrored by a more limited increase in unemployment compared with the global financial crisis (GFC) so far, even though total employment declined more than in the first half of 2009 due to substantial flows to inactivity. At the same time, these liquidity-providing support measures may become less effective if the economic situation deteriorates further and liquidity constraints morph into solvency issues.
Chart 1.2
Disproportionate output loss in sectors most affected by social distancing, but unemployment increase remains muted as firms cut hours

Sources: Eurostat and ECB calculations.
Notes: Left panel: distribution shows sectoral growth rates at the country level for ten sectors. Dashed lines reflect the means of the respective distribution. Right panel: the decomposition assumes that population remained constant and that changes in hours are only explained by the intensive margin, i.e. average hours worked, and net flows between employment, unemployment and inactivity. The residual reflects the multiplicative term in the stock-flow equations, i.e. the interaction between the extensive and intensive margins.
With cases resurging, the outlook for real GDP growth has weakened since the May FSR and remains highly uncertain. Since the previous FSR, market analysts have revised their projections for GDP growth in 2021 down from 6.2% in May to 4.7% in November (see Chart 1.3, left panel), which is roughly in line with the latest ECB staff macroeconomic projections in September (5%). Notably the upside risk of a sharp rebound in 2021 has receded substantially, pointing towards a more prolonged recession than expected in May. Although to a lesser extent when compared with May, these GDP forecasts remain highly dispersed, reflecting the uncertain macroeconomic outlook, which further weighs on consumer and business confidence. Forward-looking indicators, such as non-financial firms’ assessments of their order books or consumers’ plans for major purchases in the next year, therefore remain subdued.
A premature withdrawal of policy support and a protracted pandemic could prolong the recession and have permanent scarring effects. While policy support will need to be withdrawn eventually, an abrupt end to the ongoing measures could give rise to cliff effects and result in a more severe economic contraction than during the first wave of the pandemic. In addition, the spread as well as the eventual duration of the pandemic remain highly uncertain, with the tail risk of a prolonged period of social distancing measures. In particular firms that are most affected by social distancing may therefore face severe solvency issues or a more permanent disruption to their business models, the longer the pandemic lasts, even as the rest of the economy recovers. This risk is exacerbated by the already high leverage of many corporates, households and sovereigns following the first wave of the pandemic (see the remainder of Chapter 1).
Chart 1.3
Deterioration in the outlook, pointing to a more protracted recovery, as global risks are dominated by economic policy uncertainty due to the pandemic

Sources: Eurostat, Consensus Economics, policyuncertainty.com and ECB calculations.
Notes: Left panel: the dashed vertical lines represent the average real GDP growth forecast values. Right panel: Global Economic Policy Uncertainty until September 2020, World Trade Uncertainty covers data until Q3 2020 and Geopolitical Risk until August 2020.
Economic policy uncertainty amid the pandemic clouds the global economic outlook, even though geopolitical risks and trade uncertainty are receding. The timing and depth of the coronavirus crisis vary substantially across countries. While the Chinese economy rebounded strongly in the second quarter of 2020, other emerging market economies, as well as the United States and the United Kingdom, are experiencing protracted health and economic crises. Accordingly, the Global Economic Policy Uncertainty Index reached record highs in the first half of 2020, receding only partially since then (see Chart 1.3, right panel). This is also reflected in a subdued recovery of gross trade flows of the euro area with the rest of the world, despite the decrease in trade uncertainty. At the same time, emerging market economies face elevated financial and external sector vulnerabilities as governments have increased their debt levels amid the pandemic and have limited fiscal space to support the sluggish recovery.
Financial stability risks related to a possible no-deal Brexit at the end of the year are mostly contained and authorities have prepared for this scenario. The impact on the euro area economy of a sudden shift to WTO trading rules is currently assessed to be contained, though not negligible. Such a scenario could intensify macro-financial risks to the euro area economic outlook in the light of the ongoing global shock related to the pandemic. A possible no-deal scenario would probably also trigger substantial financial market volatility and an increase in risk premia. This could become a source of concern before the end of the year as financial markets start to price in the most likely outcome of negotiations between the United Kingdom and the EU. Cliff-edge risks in the area of centrally cleared derivatives have been addressed via the time-limited equivalence decision of the European Commission for UK central counterparties adopted on 21 September 2020. The ECB expects EU market participants to heed the Commission’s call for the industry “to develop a clear process to reduce their exposures and reliance on UK CCPs that are systemically important for the Union”, and prepare accordingly.[1] The ECB will contribute to ESMA’s comprehensive review of the systemic importance of UK CCPs and their clearing services,[2] and support any appropriate measures to preserve the EU’s financial stability. This includes examining whether the euro-denominated clearing services provided by UK CCPs are of such substantial importance for the EU financial system that UK CCPs should not be recognised to provide such clearing services. The private sector has means at its disposal to mitigate outstanding risks related to the end of the transition period in a number of other areas, such as the continuity of uncleared derivatives contracts.[3] It is important that the private sector uses the remaining time to prepare for all possible contingencies and that banks continue to progress towards their target operating models within the timelines previously agreed with their supervisors.[4] The ECB will continue to monitor risks very closely and stands ready to provide, if needed, additional liquidity in euro and foreign currencies.
1.2 Rising medium-term sovereign debt sustainability risks
The fiscal response to the pandemic entails sizeable budget deficits in 2020, which are expected to decline in 2021. Governments across the euro area have deployed a wide range of fiscal support measures in response to the pandemic. Although the swift support for households and corporates has pre-empted an even deeper contraction (see Special Feature A), it is leading to large fiscal deficits among euro area countries in 2020. A smaller cyclically adjusted deficit of -2.9% is currently projected for the euro area in 2021 as some temporary fiscal support measures are expected to be reversed, implying a slightly tighter fiscal stance in the coming year (see Chart 1.4, left panel). A fiscal tightening at a time when output gaps are still projected to be negative could exacerbate the current economic situation. That said, in 2020, euro area countries that recorded a larger output gap in general adopted a tighter fiscal stance. However, in 2021 this pattern is projected to reverse and the fiscal stance of countries will be more aligned with their expected output gaps, although fiscal developments will inevitably depend on the evolution of the pandemic and governments’ response to it.
Chart 1.4
Large fiscal deficits and falling output raise sovereign debt ratios

Source: European Commission (AMECO database).
Notes: Left panel: fiscal stance is defined as the change in the cyclically adjusted primary budget balance. Right panel: Data for 2020 on debt and GDP based on European Commission Autumn forecast. The decomposition assumes that only nominal debt or only nominal GDP changed between 2019 and 2020, affecting debt-to-GDP ratios through the numerator and denominator respectively. The interaction effect between changes in the numerator and denominator, which is positive due to the negative co-movement of debt and GDP, is attributed to GDP but of second-order importance quantitatively.
Government debt-to-GDP ratios have increased sharply in 2020, reflecting both an increase in outstanding debt and a drop in GDP. In order to fund the fiscal response to the pandemic, governments have issued close to one trillion euro of net debt in the first ten months of 2020. In addition to this increase in outstanding nominal debt, the drop in GDP has further raised sovereign debt-to-GDP ratios in 2020 compared with the previous year (see Chart 1.4, right panel). While this increase in debt ratios will partially reverse once GDP recovers, the elevated nominal debt levels will have a persistent effect on governments’ debt service needs going forward. Furthermore, higher debt levels imply that governments are more exposed to an abrupt tightening of financing conditions.
Chart 1.5
Cash buffers alleviate short-term debt service needs, while the EU recovery package supports in particular countries most affected by the crisis and with high bond yields

Sources: Bloomberg Finance L.P. and ECB calculations.
Notes: Left panel: cash holdings refer to government accounts at national central banks. Right panel: EU yield refers to the yield of the first COVID-19-related EU bond issued on 20 October with an original maturity of ten years. Sovereign bond yields refer to ten-year benchmark yields in October. NPV gain is computed assuming that only EU countries with an NPV gain would take up the loans and that the envelope is used in full and equally across take-up countries. It is further assumed that all countries with higher funding costs would make use of the Next Generation EU loans, irrespective of possible concerns related to the attached conditions or stigma. Future cash-flow gains are discounted using the ten-year overnight index swap (OIS) forward rate.
Elevated debt service needs are partly alleviated by higher cash buffers and favourable funding conditions in the short run. The additional borrowing by governments since the start of the pandemic has been concentrated at shorter maturities, in particular in securities maturing within the next year (see Chart 1.5, left panel). At the same time, the cash holdings of governments with the Eurosystem have increased markedly since the end of last year. Taking into account these cash buffers, the net debt service needs in the coming year are therefore lower than the increase in gross short-term debt suggests. However, the cash buffers may also be needed to provide additional fiscal support or to accommodate cash outflows if contingent liabilities materialise. The extent to which governments will be able to use their cash buffers to repay their elevated short-term debt in the next year or whether they will roll over the debt into longer maturities therefore crucially depends on the evolution of the pandemic. At the same time, the prevailing low-yield environment implies that sovereign debt servicing costs increase only moderately from 20% to 23% of GDP over the next two years, despite the substantial increase in outstanding debt, which further alleviates governments’ debt service needs in the short term.
The EU recovery package will especially support the most affected countries through a mix of net transfers and loans at favourable refinancing conditions. Once the EU recovery package is operational, the allocation key of its grant component entails net transfers which are partly targeted towards those countries most affected by the pandemic. Furthermore, the €360 billion of loans that will be made available by the EU constitute a favourable refinancing option that is cheaper than the current funding costs of the majority of euro area countries (see Chart 1.5, right panel). Over the lifetime of these loans, the cheaper refinancing conditions imply a net present value gain of up to 1% of gross national income, in particular for countries with high sovereign bond yields. Over the medium-to-long term, the loan component therefore provides additional support for countries with high funding costs whose debt service capacity has been strained by the pandemic. At the same time, the effectiveness of both the loans and the grants from the recovery package hinges on countries deploying these funds for productivity enhancing purposes.
Chart 1.6
Contingent liabilities and the sovereign-corporate nexus are weighing on debt sustainability as the pandemic continues
Sources: European Commission (AMECO database), KfW, French Banking Federation, French Ministry of the Economy, Finance and the Recovery, Italian Banking Association, Instituto de Crédito Oficial, Dutch Banking Association and ECB calculations.
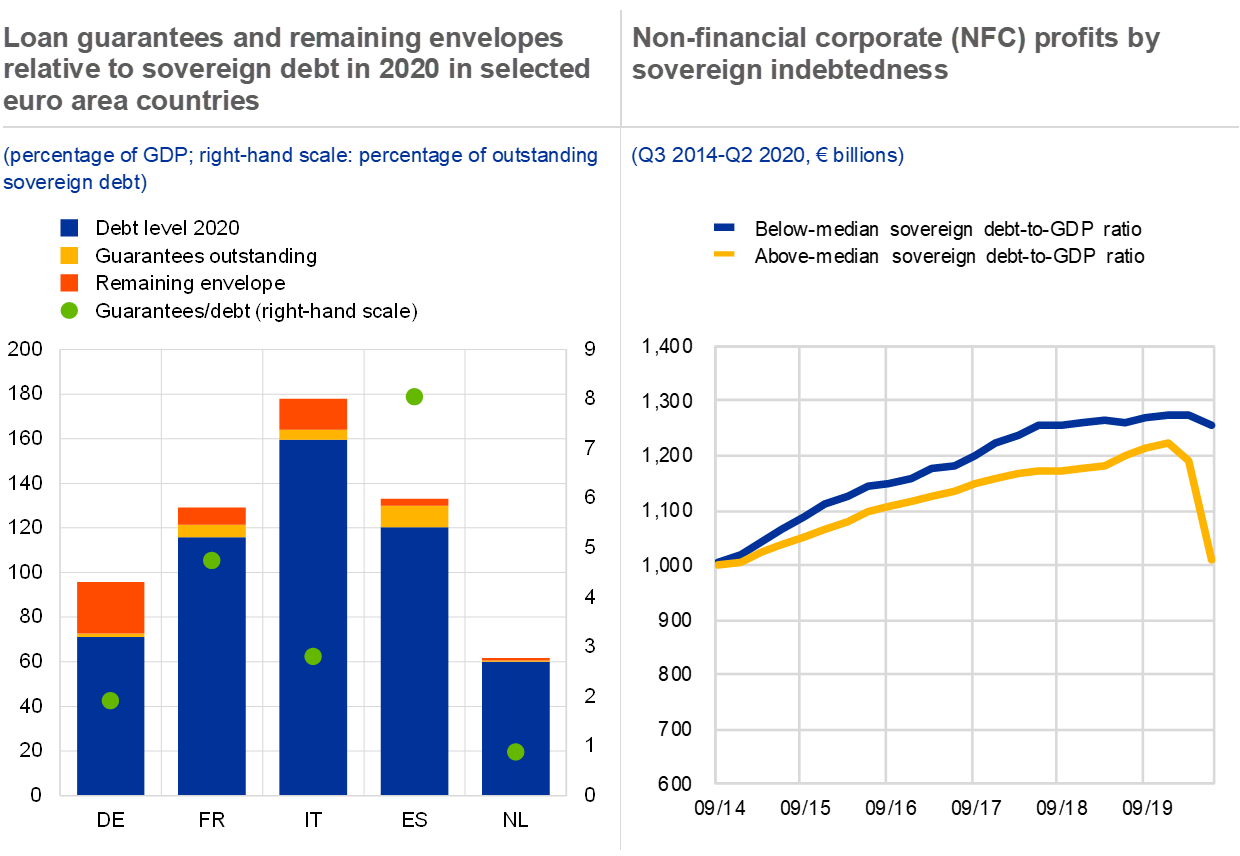
Notes: Left panel: data are based on national sources and cover guarantees committed or announced until end October. “Remaining envelope” denotes announced envelopes of guarantees that have not been committed yet. Right panel: countries are split into highly and less highly indebted based on the median debt-to-GDP ratio of 13 sovereigns in 2019 for which data on the NFC gross operating surplus are available. Highly indebted (above median): ES, FR, BE, PT, IT, GR. Less highly indebted (below/equal to median): EE, NL, IE, FI, DE, SI, AT.
Contingent liabilities could increase sovereign debt levels further, if the economic situation deteriorates and loan guarantees are called. Besides the direct fiscal support measures such as tax cuts and transfers, governments have supported corporates and households by underwriting credit risks through loan guarantee schemes. These contingent liabilities do not immediately affect official government deficit and debt levels, but can be relevant for debt sustainability as they could result in additional cash outflows if the underlying loans do not perform (see Chart 1.6, left panel). In addition to the already committed guarantees, the remaining guarantee envelopes could be used should the economic situation deteriorate, which would further raise the exposure of sovereigns to contingent liabilities.
Highly indebted sovereigns are exposed to corporates that have been particularly affected by the pandemic, creating a sovereign-corporate nexus. The drop in corporate profits has been especially pronounced in countries that already had high debt levels going into the crisis. This is partly due to their different industrial structure which is more dependent on highly affected sectors such as tourism and hospitality, in particular in southern Europe (see Chart 1.6, right panel). This coincidence of stretched sovereign debt ratios and a vulnerable corporate sector gives rise to a sovereign-corporate nexus, especially considering that sovereigns are increasingly exposed to corporates through contingent liabilities.
As governments are backstopping the economy, sovereign vulnerabilities in the medium term have increased, but remain contained in the short run. Governments have stepped in to soften the economic fallout from the pandemic which has increased fiscal deficits and sovereign debt levels. In the short run, mitigating factors such as cash buffers, favourable financing conditions and the agreement on the EU recovery package have contained sovereign vulnerabilities. In addition, the euro area as a whole remains a net creditor globally which limits its reliance on non-euro area external financing. That in turn mitigates the risk that the debt service capacity of sovereigns, as well as firms and households, in the euro area is negatively affected by an abrupt reversal in external capital flows. However, the large exposure of governments to a weaker corporate sector through contingent liabilities and the bleak outlook for the macroeconomy increase the risks to sovereign debt sustainability over the medium term.
1.3 Euro area households cushioned by government support
Despite recent improvement, euro area consumer confidence remains weak, reflecting bleak unemployment expectations and elevated uncertainty (see Chart 1.7, left panel). Survey-based indicators point to higher expectations of unemployment across all main business sectors, albeit with a marked improvement from earlier lows. The retail and services sectors record among the biggest improvement in unemployment expectations, reflecting the effectiveness of short-time work schemes and the easing of lockdown measures. The change in consumer sentiment remains correlated with the economic impact of the pandemic, and coincides with the evolution of new coronavirus cases (see Chart 1.7, right panel).
Chart 1.7
The pandemic maintains a firm grip on euro area consumer sentiment

Sources: ECB, European Commission and JHU CSSE COVID-19 Data.
Notes: Left panel: “Unemployment expectations” are presented using an inverted scale, i.e. an increase (decrease) in the indicator corresponds to more (less) optimistic expectations. This is a survey-based measure reflecting consumer expectations for the number of people that will become unemployed over the next 12 months. Right panel: monthly percentage change of new coronavirus infections per 100,000 inhabitants versus net change in consumer confidence in the euro area. For details on the source, see the notes to Chart 1, left panel, in the Overview.
Government support schemes have shielded the spending capacity and balance sheets of euro area households. Short-time work schemes effectively preserved a large share of employment, thus limiting the decline in aggregate gross wages (see Section 1.1). At the same time, household gross disposable income was cushioned by a substantial increase in net social transfers and temporary tax relief, adding on average 5 percentage points to the annual growth rate in disposable income for the euro area. Despite the support measures, disposable income contracted by 2.7% in the second quarter, mainly due to the decline in compensation paid to employees and falling property income (see Chart 1.8, left panel).
Households’ net worth has been supported by a recovery in the value of financial assets, record savings and still buoyant residential real estate markets (see Chart 1.8, right panel). As a result, aggregate household balance sheets remained strong, with net worth and savings deposits accounting for 7.4 and 4.5 times disposable income respectively, giving some resilience to weather a prolonged period of low economic growth. However, there is large heterogeneity across countries and households. Low-income individuals and countries that already exhibited low economic growth before the pandemic are being hit disproportionally hard.[5] Moreover, the uncertainty surrounding equity markets, high unemployment expectations and a possible decline in housing wealth, coupled with the winding-down of support measures, may weigh on household financial resilience going forward.
Chart 1.8
Household income shielded by government support schemes as social transfers increased, while gains in net worth boosted household resilience

Sources: Eurostat, ECB and ECB calculations.
Notes: Right panel: other changes in non-financial assets mainly include gains and losses on real estate holdings (including land). Other changes in financial assets and liabilities mainly include gains and losses on holdings of shares and other equity, while the changes in net worth due to net saving comprise net saving, net capital transfers received and the discrepancy between financial and non-financial accounts.
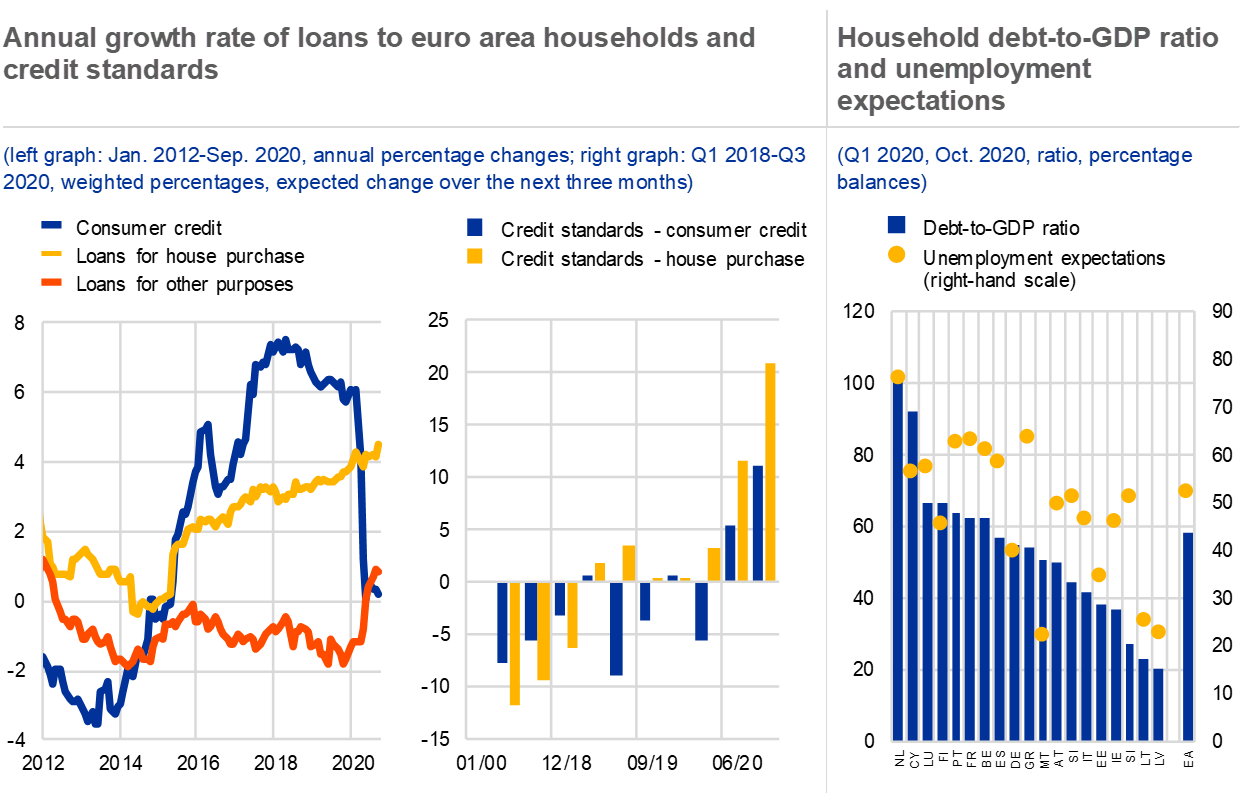
Household borrowing has slowed, and households face tighter lending standards from banks (see Chart 1.9, left panel). Growth in aggregate bank lending to households has fallen by 0.2 percentage points since the start of 2020. Divergent trends across different credit types mirror the heterogeneous impact of the pandemic on the economy. Consumer credit growth dropped from 6% at the start of the year to zero in September, consistent with the fall in demand for durable consumer goods. In contrast, mortgage net lending volumes have been broadly resilient, partly supported by lower loan redemptions. Despite growth moderation since the start of the year, new loan originations for the purpose of house purchase remain at solid levels. Furthermore, banks tightened lending standards across all loan types considerably amid higher risk perceptions and are expected to make them even stricter (see Chart 1.9, middle panel).
Households’ debt sustainability has been supported by government schemes and record low debt servicing costs. So far, the pandemic has had a relatively modest effect on household debt ratios, as income has been largely preserved by government support schemes. Delinquency rates have increased, in particular among the self-employed, but remain close to their long-run average as some euro area countries removed the obligation to file for insolvency. Moreover, loan moratoria have helped households which faced income losses. In addition, debt servicing costs have hit record lows as a result of very low interest rates, with interest payments as a share of disposable income falling below 2.4%. Overall, this means that household debt has been largely cushioned from the economic impact of the pandemic.
Chart 1.9
Bank lending slowed down amid tighter lending standards, as highly indebted households look vulnerable to increasing debt service burdens
Sources: European Commission, Eurostat, euro area bank lending survey, ECB and ECB calculations.
Notes: Left panel: “Loans for other purposes” mainly reflect lending to sole proprietors. “Loans for house purchase” represent 77% of total lending, “Consumer credit” 12% and “Loans for other purposes” 11%. Right panel: “Unemployment expectations” are a survey-based measure reflecting consumer expectations for the number of people that will become unemployed over the next 12 months.
A sustained economic slowdown and a resulting increase in unemployment could weigh on household debt repayment capacity. Countries with buoyant housing markets have also experienced a gradual build-up of household debt in recent years. A protracted economic slowdown could weigh on household incomes or lead to a sharp correction in some property markets, with the effects varying across countries. Moreover, high-debt countries show high unemployment expectations, making them more vulnerable to possible cliff-edge effects from the ending of support (see Chart 1.9, right panel). As a result, whether risks materialise will depend in part on the ability of governments to keep supporting households that experience declining incomes.
1.4 Euro area corporates shielded by government support but facing rising solvency pressures
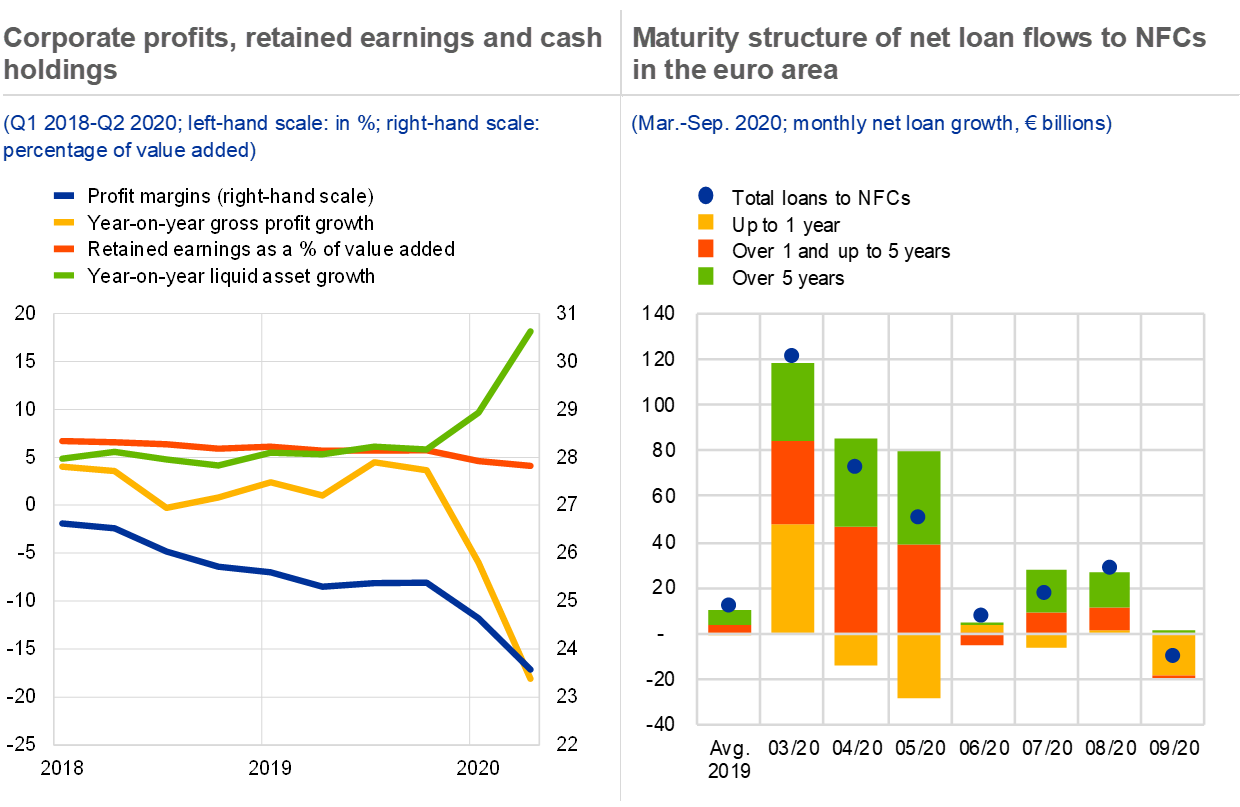
Corporate earnings and profits dropped sharply as economic activity collapsed in March. Corporates experienced a continued deterioration in profits, profit margins and retained earnings as economic activity contracted amid tight social distancing measures (see Chart 1.10, left panel). As a result, corporate vulnerabilities increased substantially in the euro area (see Box 1).
As net loan flows to corporates abated over the summer, firms continued to replace the short-term funding they took on in March with longer-dated loans. During the early phase of the pandemic, firms increased their borrowing from banks substantially to cover their ongoing expenses, relying largely on loans with maturities of up to one year (see Chart 1.10, right panel). Borrowing from banks remained at elevated levels in the second quarter, while corporate debt issuance reached record highs (see Chapter 2). As economic activity rebounded in late spring, both debt issuance and new bank lending slowed down in the third quarter, but remained at solid levels in seasonally adjusted terms. At the same time, firms continued to shift towards longer-maturity debt which reduced the immediate refinancing needs of businesses and allowed them to lock in the currently favourable credit conditions.
Chart 1.10
Corporate profits collapsed and net loan flows rose during the initial lockdowns, but net loan flows slowed as of April as firms shifted towards longer-maturity debt
Sources: Eurostat, ECB (quarterly sectoral accounts and balance sheet item statistics) and ECB calculations.
Notes: Left panel: profit margins are proxied by net operating surplus over value added. Retained earnings are proxied by net savings over value added. Year-on-year growth of gross profits is proxied by the respective growth rate of quarterly gross operating surplus. Liquid assets include currency and deposit holdings. Right panel: net loan growth refers to the net flow of loans to NFCs in a given month and maturity bracket (new issuance minus redemptions). Total loans are seasonally adjusted and therefore differ from the sum of the loans by maturity brackets which are not seasonally adjusted.
Despite an increase in underlying credit risk, credit conditions remain favourable but could tighten if government support ends. Unlike in previous periods of stress, bank lending to non-financial corporations (NFCs) increased substantially at the onset of the pandemic (see Chart 1.10, right panel). At the same time, lending rates remained stable (see Chart 1.11, left panel), which indicates that the increase in credit supply so far has outpaced the surge in credit demand. Governments that provided loan guarantees thereby underwriting credit risk played a crucial role in that context. The guarantees reduced the loss given default of new loans which relieved the upward pressure on rates stemming from higher probabilities of default (PDs) (see Chart 1.11, left panel). In turn, a premature withdrawal or suspension of loan guarantee schemes could cause banks to tighten credit standards further, resulting in a credit crunch for NFCs.
Chart 1.11
Guarantees support funding conditions despite higher credit risk especially for SMEs, but credit standards are tightening

Sources: Left panel: AnaCredit data and euro area bank lending survey (BLS); right panel: AnaCredit data, FINREP and national sources for loan guarantee take-up.
Notes: Left panel: PDs and interest rates on new loans granted to NFCs are based on AnaCredit data. Credit standards reflect backward-looking actual credit standards up to the third quarter of 2020. Right panel: PDs refer to the average PDs weighted by loan size of newly issued loans in that quarter within the respective size category. Guaranteed loans refer to the flow of guaranteed loans by firm size based on national sources for France, Germany, Italy and Spain. The stock of loans by firm size is based on FINREP (supervisory financial reporting) data for the second quarter of 2020 (more recent data not available).
Credit risk has increased for small and medium-sized enterprises (SMEs) in particular, and they are more exposed than larger firms to tightening credit conditions once loan guarantees expire. In the first half of 2020 the credit quality of new loans deteriorated more for SMEs than for large enterprises in the four largest euro area countries (see Chart 1.11, left graph in right panel). Reflecting this pattern, SMEs relied more on state-guaranteed loans than larger companies, with such facilities accounting for 14% of total outstanding loans to SMEs in June (see Chart 1.11, right graph in right panel). In addition, SMEs are generally less likely to have access to market-based funding sources, which leaves them more exposed to a sudden deterioration in bank lending conditions. They are therefore particularly vulnerable to a possible expiration of state guarantees and a subsequent tightening of credit conditions.
Although corporate debt ratios are likely to remain elevated, they may fall back somewhat once the economy recovers. There was a sharp increase in companies’ debt ratios in the first half of 2020, when businesses borrowed more in the face of a contracting economy. A rebound in economic activity would partially reverse these elevated debt ratios, as more than half of the increase in the corporate debt-to-GDP ratio was driven by lower GDP (see Chart 1.12, left panel). Nonetheless, the higher nominal debt levels will have a persistent if not permanent effect on corporate indebtedness unless companies actively deleverage once the economy recovers. If not addressed, these elevated debt ratios could raise corporate debt sustainability concerns in the longer term, even if the economy recovers and GDP returns to pre-pandemic levels.
Chart 1.12
Gross NFC indebtedness increased on the back of lower GDP, while insolvencies are expected to rise despite higher cash holdings

Sources: Left and middle panels: Eurostat, ECB quarterly sectoral accounts and ECB calculations; right panel: Euler Hermes and Allianz Research.
Notes: Left panel: decomposition shows contribution of changes in debt financing (numerator) and changes in GDP (denominator) to changes of NFC debt-to-GDP ratio since the fourth quarter of 2019 (non-consolidated basis). The interaction effect, which is positive due to the negative co-movement of debt and GDP, is attributed to GDP but of second-order importance quantitatively. Middle panel: “Liquid assets” comprise currency and deposits; “Gross debt” includes loans, debt securities and pension entitlements but excludes trade credit; “Net debt” is the difference between gross debt and liquid assets. Right panel: forecast for DE, FR, ES, IT and NL based on a revised version of the Euler Hermes and Allianz Research report dated 24 September, other countries based on previous report dated 16 July. EA* refers to GDP-weighted sample of countries shown in the chart.
Although corporate cash buffers on aggregate mitigate the elevated debt levels, the most affected firms may face severe refinancing constraints. The increase in corporate debt was accompanied by a similarly-sized increase in cash buffers in the corporate sector, implying that net debt remained stable on aggregate (see Chart 1.12, middle panel). However, this overall picture masks substantial heterogeneity reflecting the asymmetric impact of the pandemic across industries (see Section 1.1). While corporates less affected by the pandemic were able to build up cash buffers, those in the worst affected sectors were forced to increase their net debt position and face higher refinancing pressures going forward.
Corporate insolvencies are likely to increase as the pandemic continues and liquidity constraints morph into solvency issues. In the first half of 2020 corporate insolvencies across a range of euro area countries were lower than during the same period in the previous year. This pattern was supported by various policy measures that either explicitly deferred insolvency proceedings or indirectly pre-empted liquidity-driven insolvencies by alleviating cash constraints through loan guarantees and similar schemes. At the same time, many of these measures only postponed companies’ payment needs and increased their debt burden (see Chart 1.12, left panel). Companies that already had stretched balance sheets before the pandemic will therefore face more severe debt sustainability issues going forward. Insolvencies are projected to increase in 2020 and 2021 accordingly (see Chart 1.12, right panel). Similarly, an increasing share of corporate issuers has been downgraded or faces a negative rating outlook (see Chapter 2). The deterioration in corporate solvency would be exacerbated if government support measures were withdrawn prematurely, as viable companies could face a sudden tightening of credit conditions before earnings have sufficiently recovered.
Box 1
Assessing corporate vulnerabilities in the euro area
By bringing much of the euro area economy to a temporary halt, the coronavirus pandemic has threatened the existence of many euro area firms. While liquidity shortages were seen as the major threat to non-financial corporate (NFC) health at the beginning of the pandemic, more recently firms’ solvency has become the primary concern. Without the massive monetary and fiscal support measures, many more viable firms could have been forced into failure by the impact of the pandemic, adding to pressures on the economy and banks. Against this backdrop, this box assesses euro area NFC vulnerabilities and the underlying factors.
More1.5 Euro area property markets at risk of correction
Euro area residential real estate (RRE) prices continued rising throughout the first half of 2020. At the euro area level, nominal house prices increased by around 5% in annual terms in the first half of 2020 (see Chart 1.13, left panel). While prices continued to trend upwards in the euro area as a whole, growth rates varied greatly across countries and between capital cities and rural areas. The resilience to the pandemic observed in housing markets reflects a number of factors. First, supporting measures in the form of payment moratoria and job protection schemes have successfully mitigated its impact on household debt servicing capacity and total wealth. Second, the low interest rate environment continues to put a floor under demand. Finally, contracts signed after the lockdown period may in some cases entail conditions which were established before the lockdown.
Leading indicators point to an uncertain outlook for house price growth (see Chart 1.13, left panel). RRE price growth might face headwinds going forward as a result of a marked decline in GDP, consumer confidence and employment expectations. Moreover, results from the latest ECB bank lending survey indicate that mortgage loan demand moderated in the second quarter of 2020, while banks significantly tightened lending standards amid higher risk perceptions. Tighter lending standards and fading demand could accelerate the slowdown in the euro area housing cycle anticipated for 2021.
In some countries, high household indebtedness makes the housing market even more vulnerable. A number of euro area countries have both household debt-to-disposable income ratios at or above 100% and increasing signs of overvaluation (see Chart 1.13, right panel). A marked rise in unemployment could have a negative impact on debt servicing capacity, which might contribute to a price correction in the RRE market. Whether these risks to RRE prices materialise will depend to a large extent on how far unemployment rises and how far future household income drops when support schemes are scaled back.
Chart 1.13
Despite resilience over the first half of 2020, house prices are expected to moderate against the background of high indebtedness in some euro area countries

Sources: ECB and ECB calculations.
Notes: Left panel: the shaded area denotes the interquartile range of various leading indicators. Leading indicators include: BLS actual and expected lending standards for house purchase loans (inverted), BLS actual and expected demand for house purchase loans, BLS housing market prospects, consumer confidence, services confidence, Purchasing Managers’ Index (PMI) composite index, PMI residential construction index, economic sentiment, real GDP growth, unemployment expectations (inverted), annual change in pure new loans, residential investment growth, construction survey price expectations and the cost of borrowing for house purchase (inverted). Right panel: the size of the bubbles reflects the growth in overvaluation since the first quarter of 2019. Countries with a green bubble recorded a decline in overvaluation. The blue bubble reflects the euro area average. Overvaluation is the average of the price-to-income ratio and the output of an econometric model. The estimates are subject to considerable uncertainty and should be interpreted with caution, and alternative valuation measures can suggest lower/higher estimates of overvaluation.
In contrast with residential markets, the pandemic led to an abrupt and sustained drop in CRE market activity. When lockdown measures were introduced in March and April, activity in the CRE market dropped to around half of the levels seen in previous years (see Chart 1.14, left panel). Moreover, there has been a pronounced increase in the role of international buyers in euro area CRE markets in recent years as a result of the search for yield.[6] The observed decline in transactions has been driven by both euro area and non-euro area investors. However, activity by international buyers has fallen disproportionately (see Chart 1.14, right panel), reflecting the tendency for these buyer types to engage in flight to safety and reallocate funds during times of elevated global economic uncertainty.
Chart 1.14
A sharp and sustained drop in commercial real estate (CRE) market activity, with a shift in buyer composition

Sources: ECB, Real Capital Analytics, Bloomberg Finance L.P. and ECB calculations.
Note: Activity is compared with the same months in previous years, as CRE transaction activity is highly seasonal.
Market valuations suggest that the CRE market may face an extended period of decline. Limited liquidity means that backward-looking measures of price developments may not fully reflect current market dynamics. Market-based valuation indicators such as real estate investment trust (REIT) indices signal a significant decline in market value for the retail and office sectors (see Chart 1.15, left panel). Moreover, there is significant dispersion within the euro area. German price indices indicate a full price recovery, while those in Spain, Italy and France show almost no rebound from pandemic lows. This reflects the uneven economic impact of the pandemic across euro area economies.
A sharper CRE market correction could have implications for bank balance sheets, although exposure varies. Shocks to the CRE sector could feed through to the financial system via increased credit risk, decreased collateral values and losses on direct holdings. Bank lending for CRE purposes accounts for 7% of exposure to the non-financial private sector, although levels vary substantially across countries (see Chart 1.15, right panel). Against this background, a large decline in the value of CRE could contribute to bank vulnerability in some euro area countries in the context of a wider coronavirus shock.
Risks to financial stability stemming from real estate markets have increased further. The CRE sector has been affected by the pandemic faster than the RRE sector and may have entered a period of risk materialisation. Going forward, the demand for housing might slow amid tighter lending standards and deteriorating employment prospects, leading to a further decline in the real estate cycle. Against this background, the financial sector may be exposed to the risk of real estate market corrections, in particular where such exposures are significant, debt levels are elevated and properties are overvalued.
Chart 1.15
CRE assets are still vulnerable to a price correction, which could feed through to bank balance sheets

Sources: Bloomberg Finance L.P., ECB and 2019 SSM credit underwriting data collection for significant institutions.
2 Financial markets

2.1 Recovery and stabilisation in financial markets following policy support
Financial conditions have continued to ease on the back of monetary and fiscal policy measures to almost unprecedentedly accommodative levels. Better than expected macroeconomic data, strong policy support and, most recently, positive news on coronavirus vaccine trials have led to a considerable improvement in global risk sentiment. This has eased global financial conditions to almost unprecedentedly accommodative levels, reflected in narrower credit spreads and recovering equity markets (see Chart 2.1, left panel). Financial conditions remain somewhat tighter in the euro area given the appreciation of the euro and an incomplete equity market recovery. The accommodative financial conditions are largely predicated on the significant monetary and fiscal policy measures. If such measures expire prematurely, or if recently renewed lockdowns are intensified, there is a risk that financial conditions could tighten again.
Improved financial conditions turned investor sentiment in favour of the euro. The improving global risk sentiment and expectations of more accommodative US monetary policy, complete with narrowing real interest rate differentials, contributed to reversing the safe-haven flows into US dollar-denominated assets, leading to an appreciation of the euro. Indicators from options markets and positioning data in futures markets indicate that market sentiment has turned in favour of the euro, but moderated more recently (see Chart 2.1, right panel).
Chart 2.1
Financial conditions ease and investor sentiment turns in favour of the euro

Sources: Refinitiv, Bloomberg Finance L.P., Commodity Futures Trading Commission (CFTC) and ECB calculations.
Notes: Left panel: financial conditions are computed as weighted averages of five daily financial indicators: ten-year government bond yields, short-term interest rates, nominal effective exchange rates (the weighted average of the foreign exchange value of each country's currency against the currencies of its major trading partners), price/earnings ratios and corporate bond spreads, aggregated using GDP purchasing power parity shares of eleven large advanced economies (Australia, Canada, France, Germany, Italy, Japan, New Zealand, Norway, Sweden, the United Kingdom and the United States). FCI: financial conditions index. Right panel: net speculative positioning refers to the EUR/USD net non-commercial position. Risk reversal is the difference between the cost of a three-month EUR/USD call option and put option.
The accommodative monetary policy environment has provided support to financial markets. Central banks around the world have expanded their balance sheets by increasing liquidity operations and launching (targeted) asset purchases in response to the pandemic. Advanced economy central bank balance sheets have ballooned by more than €5 trillion in 2020 to above €20 trillion. This has outpaced any previous expansion and provided extensive support to financial markets (see Chart 2.2, left panel). The ECB has purchased €629 billion of euro area debt securities under the pandemic emergency purchase programme (PEPP) in net cumulative terms as of October and gross take-up was €1,483 billion in the third series of targeted longer-term refinancing operations (TLTRO III) in June and September. Among other things, the liquidity injection has increased demand for overnight cash facilities, contributing to higher euro short-term rate (€STR) transaction volumes than before the pandemic, which has served to confirm its robustness in stressed market conditions. However, the €STR is still not established as a main reference in financial contracts, such as in the overnight index swap (OIS) market where its use remains limited (see Box 2). On 15 March the ECB also announced enhanced provision of US dollar liquidity via the standing US dollar liquidity swap line arrangements, alleviating US dollar funding pressures.
The agreement on the EU recovery fund on 21 July has also supported risk sentiment and sovereign spreads. Despite the implied increase in overall debt issuance in the coming years, the recovery fund has been associated with narrowing sovereign spreads as it will replace some of the national issuance. The fund will add significant amounts of highly rated assets to the euro area sovereign and supranational debt market and may contribute to the further development of the European capital markets union (see Chart 2.2, right panel).[7]
Chart 2.2
Strong policy support has helped to stabilise financial markets, with EU debt issuance expected to provide a large amount of highly rated euro area bonds
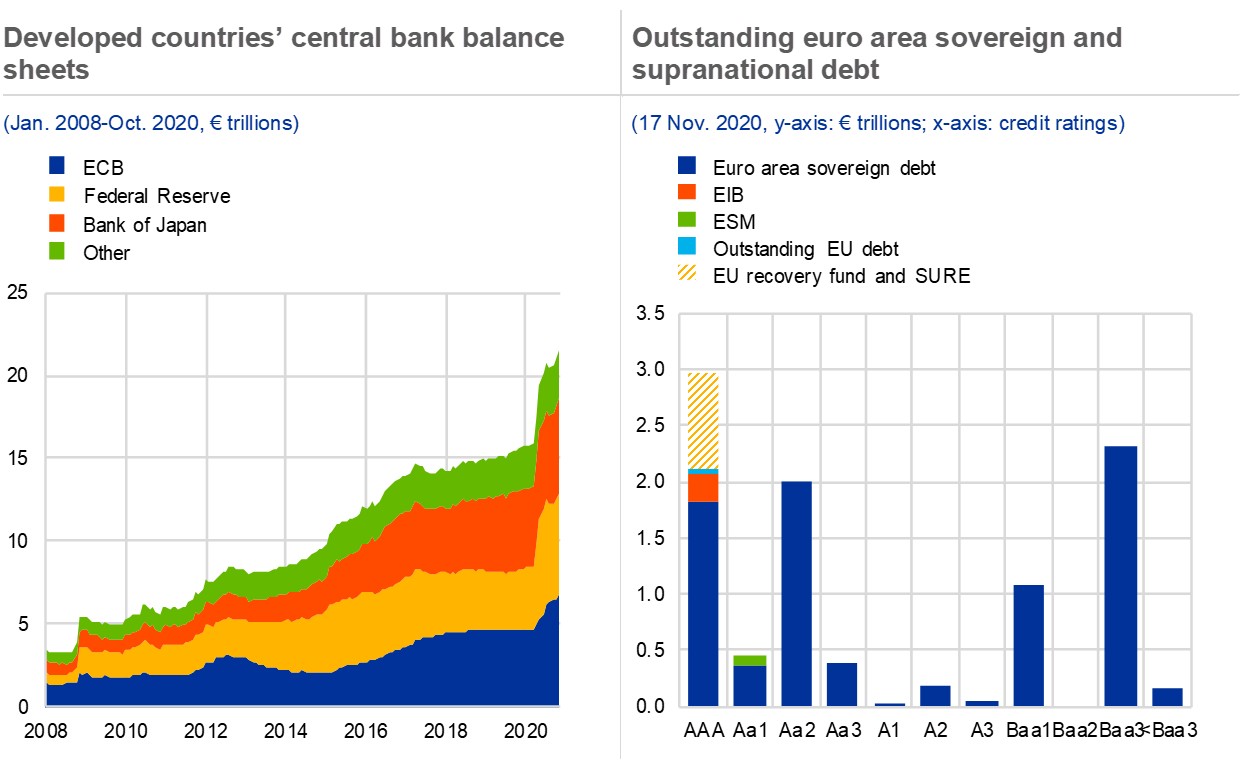
Sources: Bloomberg Finance L.P., respective central bank and ECB calculations.
Notes: Left panel: the “Other” category refers to the balance sheets of the Bank of England, Swiss National Bank, Bank of Canada, Reserve Bank of Australia, Reserve Bank of New Zealand, Sveriges Riksbank and Norges Bank. Right panel: euro-denominated sovereign debt and supranational debt in the euro area. Credit ratings are Moody’s long-term local currency credit rating categories. Outstanding EU debt refers to the end of September 2020. EIB: European Investment Bank; ESM: European Stability Mechanism; SURE: European instrument for temporary Support to mitigate Unemployment Risks in an Emergency.
Euro area sovereign bond yields have continued to decline despite growing indebtedness, but longer-term vulnerabilities have increased. The gradual decline in sovereign yields since the last FSR has been more pronounced in those countries that have been more severely affected by the pandemic and previously recorded larger spread increases. The overall narrowing of sovereign bond spreads has been accompanied by reduced dispersion among individual countries (see Chart 2.3, left panel). The decline in yields has been underpinned by the Eurosystem’s sovereign bond purchases and the EU recovery fund announcement. There have also not been any material sovereign rating actions yet. However, higher indebtedness increases the longer-term vulnerability to refinancing risks arising from an increase in yields, stemming for example from faltering growth or sovereign rating downgrades. This may also lead to feedback loops where rising risk premia and higher debt levels may be mutually reinforcing.[8]
Chart 2.3
Sovereign bond market fragmentation pressures have eased and asset price inflation has resumed
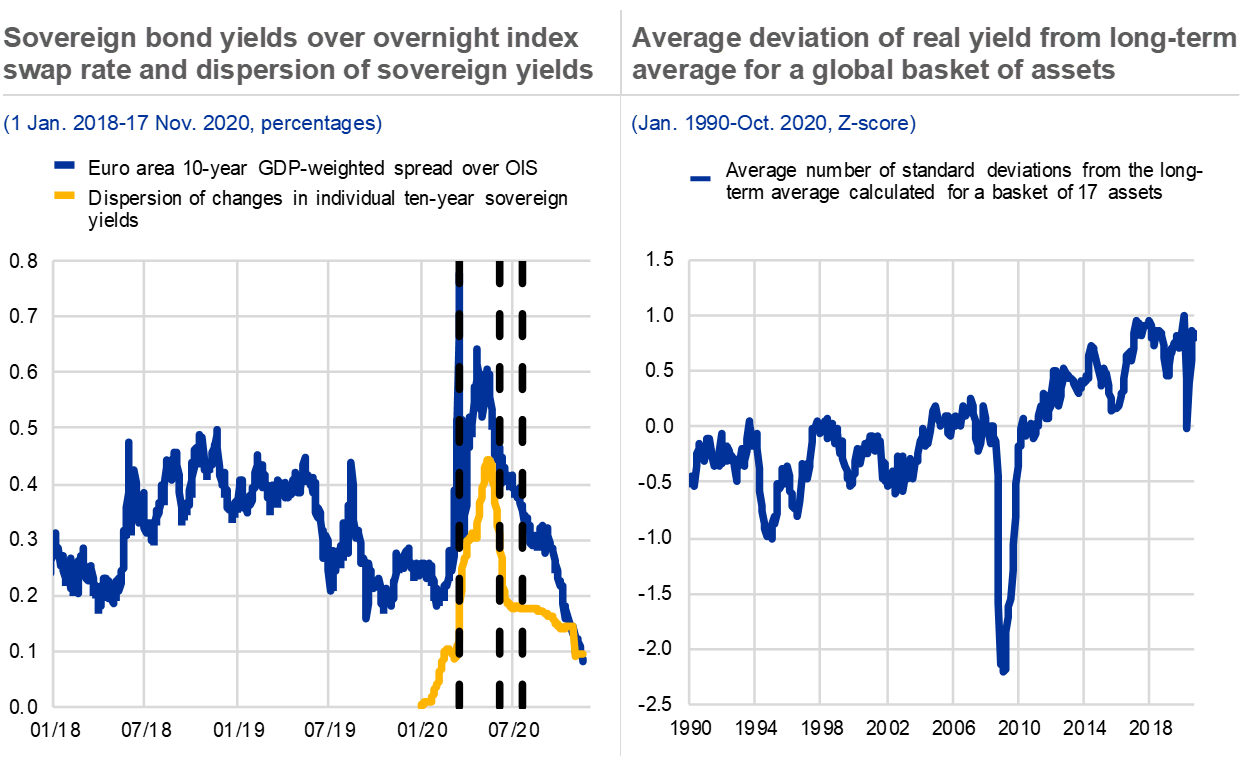
Sources: Refinitiv, Bloomberg Finance L.P., ECB (Statistical Data Warehouse) and ECB calculations.
Notes: Left panel: the chart shows the euro area ten-year GDP-weighted spread over the overnight index swap (OIS) rate and the dispersion of changes in individual ten-year sovereign yields, normalised to zero on 1 January. The dashed vertical lines denote the announcement of the PEPP on 18 March 2020, the expansion of the PEPP on 4 June 2020 and the announcement of the EU recovery fund on 21 July 2020. Right panel: the chart shows the average deviation of the real yield from the long-term average calculated for a basket of 17 global financial assets, including developed market equities (earnings yield), developed market sovereign yields, euro area and US corporate bond yields, US mortgage-backed securities yields, emerging market equities (earnings yield) and USD-denominated sovereign yields. A lower basket real yield than average is denoted with a positive score.
Globally, the low-yield environment continues to encourage investors to shift into riskier assets. The share of global fixed income instruments yielding less than 2% in nominal terms has risen to 90% (see the Overview). Global financial asset price inflation has resumed, partly on account of large-scale fiscal and monetary policy support, following a temporary reversal earlier in the year. For example, the average real yield of a basket of 17 global financial assets has reached 0.8 standard deviations below its long-term average (see Chart 2.3, right panel). Low asset yields continue to present challenges for investors looking to generate returns and incentivise a shift into riskier assets. This may contribute to a build-up of financial stability risks, including in the non-bank financial sector (see Chapter 4), if such risk-taking becomes excessive.
Box 2
Some way to go in the transition to the €STR
Market participants have been slow in making the transition to the euro short-term rate (€STR) as the new reference rate in short-term interest rate derivatives markets. Overnight index swaps (OISs) – the main product in this market segment with a notional outstanding amount of about €8.7 trillion – are essential for managing interest rate risk, and therefore helping to support the stability of the financial system. The industry also views the OIS market segment as a potential source of alternative risk-free interest rates to serve as a fall-back for the euro interbank offered rate (EURIBOR), the benchmark term rate underlying loan and debt security pricing for euro area households and corporates.
More2.2 Divergent trends in equity markets
Global equity markets have partially recovered the losses suffered during the turmoil in the spring. Lower real interest rates, coupled with the improved sentiment stemming from the global monetary and fiscal policy response and a string of positive macroeconomic data surprises, prompted the initial equity market recovery. This recovery was also supported by a rebound in short-term earnings growth expectations from their trough. By contrast, the US equity market has received a stronger boost from declining risk-free rates. The euro area equity market recovery stalled in the latter half of the summer, as the equity risk premium increased and longer-term earnings growth expectations weakened as a result of rising uncertainty surrounding the economic outlook and renewed lockdowns (see Chart 2.4, left panel). Concerns eased and equity markets rose in November on positive news about coronavirus vaccine trials.
The US equity market has outpaced euro area equity markets, with markets exhibiting a “K-shaped” recovery. Market developments in the euro area composite index mask a large difference in performance across euro area non-financial corporate (NFC) sectors (see Chart 2.4, right panel). This has given rise to a “K-shaped” recovery, where certain sectors like technology have rebounded more strongly than others such as oil and gas from the trough, reflecting a dispersion in the expected earnings recovery. Such unequal performance translates into outperforming sectors gaining market share in market capitalisation indices. For example, the share of the largest five stocks in the S&P 500 index reached around 23%, which is high by historical standards. Conversely, if certain companies fail to recover, it could signal longer-term risks, whereby they become increasingly reliant on an accommodative policy environment while exhibiting anaemic growth.
Chart 2.4
Heterogeneous performance in equity markets reflects different earnings prospects
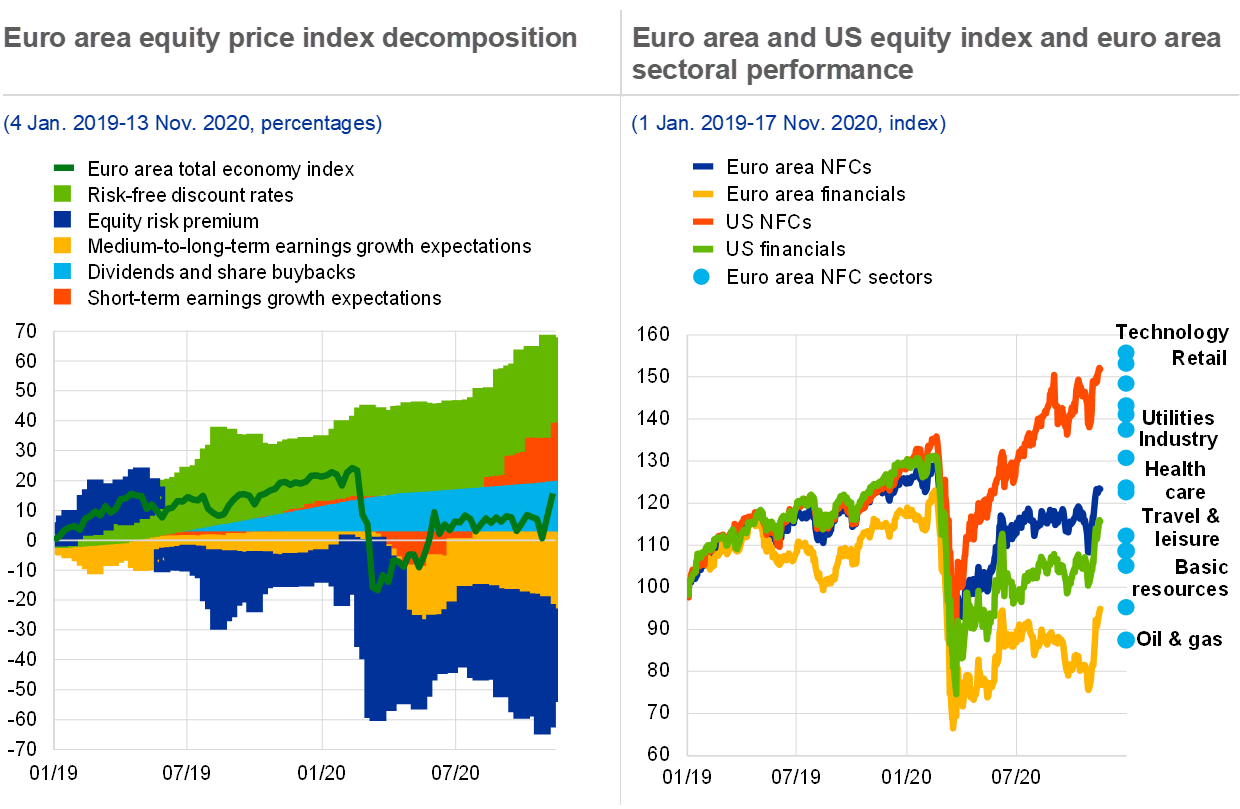
Sources: Refinitiv, IBES, Consensus Economics, Bloomberg Finance L.P. and ECB calculations.
Notes: Left panel: the cumulative decomposition is based on an approximation of the three-stage dividend discount model. A higher equity risk premium is indicated by a negative sign as it translates into weaker equity market performance. Right panel: the light blue dots refer to the 15 EURO STOXX NFC super-sectors according to the industry classification benchmark.
The market recovery in the summer led to some analysts perceiving a disconnect from fundamentals, but different valuation metrics provide somewhat contrasting evidence, with regional variation also being evident. Strong advances in equity markets until September compared to the underlying economy, particularly in the United States and in the technology sector (see Chart 2, right panel, in the Overview), supported by the unprecedented monetary policy response, gave rise to analysts’ perceptions in the summer that equity market developments might be disconnecting from actual underlying economic developments. This perception was partly due to the difference in sectoral make-up and the different importance that some companies have in the stock market compared to the real economy, for example in employment. Nevertheless, forward price/earnings ratios in most euro area economic sectors are elevated against historical benchmarks owing to a subdued earnings outlook. Likewise, 2020 has seen a rise in the price-to-estimated earnings ratios of stocks exhibiting growth-style characteristics, such as technology firms, and of stocks with value-style characteristics, such as financial services (see Chart 2.5, left panel). The pandemic appears to have accelerated the ratios’ increasing divergence that started in 2017, perhaps because it may have altered assessments of companies’ growth and earnings prospects in a shifting economic landscape. At the same time, cyclically adjusted price/earnings ratios, which measure prices relative to longer-run past earnings, remain below their long-run median values in all major economic regions, with the exception of the United States, where there are some signs of stretched valuations (see Chart 2.5, right panel).
Chart 2.5
Equity prices relative to estimated earnings are at elevated levels, but cyclically adjusted price/earnings ratios remain at more moderate levels

Sources: Refinitiv, Bloomberg Finance L.P., MSCI and ECB calculations.
Notes: Left panel: the lines show the ratio of index price to Bloomberg consensus estimate for adjusted earnings per share of stocks in the MSCI World Growth Index and World Value Index. The growth investment style characteristics for index construction are defined using five variables: the long-term forward earnings per share (EPS) growth rate, the short-term forward EPS growth rate, the current internal growth rate, the long-term historical EPS growth trend and the long-term historical sales per share growth trend. The value investment style characteristics for index construction are defined using three variables: the price-to-book value ratio, the 12-month forward price/earnings ratio and the dividend yield. Right panel: data refer to monthly nominal price index data normalised by the ten-year earnings average from 1 January 1990 to 1 November 2020.
Equity market performance has been broadly in line with forward-looking indicators, but the risk of an abrupt equity market correction remains elevated, albeit diminishing. Despite some concerns over potentially stretched valuations, euro area equity index developments, reflecting expectations about future economic activity, have been broadly in line and increasingly converged with forward-looking sentiment indicators. More recently, the equity market declined in October on renewed concerns about further economic lockdowns, but reacted positively in November to news of successful coronavirus vaccine trials (see Chart 2.6, left panel). The cost to insure against a renewed severe (>20%) stock market correction has declined in recent months. This may reflect both a decrease in investor risk aversion and a fall in perceived probabilities attached to downside risk scenarios. But this insurance premium still remains elevated compared with pre-pandemic levels (see Chart 2.6, right panel).
Chart 2.6
Euro area equity market developments are in line with sentiment indicators and the cost of hedging downside risks remains elevated

Sources: Refinitiv, Bloomberg Finance L.P., European Commission, Sentix, Westpac and ECB calculations.
Notes: Left panel: EURO STOXX (SXXE) index and composite Purchasing Managers’ Index (PMI); economic sentiment and investor sentiment are rebased to 100 on 1 January 2020. Risk aversion index (last observation 6 November) is proxied as the inverse composite index of financial stress based on the IMF’s methodology; see Cardarelli, R., Elekdag, S. and Lall, S., “Financial Stress, Downturns, and Recoveries”, IMF Working Paper WP/09/100, May 2009. Right panel: solid lines show latest observation, dashed lines show values at the height of the coronavirus stress period on 18 March and dotted lines show values before the coronavirus stress period on 21 February.
2.3 Credit spreads narrow despite increasing corporate sector vulnerability
Corporate bond spreads have recovered almost entirely from the tensions experienced in March. Corporate bond spreads have declined and approached pre-pandemic levels across the rating spectrum (see Chart 2.7, left panel), reflecting investors’ improved risk sentiment and renewed search for yield as sovereign bond yields declined (see Chart 2.3, left panel). This development has been supported by continued investor inflows into euro area corporate bond funds (see Chapter 4) and occurred despite a large increase in corporate debt supply (see Chart 2.10, right panel).
Corporate bond spreads have narrowed against a backdrop of direct and indirect policy support. The narrowing of corporate bond spreads was also in line with a compression in the excess bond premium (see Chart 2.7, right panel). The lower premium for investment-grade bonds can partly be explained by the Eurosystem purchases under the corporate sector purchase programme (CSPP) and the PEPP and may also spill over to the high-yield segment by prompting a renewed search for yield. Credit markets, particularly in the high-yield segment, have also been supported by the large-scale fiscal support, which is reducing economic uncertainty and tail risks.
Chart 2.7
Corporate bond spreads are near pre-pandemic levels, supported by the Eurosystem purchase programmes, fiscal support and stronger risk appetite

Sources: IHS Markit, Bloomberg Finance L.P. and ECB calculations.
Notes: Left panel: iBoxx EUR Non-Financials Z-spread (i.e. the constant spread that makes the price of a security equal to the present value of its cash flows when added to the yield at each point on the spot rate Treasury curve); three-to-five-year maturity and ratings refer to S&P long-term local currency ratings. Right panel: the excess bond premium is the deviation of corporate credit spreads from the measured default and duration risk of the issuer. For the methodology, see De Santis, R., “Credit spreads, economic activity and fragmentation”, Working Paper Series, No 1930, ECB, July 2016.
Credit spreads have also been supported by comparatively resilient credit risk metrics that so far remain below the levels seen during the global financial crisis. Monetary and fiscal policy measures have been effective in helping to avoid, or at least postpone, a wave of corporate defaults. Credit risk data appear to anticipate a continuation of significant monetary and fiscal policy support, which would limit defaults. Indeed, baseline expectations of default rates remain well below the levels seen in the global financial crisis (see Chart 2.8, left panel).
Credit spreads do, however, appear tight in view of the near-term economic outlook, particularly for the high-yield segment of the corporate bond market. From a historical perspective, euro area corporate bond spreads, especially in the high-yield segment, appear tight relative to expected one-year-ahead growth forecasts in the second and third quarters (see Chart 2.8, right panel). The spreads stood significantly below those observed during the global financial crisis and the euro area sovereign debt crisis, owing in part to the more accommodative policy environment. But this highlights the upside risks to corporate spreads from a deterioration in the credit market environment. Spreads could widen under more pessimistic default scenarios which could materialise if confidence about the extent and duration of monetary and fiscal support were to deteriorate or renewed pandemic-related lockdowns were to be expanded. Additionally, the limited scope for risk-free rates to decline makes risky asset valuations more sensitive to deteriorations in the macroeconomic outlook and risk sentiment.[9]
Chart 2.8
Credit risk metrics have increased, but remain below global financial crisis levels, and corporate bond spreads appear tight relative to the economic outlook

Sources: Moody’s Analytics, ECB Survey of Professional Forecasters (SPF), Ice Data Indices and ECB calculations.
Notes: Left panel: EA: euro area; HY: high-yield; IG: investment-grade; NFCs: non-financial corporations. Right panel: the scatter plot depicts the investment-grade (blue and yellow) and high-yield (red and green) bond asset swap spreads against one-year-ahead mean point estimate forecasts of euro area GDP growth in the SPF. The asset swap spread reflects the difference between the yield of the bond and the LIBOR. The data are quarterly from the first quarter of 1999 to the third quarter of 2020. The blue and red dots and trend lines represent the period from the first quarter of 1999 to the first quarter of 2020, the light blue dots the period from the fourth quarter of 2008 to the third quarter of 2009 (global financial crisis), the yellow dots the period from the fourth quarter of 2011 to the third quarter of 2012 (euro area sovereign debt crisis) and the green dots the period from the second to the third quarter of 2020. Bond spread data are the average for the same periods as those when the SPF was conducted (available here). The analysis does not control for any potential impact of bond spreads on GDP growth expectations.
Corporate credit quality has deteriorated and negative rating outlooks stand at historically high levels. Credit rating agencies’ downgrades of euro area non-financial corporations (NFCs) spiked in March and April. The majority of downgrades have taken place in the high-yield segment, while investment-grade ratings have been comparatively resilient. At just over €30 billion, the amount of euro area NFC bonds downgraded from investment grade to high yield (“fallen angels”) has remained comparatively limited and considerably below projections in the early stages of the pandemic (see Box 3). Nevertheless, the share of high-yield companies in all euro area rated firms has increased by 3 percentage points in 2020 to a record high of 51%. Moreover, while the pace of rating downgrades has slowed since May, the number of negative rating outlooks, including rating watches, remains near record high at 34% of all issuers, dwarfing the number of positive rating outlooks at 3% (see Chart 2.9, left panel).
Chart 2.9
Many companies remain at risk of further downgrades and credit quality has also deteriorated in the leveraged loan market

Sources: S&P Global Market Intelligence and ECB calculations.
Notes: Left panel: negative outlook refers to the number of firms with a negative credit watch or negative outlook in relation to the total number of issuers. Downgrades are three-month averages. Right panel: includes European leveraged loan covenant amendment requests and loans in a default or restructuring process.
The deterioration in credit quality exposes investors to additional risks. The European leveraged loan market has experienced increased downgrade rates, especially in March and April, and elevated default rates, although the latter remain below historical highs. Firms drew heavily on their revolving credit facilities to access liquidity at the start of the coronavirus crisis and, in many cases, these drawdowns triggered springing covenants. This led to borrowers increasingly requesting loan condition relief, which points to a deterioration in credit quality (see Chart 2.9, right panel).[10] This also weakens investor protection and, in some cases, opens up the possibility of a further increase in leverage, which would raise risks to unsecured debt holders and could result in more severe loan losses in the event of defaults.
Corporates, particularly investment-grade firms, have made more use of capital markets to access precautionary funding, resulting in record bond issuance in recent months. Despite deteriorating credit quality and a highly uncertain economic outlook, euro area NFCs substantially increased their funding. More than a third of net euro area corporate funding in 2020 has come from capital markets ‒ a much higher share than during the global financial crisis (see Chart 2.10, left panel). Such issuance has been used to bridge potential liquidity shortfalls and to finance working capital requirements and ongoing investment projects that could not be postponed. Investment-grade firms have issued record amounts of bonds in the year to date, while bond issuance by high-yield firms has recovered strongly following a hiatus in March and April (see Chart 2.10, right panel). New issue premia for investment-grade bonds have come down overall since the spring, but continue to vary widely. While lower-rated investment-grade issues with longer maturities have seen higher new issue premia than before the pandemic, a number of highly rated bonds have received a negative new issue premium owing to solid investor appetite.
Chart 2.10
Large increase in net corporate funding and record high investment grade bond issuance

Sources: ECB (Statistical Data Warehouse), Dealogic and ECB calculations.
Notes: Left panel: bonds refer to net issues of debt securities and equity refers to net issues of listed shares (all currencies). Series are three-month averages, September 2020 data points are provisional values. MFI: monetary financial institution. Right panel: 2020 issuance is year to date (up to November 2020).
An increasing share of corporate bonds issued in 2020 has lower investment-grade ratings (see Chart 2.11, left panel). The share of bonds issued with lower investment-grade ratings (A-BBB) has risen to over 80%, a peak since at least the global financial crisis, while the share of AAA-AA debt issued fell to 5%. The newly issued debt could insulate NFCs from short-term liquidity shortfalls, but higher debt levels at lower credit ratings accentuate potential debt overhang issues, which can hold back investments, slow the economic recovery and make companies more sensitive to shocks.[11] Vulnerable firms may find it more difficult to weather a reduction in policy support, renewed economic shocks or financial market turbulence, which could cause risk premia to rise and financial conditions to tighten. These include fallen angels, given the associated sizeable increase in funding costs (see Chart 2.7, left panel).
Equity financing activity has been concentrated in a limited number of sizeable transactions by large companies. Elevated uncertainty and the practical challenges of issuing equities at the start of the lockdown in March severely constrained euro area initial public offerings. Activity then resumed somewhat as volatility eased. Large, already listed companies stepped up their follow-on equity offers substantially, generating a notable rebound in equity issuance volumes. Year-to-date primary market issuance is at a higher level than in the past four years. But the number of transactions remains low (see Chart 2.11, right panel), suggesting that overall equity financing activity has been dominated by a small number of large transactions.
Chart 2.11
Debt issuance has been most prominent in the low investment-grade segment, while equity issuance has rebounded but is dominated by a few large transactions

Sources: ECB (Centralised Securities Database), Dealogic and ECB calculations.
Notes: Left panel: issuance of euro-denominated debt securities. Right panel: covers new capital raised in initial public offerings and follow-on offerings (including rights issues) by euro area NFCs. 2020 issuance is year to date (up to November 2020).
Box 3
Understanding what happens when “angels fall”
Credit rating downgrades especially from investment grade to high yield (“fallen angels”) can adversely affect the price and ease of a firm’s debt issuance. Credit rating agencies (CRAs) assess whether an issuer and its debt are relatively safe “investment grade” (rated BBB- or above) or more risky “high yield” (rated BB+ or below). In this context, a fallen angel is generally understood to be an issuer that has been downgraded from investment grade to high yield by at least one of the three major CRAs. Such a downgrade can force (institutional) investors to sell securities, as investment mandates may restrict the securities that they are allowed to hold.[12] It may also trigger a sharp increase in a firm’s cost of bond financing and reduce its market access. This box considers the prospects for fallen angels, and assesses whether the consequences for market access and the risk of downgrade-linked sell-offs are as great as sometimes feared.
More3 Euro area banking sector
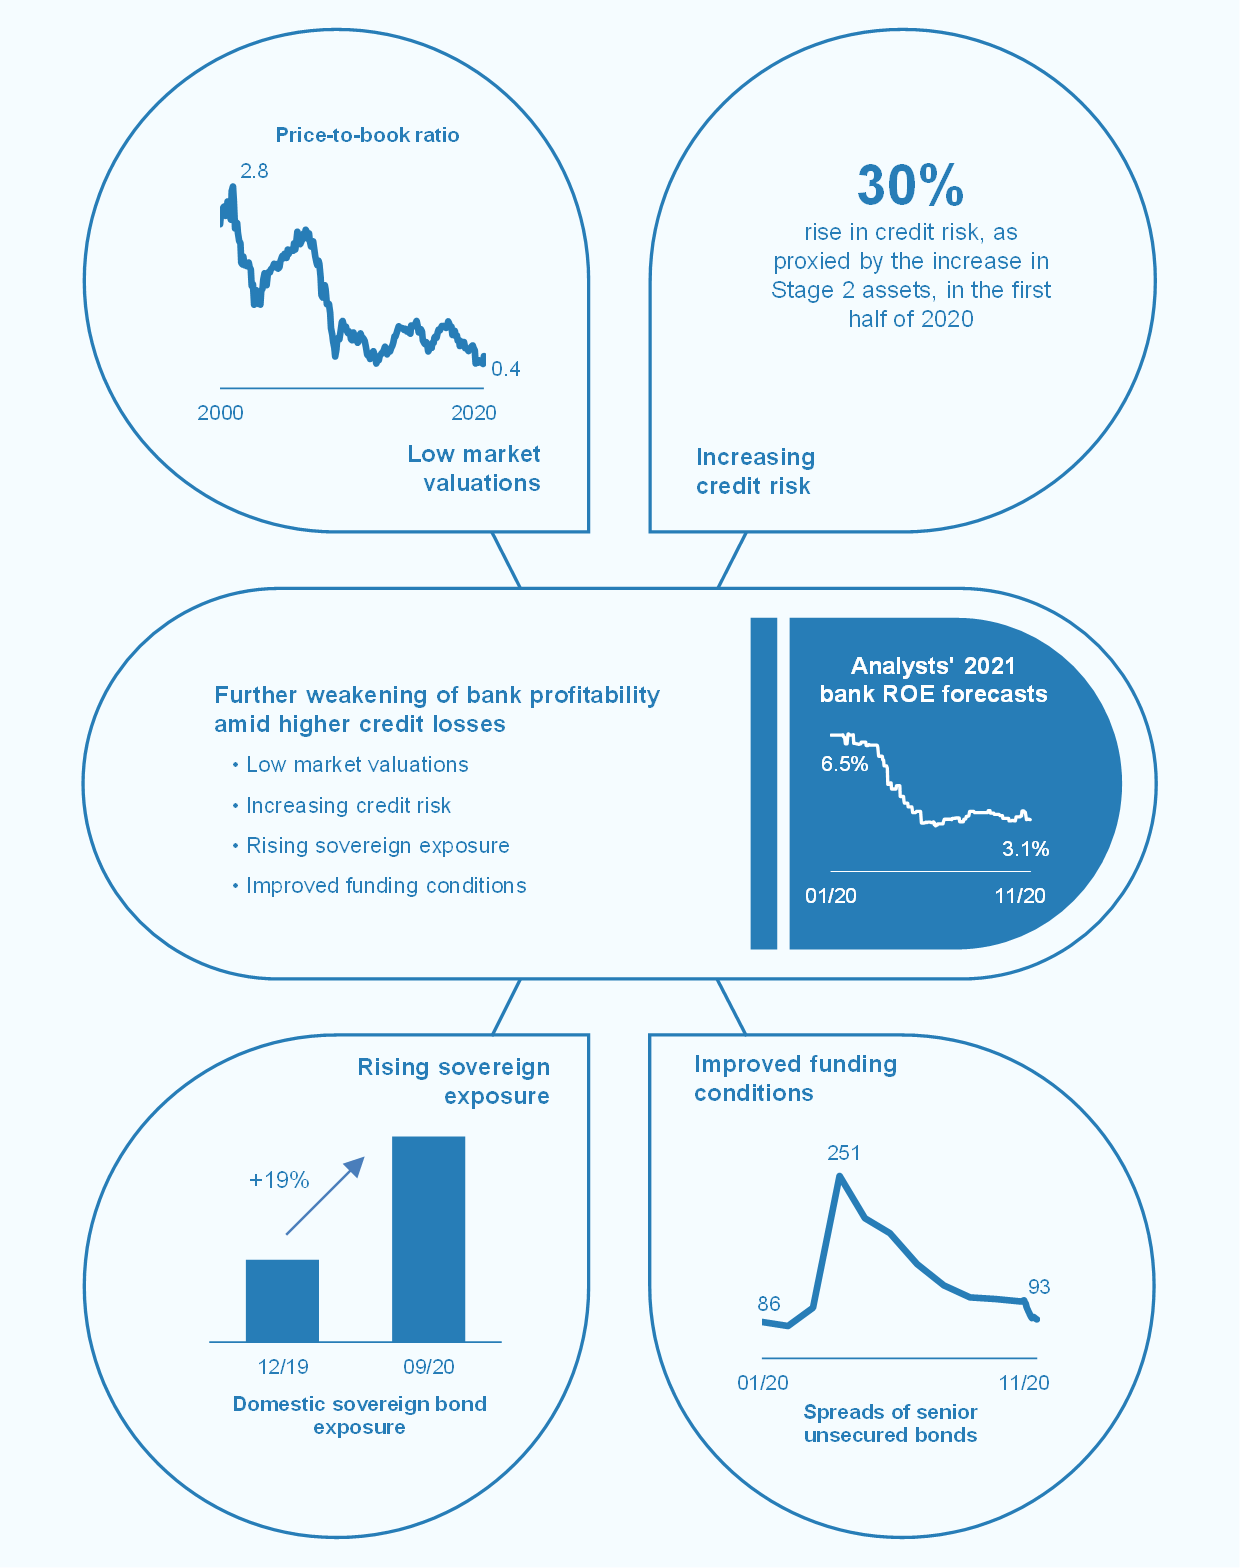
3.1 Weaker bank profitability and rising credit risks
Profitability unlikely to recover to pre-pandemic levels before 2022
Euro area banks’ profitability weakened in the first half of 2020 amid the economic fallout from the pandemic. After a moderate decline in 2019 due to margin compression in the low interest rate environment, the aggregate return on equity (ROE) of euro area significant institutions (SIs) fell further to around 2% at the end of the second quarter of 2020,[13] with some banks reporting a negative ROE in nine euro area countries. In an international comparison of listed banks, euro area institutions now rank below their Japanese counterparts but slightly above UK banks (see Chart 3.1, left panel). The results from third quarter earnings releases of listed banks suggest that profitability of euro area banks declined further to below 1%. Looking ahead, market expectations of future ROE of listed euro area banks for 2020 have declined slightly to 1.7%, while expectations for 2021 and 2022 have remained so far broadly unchanged at 3.1% and 5% respectively. With the recent resurgence in infections and new containment measures, it is likely that profitability forecasts will be revised downwards, as it is also uncertain when a vaccine will be available for a larger share of the population (see Chart 3.1, right panel). Ongoing weak profitability might hamper banks’ capacity to support lending to the real economy in the months ahead, not least as interest rates are expected to remain low for a substantial period to come.
Chart 3.1
Euro area banks’ profitability declined substantially in the first half of 2020, trailing most global peers, and recovery is expected to be slow as the pandemic continues

Sources: Bloomberg Finance L.P., ECB supervisory data, Oxford COVID-19 Government Response Tracker, ECB and ECB calculations.
Notes: Left panel: figures are on a trailing four-quarter basis. The ROE forecasts for the euro area are computed as a median based on a sample of 40 listed euro area banks. The global comparison is based on a sample of 59 listed banks. Right panel: see sources and notes of Chart 1, left panel, in the Overview.
Higher loan loss provisions drove the decline in profitability of euro area banks, which was only partially offset by cost reductions. The decline in the return on equity of euro area banks in the first half of 2020 is attributable mainly to an increase in credit impairments together with a decrease in other profit and loss items related largely to one-off goodwill impairments. At country level, credit impairments contributed the most to declines in Spain. Other profit and loss items declined the most in Spain and Italy, largely due to extraordinary items and non-recurring expenses. Pre-impairment operating profits increased only marginally over the same period. This was largely due to a reduction in administrative expenses, in particular in France and Germany. At the same time, both net interest income and net fee and commission income declined at the euro area level on aggregate, albeit with mixed developments across countries (see Chart 3.2, left panel). Aggregating banks by their pre-pandemic return on equity reveals that banks in the best performing quartile suffered the largest decline in profitability in the first half of 2020. By contrast, the profitability of the worst performing banks remained unchanged thanks to gains from other profit and loss items and in particular from aggressive cost-cutting to prevent their losses from increasing further (see Chart 3.2, right panel). Notably, banks in the lowest profitability quartile had a pre-pandemic cost-to-income ratio of 85% as against only 57% for the most profitable banks. This suggests that consolidation in the industry, as seen in Italy and Spain, might improve future profitability.
Chart 3.2
Cost-cutting only marginally offset the impact of higher impairments on euro area bank profitability on aggregate, although it helped the least profitable banks more
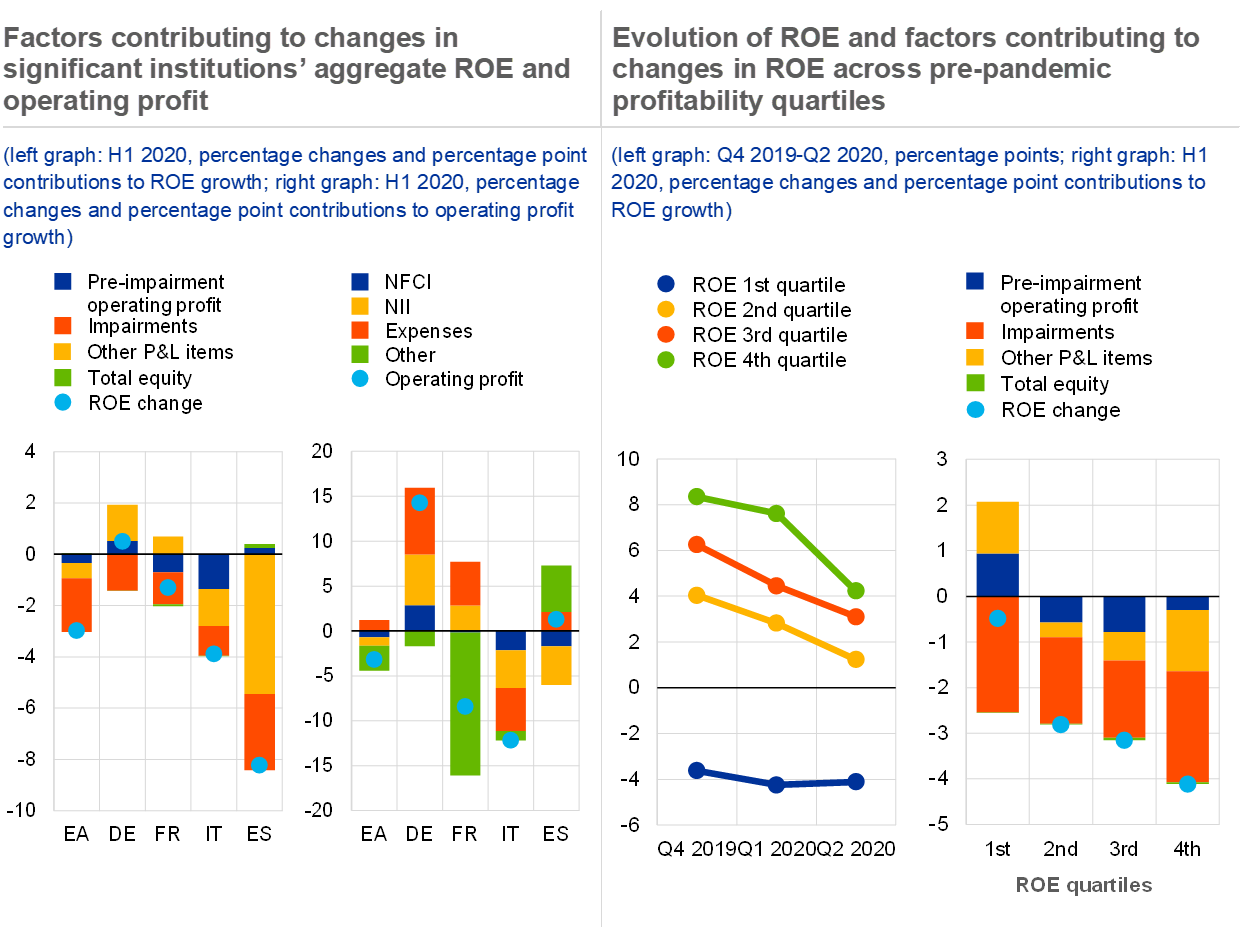
Sources: ECB supervisory data and ECB calculations.
Notes: Figures are on a trailing four-quarter basis. Based on a balanced sample of 94 SIs. NII: net interest income; NFCI: net fee and commission income; Right panel: banks in the first to the fourth quartile of the ROE distribution during Q4 2019.
Net interest income (NII) declined on the back of an increase in cash holdings at the ECB, the introduction of payment moratoria and state-guaranteed NFC loans. The negative contribution of margins to changes in NII, which started in the second half of 2019, intensified during 2020 and led to a reduction in NII in the first half of the year. The decline in NII reflects lower income from loans to corporates and households, probably as a consequence of lower margins on state-guaranteed loans, which were partly offset by the lower cost of deposits. Among the four largest euro area countries, Spain and Italy experienced a decline in NII whereas Germany and France saw a rise (see Chart 3.3, left panel). The NII decline in Spain was exacerbated by the sharp depreciation of emerging economy currencies in particular and was only partially offset by foreign exchange hedges, captured in “other income”. The NII increase in Germany and France reflected a smaller decline in margins in the former and a larger volume effect, in line with the large take-up of loans under state-guarantee schemes, in the latter. Decomposing the change in interest-earning assets into its main driving factors reveals a shift towards lower-yielding assets, as debt securities and cash holdings at central banks became more important. The heterogeneity at the country level is worth highlighting, with the increase in cash balances at central banks being most pronounced in France, whereas Italian banks stand out due to the increase in the volume of debt securities. The government guarantee schemes for bank loans accounted for most of the strong growth in lending to firms since March 2020 (see Special Feature A). However, the higher loan volume failed to compensate for the negative contribution from interest rates. This indirectly highlights the impact of lower market interest rates coupled with loan guarantees (see Chart 3.3, right panel).
Chart 3.3
Net interest income of euro area banks declined mainly due to lower interest rates, with volume growth providing only a partial offset
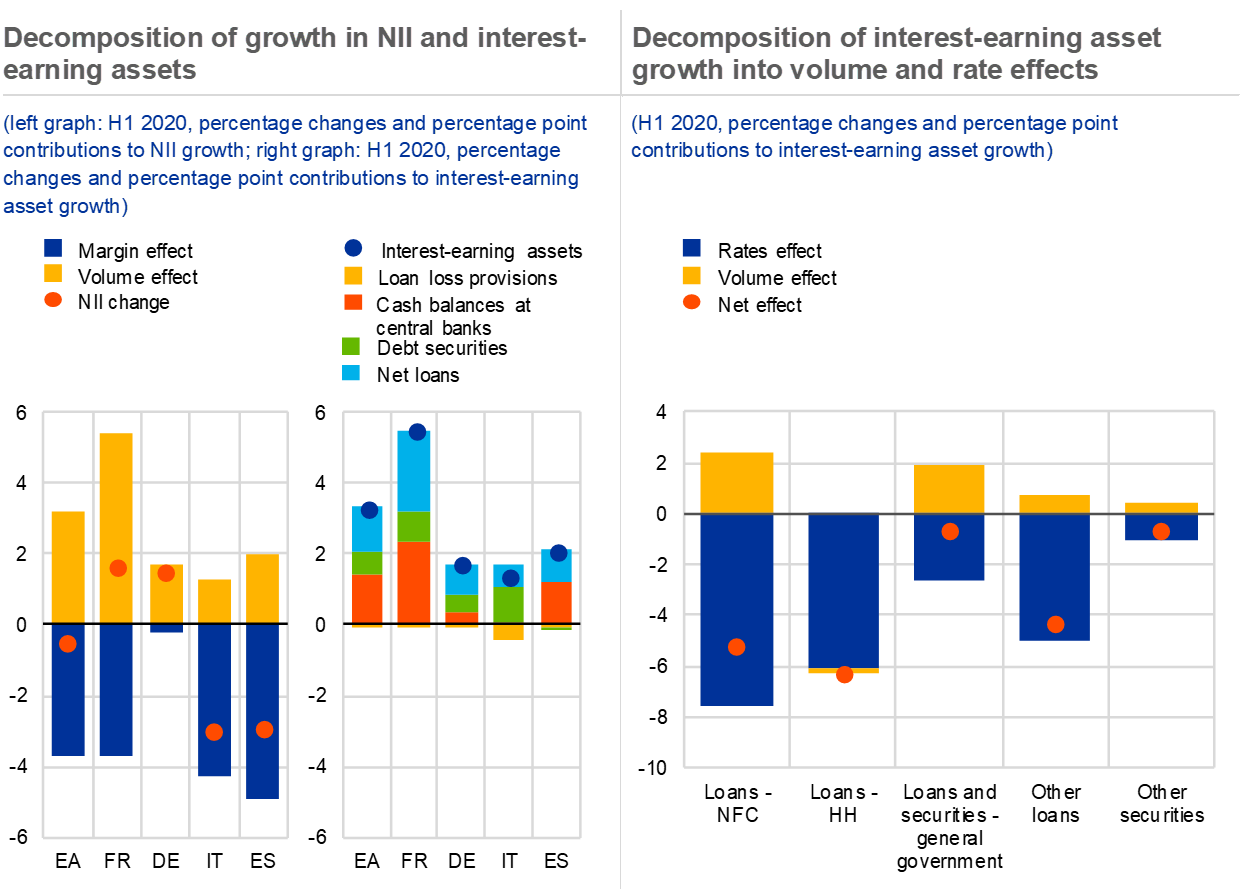
Sources: ECB supervisory data and ECB calculations.
Notes: Left panel: figures are on a trailing four-quarter basis. Based on a balanced sample of 94 SIs. Right panel: HH: households, NFC: non-financial corporations.
Future lending growth will depend on whether state guarantees expire or are extended and whether banks tighten lending standards, as they have indicated. While mortgage lending remained stable amid favourable interest rates and consumer lending fell substantially in the first half of 2020, corporate lending grew on the back of state guarantees. The fact that the volume of state-guaranteed loans exceeded the amount of net lending might partly reflect the conversion of pre-existing loans into guaranteed loans, in particular in Spain and Italy (see Chart 3.4, left panel). Since access to loan guarantee schemes is currently set to expire in December 2020,[14] this might have an impact on loan growth going forward, in particular as the latest ECB bank lending survey indicates that banks have started tightening lending standards (see Chart 3.4, right panel).
Chart 3.4
Lending to NFCs in the first half of 2020 was strongly driven by loan guarantees, credit standards are expected to tighten amid higher credit risk going forward

Sources: ECB MFI balance sheet statistics, KfW (DE), French Banking Federation (FR), Italian Ministry of Economic Development, Mediocredito Centrale and Italian Banking Association (IT), Spanish Ministry of Economic Affairs and Digital Transformation (ES), ECB bank lending survey and ECB calculations.
Notes: Left panel: state-guaranteed loans requested by end-October. Data for gross and net NFC lending until end of September. HH consumption: consumer credit and other lending to euro area households; HH mortgage: loans to euro area households for house purchase.
The sovereign-bank nexus strengthened in some euro area countries amid a rise in banks’ exposure to domestic government debt. In their efforts to increase liquidity buffers and reduce risk in response to the coronavirus uncertainty, but also potentially to benefit from carry trades, banks have increased their holdings of government bonds, albeit with substantial variation across countries (see Chart 3.5, left panel). The rise in banks’ exposure to domestic governments, together with the extraordinary policy measures and the associated increase in sovereign debt, has increased the risk from the sovereign-bank nexus (see Chart 3.5, right panel) in some countries (see Box 4).
Chart 3.5
Banks in some euro area countries greatly increased their holdings of domestic government bonds, raising the potential risk from the sovereign-bank nexus

Sources: ECB MFI balance sheet statistics, CMA and ECB calculations.
Notes: Left panel: figures are on a trailing twelve-month basis. Right panel: based on regressing the natural logarithm of daily bank CDS spreads on the natural logarithm of sovereign CDS spreads using a rolling window of 220 days (one business year).
Box 4
Developments in the sovereign-bank nexus in the euro area: the role of direct sovereign exposures
Rising sovereign debt in the wake of the pandemic has renewed concerns about the euro area sovereign-bank nexus ‒ a major amplifier in the euro area sovereign debt crisis. In the early 2010s, banks in a number of euro area countries held high shares of their government’s debt at the same time that governments were providing guarantees or other support to their banking systems. In recent years, many euro area countries have observed a decline in sovereign-bank interlinkages and, in turn, in the risk of intertwined crises. However, the pandemic and the fiscal measures to support the economy that followed are likely to prompt an increase in sovereign debt, and in turn in the exposures between governments and their banking systems. In addition, the sovereign-bank nexus may develop also via indirect channels, including banks’ exposure to the state of the domestic economy; whereby direct holdings can amplify these indirect effects. This box assesses how the interlinkages, via the direct exposures of banks to sovereign debt securities[15], have increased so far and whether this has led to an increase in crisis risk.
MoreChart 3.6
Euro area banks have been provisioning less than US banks, with policy and profitability differences as potential explanatory factors

Sources: Bloomberg Finance L.P., ECB supervisory data and ECB calculations.
Notes: Left panel: based on a sample of 20 listed euro area banks and 16 listed US banks. Right panel: based on a sample of 20 listed euro area banks and 17 listed US banks (left graph), and on a balanced sample of 80 euro area SIs (right graph); more/less affected: countries more/less affected by past crises.
Loan loss provisions booked by euro area banks increased markedly, amid considerable uncertainty around future credit losses. Downside risks to profitability arise from signs of optimistic provisioning and a weaker outlook for lending volumes. Listed euro area banks have increased their loan loss provisions to a smaller extent than their US peers (see Chart 3.6, left panel). Besides differences in portfolio mixes, accounting standards and default rules, one potential reason for this could be the lower profitability of euro area banks prior to the start of the pandemic (see Box 5). According to results from third quarter earnings releases of listed euro area banks loan loss provisioning declined in the third quarter. It appears that the relationship between pre-provisioning profits and provisioning levels is much stronger for euro area listed banks but this may also reflect a lower risk profile. Looking into the larger sample of euro area SIs reveals that the same relationship is slightly weaker for banks that were more heavily affected by past crises (see Chart 3.6, right panel).[16] This could be related to various factors, such as the economic impact of more stringent coronavirus-related restrictions in Italy and Spain, which prompted banks to prepare for a greater deterioration in asset quality than in other euro area countries. Looking ahead, there is a risk that low profitability might lead to under-provisioning.
Box 5
Causes and implications of variation in euro area banks’ recent loan loss provisioning
Banks’ loan loss provisions increased markedly in early 2020 amid the sharp contraction in economic activity, but there was also large variation across banks’ provisioning. In the first half of 2020, significant banks’ loan loss provisions rose to 0.76% of loans (on an annualised basis), more than 2.5 times the level a year earlier, but still below the peak levels of 1.2-1.4% in earlier economic downturns (2008-09 and 2011-13). Much of the increase was driven by the migration of non-financial corporate (NFC) loans to Stage 2, while the Stage 3 loan ratio remained broadly unchanged[17] (see Chart A, left panel). Provisioning levels were widely dispersed across both countries and banks within the same countries (see Chart A, right panel).
MoreCredit risk has increased since the start of the pandemic and asset quality is likely to deteriorate going forward
Deteriorating economic conditions during the pandemic slowed the pace of non-performing loan (NPL) reduction to leave an NPL ratio of 3.0% in the second quarter of 2020 after 3.1% in the previous quarter. Extraordinary policy measures have so far mitigated losses materialising in the banking sector, but this may also weaken the informational value of certain risk indicators. Asset quality has started to deteriorate and inflows into higher asset stages, approximated by observed flows in impairments, have increased. While the rise in the stock of Stage 3 assets has been moderate, changes in credit risk and the drawdowns of off-balance-sheet credit lines have more than doubled the provision inflows into Stage 2 assets (see Chart 3.7, left panel). As new NPL formation typically follows a contraction in economic activity with a lag, the economic fallout from the pandemic will likely continue to weigh on banks’ asset quality in the latter part of 2020 and into 2021. The broad-based deployment of government support to borrowers, through moratoria and public guarantees, may lead to this lag being longer than in past recessions. In addition, as macroeconomic performance differs across countries, the respective GDP decline will generate different NPL profiles.
The share of loans under forbearance measures has also started to rise again (see Chart 3.7, right panel). In particular, the share of performing loans with modifications in their terms and conditions has grown; this excludes lending that is subject to pandemic-induced government support measures such as loan moratoria. While moratoria are a positive measure from a financial stability perspective when borrowers are facing temporary cash-flow disruptions, they pose financial stability risks for banks when cash flows do not recover and borrowers become non-viable, unless the loans under moratoria are also state-guaranteed. The longer the duration of a moratorium, the more difficult the exit from this policy could be; it might also weaken payment discipline further ahead.
Chart 3.7
Provision inflows into Stage 2 assets and exposures under forbearance have increased, pointing towards higher credit risks for euro area banks

Sources: ECB supervisory data and ECB calculations.
The outlook for bank asset performance is dependent on a combination of economic recovery and continued state support. Government support measures have provided a crucial backstop for firms since the pandemic started, thereby also underpinning bank asset quality. Results from a simulation exercise show that, for the euro area on aggregate (see Special Feature A), more than 9% of total corporate loans might become distressed by mid-2021 in a scenario without state support. Distinguishing between the different policy options reveals that short-time working schemes play a major role in preventing the deterioration in asset quality, if deployed promptly to all firms in need (see Chart 3.8, left panel). As public support schemes are expected to expire in late 2020 and 2021, and bank lending survey results indicate that banks intend to tighten credit standards for firms, there is a risk that this could lead to an increase in corporate insolvencies and consequently to credit losses going forward. In addition, property markets face significant headwinds going forward, further contributing to the uncertain outlook (see Section 1.5).
Chart 3.8
The default risk in sectors heavily affected by the pandemic increased in the second quarter, implying that bank asset quality depends on public support going forward

Sources: ECB supervisory data, Bureau van Dijk – Orbis database and ECB calculations.
Notes: Left panel: based on the four largest euro area countries. Distressed firms are defined as those which, under the cash-flow projections aligned with the observed reduction in turnover during lockdowns and subsequent recovery projected in the September 2020 ECB staff macroeconomic projections, would be unable to service their liabilities on time or which would face a reduction in equity of more than 20%. Public support includes payment moratoria, public guarantees and short-time working schemes. Firms are assumed to receive the maximum possible support under each scheme starting from April 2020. Short-time working schemes would reduce a firm’s cash outflows as the government would cover part of staff expenses. Moratoria would reduce the cash outflows related to the servicing and rollover of loans, while guarantees would enable additional borrowing, increasing a firm’s cash holdings. Right panel: the heavily affected sectors are: retail and wholesale trade, professional services, manufacturing, construction, accommodation and food services, arts, entertainment and recreation, and transport and storage. This classification follows the work on initial sectoral losses due to strict lockdown measures and measured in terms of the percentage reduction of gross value added (see Battistini, N. and Stoevsky, G., “Alternative scenarios for the impact of the COVID-19 pandemic on economic activity in the euro area”, Economic Bulletin, Issue 3, ECB, 2020) and the microfounded cash-flow liquidity shortfall experienced by firms. The transport and storage sector was added due to its high turnover losses as reported in the surveys.
Newly originated loans have also tended to have higher credit risk. The probability of default (PD) reported by banks on new loans in their internal ratings-based (IRB) portfolios increased during the second quarter, pointing to a rise in credit risk in banks’ loan books amid a sharp contraction in economic activity. Furthermore, loan data reported in AnaCredit indicate a larger increase in PDs reported by banks for new and existing loans to sectors heavily affected by the pandemic. This suggests that banks’ risk differentiation between sectors has intensified during the pandemic (see Chart 3.8, right panel).
Banks continue to rely on remote working arrangements, which could shape the way of working in the near future, with an impact on operational risks. Due to the pandemic, the majority of euro area financial institutions, including banking and financial market infrastructures, continue to rely on remote working arrangements for a significant share of their staff. Although not all business continuity or disaster recovery plans had initially allowed for or tested a scenario with such a long period or extent of remote working, banks updated their plans and adjusted information and communication technology (ICT) capacities quickly to continue operating without generating performance issues. The use of virtual private networks (VPNs), technical workarounds and the adjustment or relaxation of certain ICT controls facilitated the quick shift to remote working while also intensifying existing ICT vulnerabilities and extending the attack surface. What started as an interim solution has been continuously re-evaluated and re-adjusted, and will probably be transformed into a new way of working. Business operations and ICT security need to continue adapting and responding adequately to the modified ICT risks and cyberrisks. Efforts must be maintained to raise awareness of the techniques adversaries use to specifically target people working from home.
Chart 3.9
The number of cyberrisk incidents has increased over recent months, with DDoS attacks being the most frequent type

Source: ECB cyber incident reporting framework.
Notes: The latest observation is for September 2020. Right panel: Insider misuse: Intentional misuse of access rights by insider, Service provider misuse: Intentional misuse of access rights by service provider, Insider/third party threat: Insider/third party provider threat, Data leakage/corruption: Accidental data leakage/corruption, Malicious script injection: Malicious script injection and/or OS commanding.
While cyber incidents reported by euro area banks have increased over time, institutions have not been impacted severely so far. Cyber incidents reported to the ECB by significant institutions have increased somewhat both over recent months and compared to last year (see Chart 3.9, left panel). Distributed denial-of-service (DDoS) attacks in particular are trending upwards, including ransom DDoS by large threat actors (see Chart 3.9, right panel). Fortunately, these attacks have caused only limited interruptions, mostly due to the unavailability of smaller third parties. No major incidents related to cyberattacks on euro area financial market infrastructures have been reported as of yet. But persistent deficiencies in basic cyber protocols, complex ICT architecture and a growing amount of end-of-life ICT systems in many institutions still need to be addressed. Some large-scale ICT projects to address these vulnerabilities could be delayed by the pandemic. Banks could, in the light of the economic outlook and likely lower profitability, end up hesitating to address these weaknesses in due course.
Recent improvements in solvency positions, but headwinds ahead
Banks’ capital generation has been negatively affected by weak profitability, although an increased share of lower-risk assets has supported capital ratios. Banks’ aggregate CET1 ratios showed some volatility in the first half of 2020, with a moderate decline in the first quarter followed by an increase of the same magnitude in the second. The combined impact of changes in capital in the first two quarters was close to neutral. This partly reflects weak profitability throughout the first half of the year as well as a significant decline in accumulated other comprehensive income (OCI) in the first quarter, driven by negative valuation effects due to the widening of credit spreads and foreign currency translation effects.[18] At the same time, the impact of balance sheet expansion was broadly offset by the decline in risk-weighted asset (RWA) density (see Chart 3.10, left panel). This largely reflects the significant expansion of assets with low risk weights, in particular central bank reserves but also sovereign exposures (see Chart 3.10, right panel), while the increase in state-guaranteed loans may have dampened RWA inflation arising from the robust growth of NFC loans.
Chart 3.10
Banks’ capital generation was negatively affected by weak profitability, but the increase in the share of lower-risk assets supported capital ratios
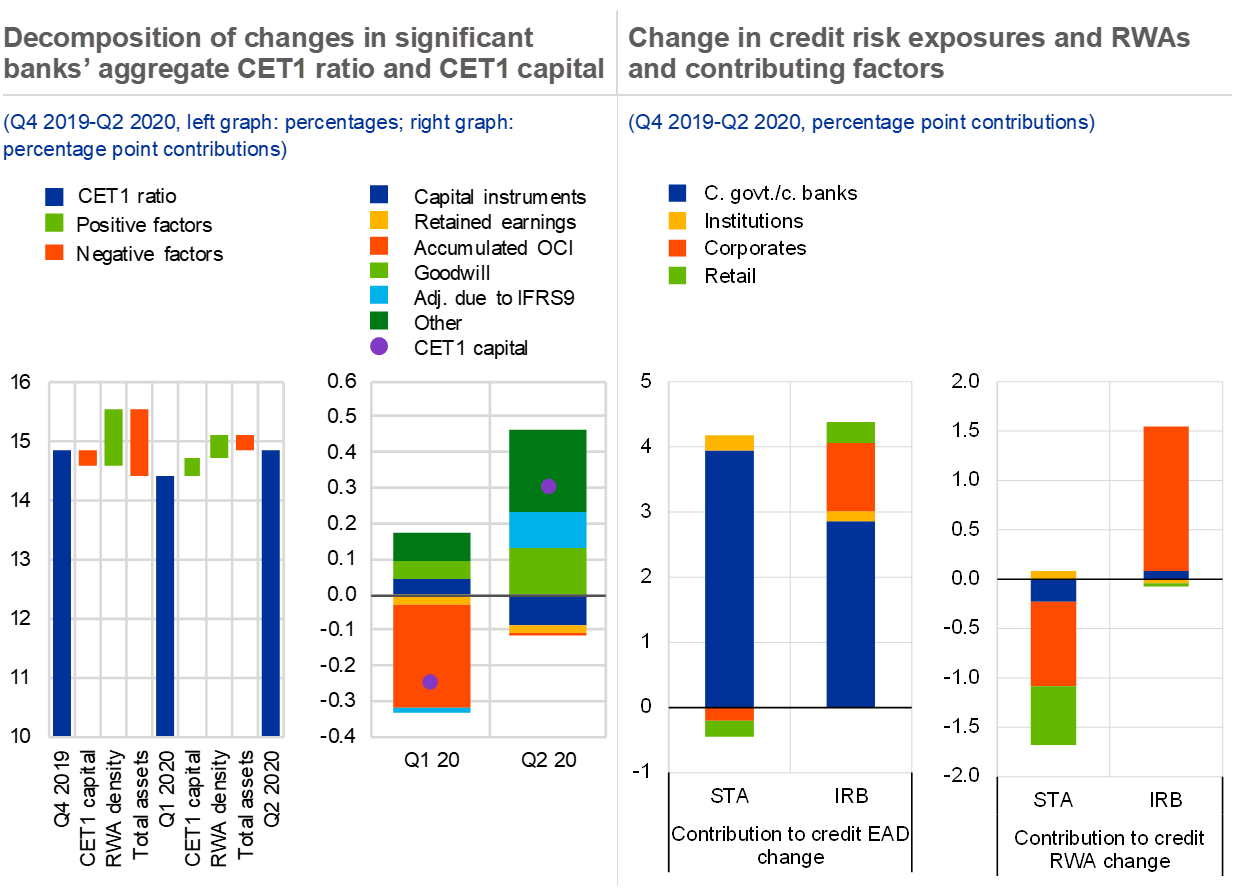
Sources: ECB supervisory data and ECB calculations.
Notes: Left panel: “Other” is net of deductions (excluding goodwill, which is shown separately). Right panel: C. govt./c. banks: central governments and centrals banks; EAD: exposure at default; STA: standardised approach; IRB: internal ratings-based approach.
The improvement in banks’ capital ratios in the second quarter partly reflects the impact of the “quick fix” amendments to the Capital Requirements Regulation (CRR).[19] For a sub-sample of listed banks which disclosed a positive impact from these regulatory changes, the median CET1 ratio uplift amounted to 30 basis points (see Chart 3.11, left panel). Among other things, this included the impact of revised SME supporting factors and new infrastructure supporting factors, add-backs to capital due to IFRS 9 transitional provisions (see Chart 3.11, left panel) and temporary relief for capital requirements for market risk (e.g. through the exclusion of outliers from VaR calculations).
Although banks’ aggregate leverage ratio fell in the first half of the year, it will likely benefit from some temporary relief in the coming quarters. Having improved over the last few years, the aggregate leverage ratio of significant banks fell by around 40 basis points in the first half of 2020, driven by a significant increase in the leverage ratio exposure (+8%) (see Chart 3.11, right panel). Given exceptional circumstances due to the pandemic, the ECB granted temporary relief by allowing banks to exclude central bank exposures from leverage ratio calculations until 27 June 2021. Based on March 2020 data, this exclusion is estimated to raise the aggregate leverage ratio by about 0.3 percentage points.
Chart 3.11
The improvement in banks’ capital ratios in the second quarter partly reflects the impact of regulatory changes, while non-risk-based leverage ratios dropped
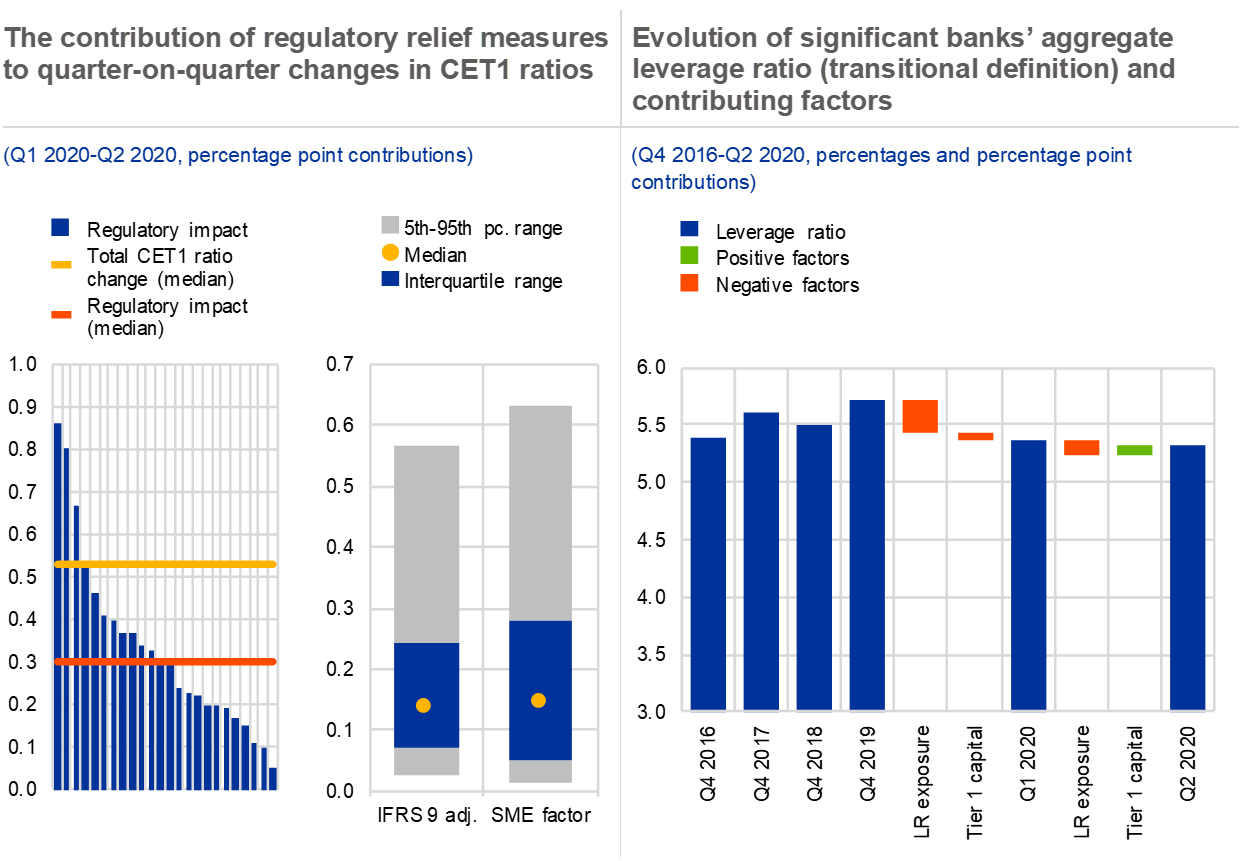
Sources: ECB supervisory data, S&P Global Market Intelligence and bank disclosures.
Notes: Left panel: the chart shows estimated regulatory impacts based on banks’ disclosures. Among other things, regulatory impacts include add-backs to capital due to IFRS 9 transitional provisions as well as RWA benefits related to SME and infrastructure supporting factors, SSM measures on market risk and zero risk weight for sovereign exposures denominated in the currency of another EU Member State.
Looking ahead, more intense credit risk migration over the next few quarters could put pressure on capital ratios. So far, the deterioration in asset quality has mainly manifested itself in a shift towards Stage 2 assets in the first half, while migration to Stage 3 has remained limited (see commentary on asset quality above). As a result, no significant negative impact from higher credit risk has yet been observed in terms of RWA inflation. However, under the baseline scenario, the solvency position of the significant euro area banks is projected to deteriorate moderately by 2022, largely driven by RWA increases due to higher credit risk (see the scenario analysis below). In addition, IFRS 9 phase-in benefits – which do not apply to provisions on Stage 3 loans – can be (partly) unwound once loans move from Stage 2 to Stage 3 as support schemes expire in the coming quarters. That said, enhanced capital buffers due to capital relief measures should help banks to absorb these possible negative impacts.
Mixed evidence on banks’ response climate transition risk
Estimates of euro area banks’ lending to carbon-intensive sectors a proxy for climate change transition risks[20] show few signs of declining. Syndicated loans extended to carbon-intensive sectors have mostly increased or remained stable over recent months of 2020 compared to the 2015-19 averages (with the notable exception of construction, where lending was lower; see Chart 3.12, left panel). Evidence from banks’ large exposures also indicates no material reduction in lending to carbon-intensive sectors on aggregate, suggesting only minor decreases in lending to carbon-intensive companies in some sectors since 2017, while lending to companies in other sectors has not decreased or even increased (see Chart 3.12, right panel). At the same time, issuance of green bonds and banks’ holdings of green bonds have increased; however, their role in lowering issuers’ carbon emissions, thus reducing transition risks, is unclear (see Box 7).
The rebound in carbon emissions since the May 2020 FSR suggests that the fall in emissions in sectors that banks are exposed to was temporary. Although global confinement measures are expected to lead to annual reductions in emissions of around 4-9% compared to 2019,[21] emissions had already rebounded by June (see Chart 3.12, left panel). This suggests that a permanent, sizeable reduction in transition risks for the banking system stemming from these changes is unlikely. Still, longer-term developments suggest that, on aggregate, the emission intensity of firms that euro area banks are exposed to is slowly declining (see Chart 3.12, right panel).[22] In addition, given sizeable overlaps in the sectors hardest hit by the pandemic and the most carbon-intensive sectors, recovery packages could potentially help to reduce transition risks if they are successful in accelerating the transition to a green economy.
Chart 3.12
Lending data provide mixed evidence of transition risk dynamics for banks, while carbon emissions themselves have rebounded from lows earlier in 2020

Sources: Le Quéré (2020), Global Carbon Project, Dealogic, ECB supervisory data, Refinitiv and ECB calculations.
Notes: Left panel: the left graph shows the estimated reduction in daily CO2 emissions, using the data and sector classifications of Le Quéré et al. (2020).40 The right graph shows syndicated loans extended to carbon-intensive sectors, indexed to the 2015-19 average. Right panel: the chart shows euro area exposure to climate policy relevant sectors, as a share of total euro area large exposure, and exposure-weighted emission intensity using scope 1 and scope 2 carbon emissions of firms. Climate policy relevant sectors are defined following Battiston et al. (2017).[23] The sample is unbalanced, with information on economic activity and emission intensity not available for all large exposures and coverage varying depending on the year.
Economic losses due to physical risks from climate change could increase going forward[24] and possibly translate into bank losses. The frequency of weather- and climate-related economic damage has been increasing over recent decades.[25] [26] Ten-year moving average damages to the economy from weather- and climate-related catastrophes ranged between 0.1% and 0.4% of GDP annually over the last 30 years, with annual damages reaching up to 1.5% of GDP for the most exposed countries in some years.[27] In Europe, river floods and storms led to the largest weather- and climate-related economic losses in recent years (around 0.05% of GDP annually on average), while heat waves have caused the largest number of fatalities. The frequency and intensity of these types of extreme weather and climate events are expected to increase further at least over the next decade.[28] In the absence of adequate measures, this may intensify the impact on the economy and in turn the losses for the banking system. Loan exposures to countries with relevant physical risk drivers ranged between 2% and 20% across significant institutions in the third quarter of 2020.[29] The materialisation of physical risks in these areas could pose financial stability risks (see Chapter 5).
Historically low valuations but more favourable market funding conditions than in the first quarter
The stock prices of euro area banks recovered much less over the summer than the overall market, and price-to-book ratios rank below global peers. While global stock markets saw a large rebound over the summer, global bank stock prices remained up to 50% below their end-February levels (see Chapter 5). There has also been substantial cross-country variation compared with the broader market, with euro area banks found at the bottom of the range (see Chart 3.13, left panel). With an aggregate price-to-book ratio of 0.44, euro area banks now rank below Japanese and UK banks. While a very wide range can be observed across individual euro area banks, the distribution is skewed substantially towards lower values. A quarter of 21 listed banks have a price-to-book ratio below 0.31 and 10% below 0.22, which suggests that the market is pricing in substantial downside risks (see Chart 3.13, right panel). More positively, low market valuations of the target bank might facilitate sector consolidation, and M&A discussions have moved the stock prices of Italian banks in particular (see Overview chapter).
Chart 3.13
Bank stock prices have recovered less than the broad market, and euro area bank price-to-book ratios are below global peers
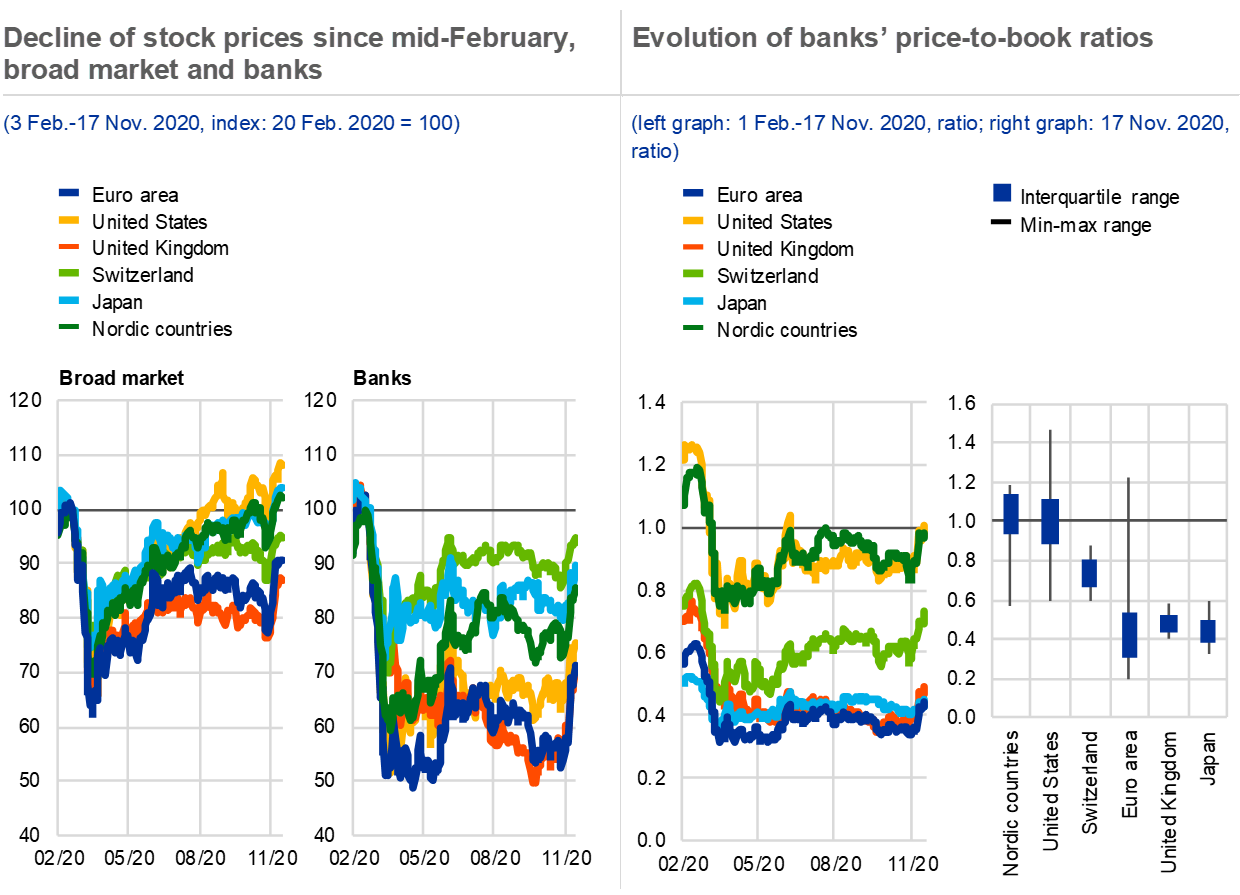
Sources: Bloomberg Finance L.P., Refinitiv and ECB calculations.
Notes: Left panel: based on national/regional stock price indices. The values for the Nordic countries are computed as a median of stock price index changes for Denmark, Sweden and Norway. Right panel: based on a sample of 59 listed banks.
The bond funding costs of euro area banks continued to decline, although they remain elevated for more junior instruments. On aggregate, bond spreads of euro area banks have declined substantially since peaking at the end of March. This has helped to lower banks’ market funding costs, thus providing tailwind to bank profitability in the second quarter. However, spreads are still above pre-pandemic levels (see Chart 3.14, left panel). In particular, the spreads of AT1 instruments are still more than 70% higher as at the end of February, while those of senior unsecured and NPS/HoldCo are 15% and 5% higher respectively.
Chart 3.14
Banks’ market funding costs declined but remain above pre-pandemic levels, while issuance volumes dropped as central bank reserves rose

Sources: Dealogic, IHS Markit and ECB calculations.
Notes: Left panel: z-spreads are defined as the difference (in basis points) between the yield to maturity
of a bank’s bond and the yield of a maturity-matched euro swap. Spreads are weighted by the outstanding volume of the respective bonds. Right panel: the chart shows weekly gross bond issuance volumes.
The record levels of reliance on central bank funding coincide with a significant decline in bank bond issuance, in particular for non-global systemically important banks. The extraordinary support measures have now led to central bank funding increasing to 9% of the total assets of euro area banks on aggregate. At the same time, bond issuance volumes have declined to a historically low level of €278 billion in the year to date (see Chart 3.15, left panel), becoming particularly muted as of mid-June, as banks were able to increase their cash holdings by taking up targeted longer-term refinancing operations (TLTRO) at the end of June (see Chart 3.14, right panel). Whereas global systemically important banks (G-SIBs) slightly increased their issuance volumes, issuance by smaller banks is 25% below that observed in the previous three years, and 8% lower for bail-inable debt. In parallel, ECB asset purchases and expanded central bank reserves have also contributed to improve the liquidity coverage ratio (LCR) of euro area banks to 164% (see Chart 3.15, right panel). The provision of funding at favourable conditions via new TLTRO series helps banks to build up lending to the real economy in a period of unprecedented economic uncertainty. However, the level of reliance on central bank funding, and the coincidental shrinkage in private markets, could pose financial stability challenges in the future, if central bank operations normalise more quickly than market depth can adjust. In particular, funding risks could arise to the extent that some smaller banks may face limited market access and would have to progressively rebuild an investor base.
Chart 3.15
Reliance on central bank funding increased substantially and led to a rise in banks’ liquidity ratios, while bond issuance volumes of non-G-SIBs fell to historic lows
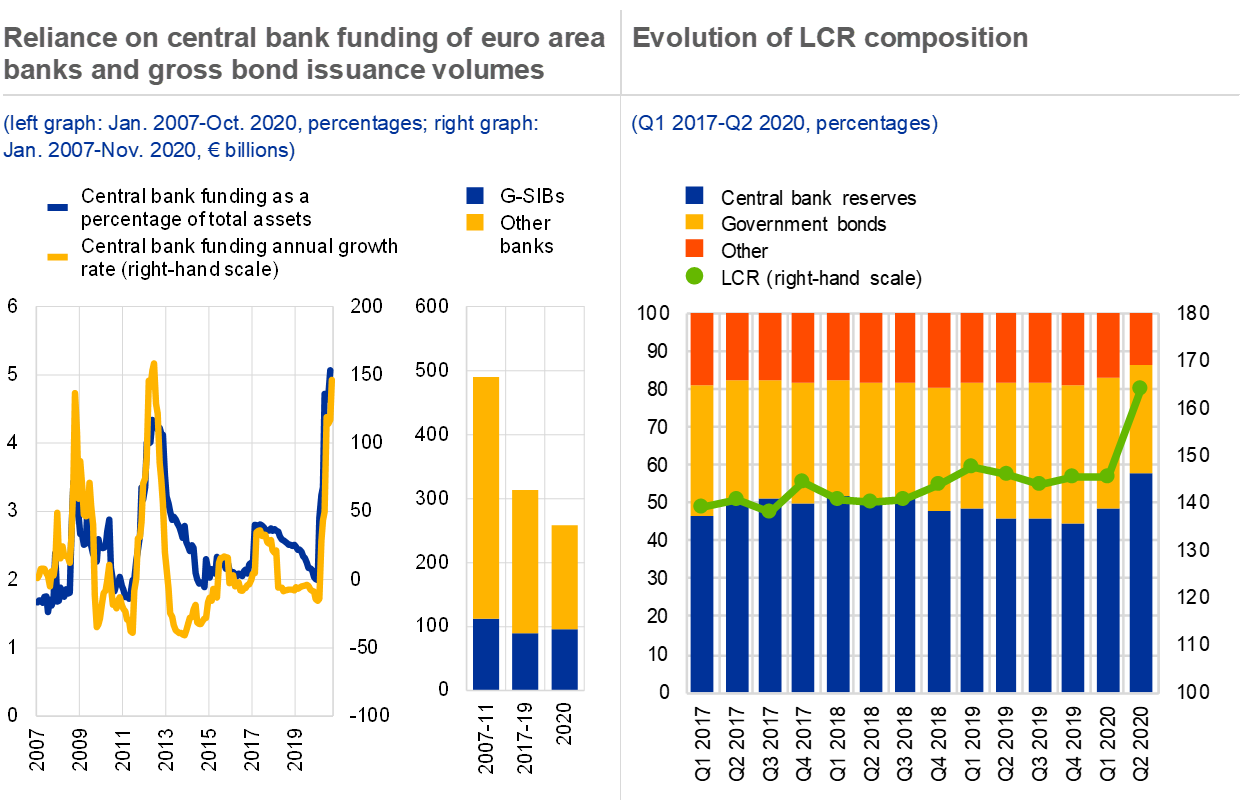
Sources: Left panel: MFI balance sheet item (BSI) statistics. Right panel: ECB supervisory data and ECB calculations.
Some banks could also face an abrupt increase in funding costs from ratings downgrades which have not yet materialised despite the deteriorated outlook. The credit ratings of euro area banks have remained broadly unchanged since the end of 2019 as rating agencies have tried to assess the economic repercussions of the pandemic and the resulting impact on banks (see Chart 3.16, left panel). While the issuer ratings of banks have not changed substantially, the share of banks with a negative outlook rose in the first half of 2020 (see Chart 3.16, right panel). This increase was less pronounced in Italy, where more banks are closer to the non-investment grade threshold. If a worsening in the economic outlook prompts downgrades particularly from investment grade to high yield this could lead to substantially higher market funding costs for the banks concerned (see Box 3).
Chart 3.16
The mix of a weaker rating outlook for banks and largely unchanged issuer ratings raises risks from negative macroeconomic surprises
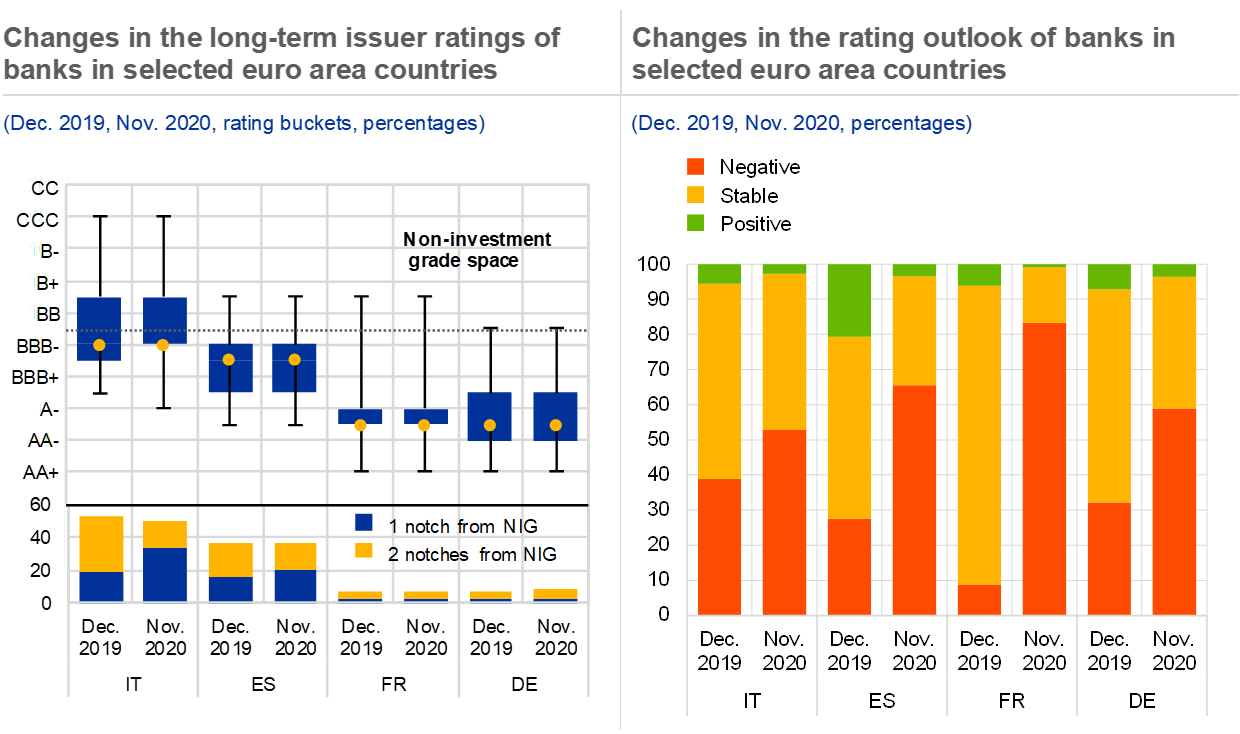
Sources: DBRS, Fitch Ratings, Moody’s Analytics, S&P Global Market Intelligence and ECB calculations.
Note: The ratings and outlooks shown represent the worst of the long-term issuer ratings assigned to each bank by S&P Global Market Intelligence, Moody’s Analytics, Fitch Ratings and DBRS.
3.2 Using scenario analysis to evaluate the resilience of the euro area banking sector
This section presents a “top-down” assessment of the solvency and profitability of euro area credit institutions under two scenarios. The impacts of a baseline and an adverse scenario are assessed using the ECB’s macro-micro model[30] relying on information about the banking sector up to the second quarter of 2020. The model covers over 90 large and medium-sized euro area banks in the 19 euro area countries. In the model, banks adjust their balance sheets in response to economic conditions[31] and economic conditions are influenced in turn by collective bank responses. This methodological difference, as well as less adverse assumptions regarding market and operational risks, means that the results presented in this section are not directly comparable with those from the supervisory stress tests of the EBA and ECB Banking Supervision.[32]
The baseline and adverse scenarios
The baseline scenario is consistent with the September 2020 ECB staff macroeconomic projections. Real GDP in the euro area is projected to fall by 8.0% in 2020 before rebounding by 5.0% in 2021 and 3.2% in 2022 (see Chart 3.17). This reflects the assumption that there will be some success in containing the virus but that targeted containment measures will continue.
The adverse scenario is derived as a tail event reflecting the risk of a protracted pandemic and continued weakness in the global economy (see Box 6). There is a year-on-year peak-to-trough decline in euro area real GDP of 11% in 2020 and, in the light of the resurgence of the pandemic, a year-on-year growth rate in real GDP that remains negative in 2021. Euro area unemployment rises steadily to 12% by the end of the scenario horizon. The spread between the euro area weighted average ten-year government bond yield and the EURIBOR widens by around 200-300 basis points compared with 2019 with dispersion across countries, reflecting sovereign debt sustainability concerns.
Chart 3.17
A gradual rebound in economic conditions in the baseline scenario and a prolonged recession in the adverse scenario
Euro area GDP falls significantly in 2020 and 2021 in the adverse scenario
(percentages)

Sources: Eurosystem, ECB staff macroeconomic projections and ECB calculations.
Notes: The last historical data point included in the adverse scenario is Q2 2020. From Q3 2020 the adverse scenario is based on stochastic simulations from the macro-micro model.
Impact on banks
The subdued economic growth assumed in the September 2020 ECB staff projections points to a potential decline in banks’ ROE to below zero in 2020 and a slow rebound thereafter (see Chart 3.18, bars in the left panel). The negative outlook for bank profitability follows negative economic growth in 2020, with credit risk losses increasing towards the end of 2020 in particular (see Chart 3.18, right panel). Although there is a modest but continuous increase in net interest income (see Chart 3.18, right panel), it remains low by historical standards due to the low interest rate environment and generally low returns on new lending, including lending backed by guarantees.
Under the adverse scenario, credit risk losses rise close to 20% of banks’ equity, driving profitability lower in 2021 and 2022 (see Chart 3.18, right panel). This reflects a significant worsening in the probability of default and loss given default of loans. Net interest income declines, reflecting significantly lower lending volumes and higher funding costs in adverse conditions.
Chart 3.18
Credit risk losses are the main negative driver of bank profitability going forward

Sources: Individual institutions’ financial reports, EBA, ECB and ECB calculations.
Lending to the non-financial private sector is expected to decelerate at the end of 2020. Nevertheless, the growth rate of lending to the real economy is expected to remain positive (see Chart 3.19). Lending for consumption purposes appears to be more sensitive to changing economic conditions, and the dynamics of lending to NFCs is supported the most by enacted mitigation policies. Under the adverse scenario, lending volumes are expected to contract in both 2021 and 2022 (see Chart 3.19).
Chart 3.19
Slowdown in lending in the baseline scenario and strong contraction in the adverse scenario
Annual growth of loans to the non-financial private sector
(percentages)
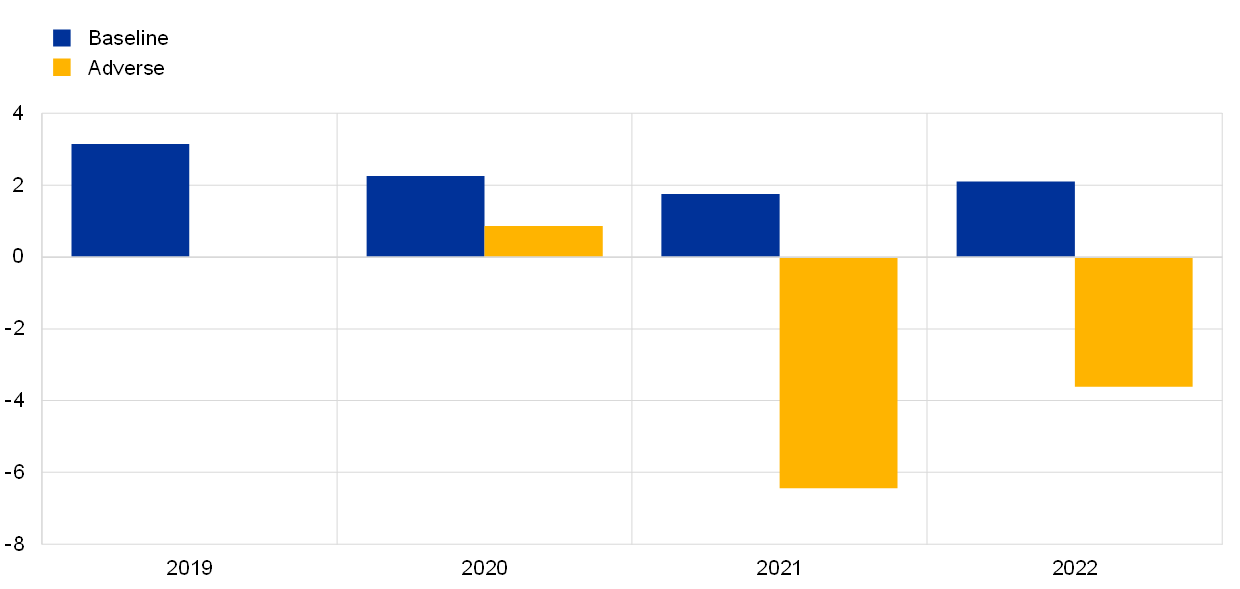
Sources: Individual institutions’ financial reports, EBA, ECB and ECB calculations.
Under the baseline scenario, the aggregate Common Equity Tier 1 (CET1) ratio of euro area banks is projected to decrease by about 1.3 percentage points to 13.6% by the end of 2022. The deterioration in banks’ capital ratios reflects low profitability combined with a continued increase in bank assets, and to a lesser degree an increase in average risk-weighted assets, summing up to an overall increase in banks’ risk exposure amounts (see Chart 3.20, left panel).
Chart 3.20
Low profitability and an increase in risk-weighted assets weigh on CET1 ratios

Sources: Individual institutions’ financial reports, EBA, ECB and ECB calculations.
Notes: The category “Other” includes among others the effect of changes in other comprehensive income and the conversion of Additional Tier 1 or Tier 2 instruments into CET1. The latter effect is relevant for the interpretation of the adverse scenario.
In the adverse scenario, the aggregate CET1 ratio of euro area banks falls by 5 percentage points, but the sector remains resilient overall. The aggregate CET1 ratio falls from 14.9% to 9.9% by 2022,[33] reflecting a sharp contraction in banks’ profitability and a moderate increase in risk exposure amounts (see Chart 3.20, right panel).
Even so, the majority of euro area banks continue to meet their CET1 capital requirements.[34] Banks accounting for about 4% of euro area total banking sector assets in the baseline scenario and for about 28% in the adverse scenario would go below their combined buffer requirement.
Box 6
Selecting adverse economic scenarios for the quantitative assessment of euro area banking system resilience
The adverse scenarios used to assess banking system resilience quantitatively in the FSR are selected as extreme events. They are derived directly from the output of the macro-micro model.[35] Specifically, the model generates several thousand alternative paths for economic and bank-level variables using the combinations of macro-financial shocks sourced from their historical distributions. This results in a large set of both strong and weak scenarios, exemplarily illustrated for the euro-area GDP (see Chart A, left panel). Adverse scenarios for use in the analysis are then selected among adverse paths where the evolution of variables mirrors a particular narrative commonly linked to prevalent financial stability concerns for example, scenarios reflecting the economic effects of lockdowns. This approach contrasts to the methodology for scenario design used by the European Banking Authority (EBA) and ECB Banking Supervision, which relies more on judgment to select the scenario severity and calibrate the parameters.[36]
More4 Non-bank financial sector
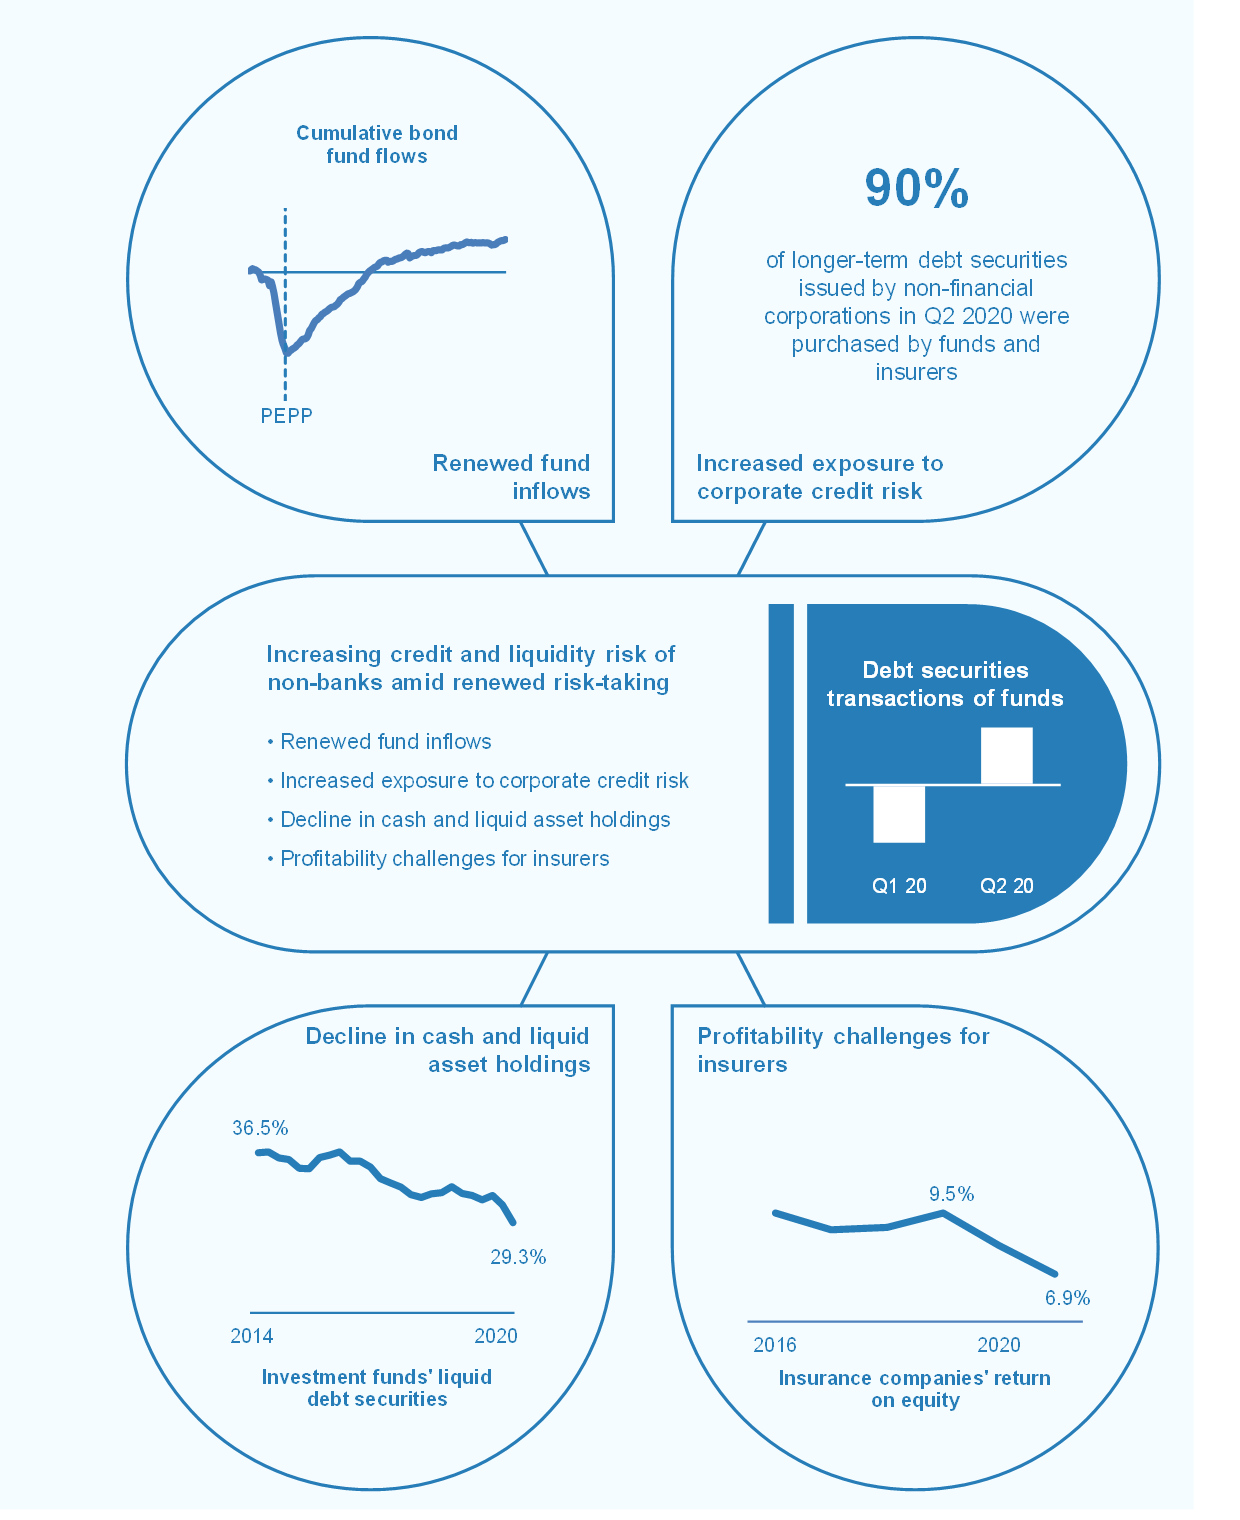
4.1 Non-bank financial sector supports the recovery while exhibiting renewed vulnerabilities
The non-bank financial sector has become increasingly important for the real economy in recent years. Market-based credit – marketable debt securities as opposed to loans – now accounts for around 20% of total external credit to non-financial corporations (NFCs). Non-bank credit, where the ultimate lender is a non-bank financial institution rather than a bank irrespective of the mode of financing, makes up around one-third of total credit from financial institutions.[37] Both measures have roughly doubled over the last decade (see Chart 4.1, left panel), driven mainly by an increase in both overall debt securities issuance and loans granted by other financial institutions (OFIs).[38]
Chart 4.1
Non-bank credit has expanded since the global financial crisis and continued to provide financing to euro area corporates after the initial coronavirus shock

Sources: ECB (euro area accounts, balance sheet item statistics, financial vehicle corporation statistics and securities holdings statistics) and ECB calculations.
Notes: The first measure in the left panel captures the share of market-based credit in the total external debt of euro area NFCs, irrespective of which sector is providing the credit. The numerator includes debt securities and non-retained securitised loans, while the denominator includes debt securities and all loans except for intragroup loans. The second measure captures non-bank credit, which is the share of credit provided by the non-bank financial sector to euro area NFCs relative to bank credit, irrespective of whether that financing is provided through loans or purchases of debt securities. Upper bound estimates include a residual of OFIs, while lower bound estimates exclude this. The right panel shows net transactions in debt securities with original maturities of over one year, issued in each quarter by euro area corporations. Non-banks include insurance companies and pension funds (ICPFs), investment funds (IFs) and money market funds (MMFs). Their relative share is expressed as a percentage of the sum of bank and non-bank purchases shown in the chart. Sensitive sectors are expected to be hit especially hard by the coronavirus-related restrictions; these include mining, manufacturing, retail and wholesale trade, transport, hotels and restaurants, and arts and entertainment.
The sector continued to provide significant financing for companies after the initial coronavirus shock, thus helping to support the recovery. Issuance by euro area NFCs was strong in the second quarter, as buoyant issuance activity by investment-grade firms continued, while high-yield firms’ bond issuance recovered strongly following a hiatus in March and April (see Chapter 2). Non-bank financial institutions have absorbed the vast majority of the new issuance, thereby supporting the economic recovery (see Chart 4.1, right panel). In particular, insurance companies and pension funds (ICPFs) and investment funds (IFs) have purchased substantial amounts of longer-term debt securities from sectors that are more sensitive to the economic fallout from the coronavirus pandemic. The relative share of non-bank financial institutions in financing more sensitive sectors has gone up from 84% at the end of 2019 to about 90% in the second quarter of 2020, while for less sensitive sectors the share has slightly declined.
At the same time, parts of the sector exhibit vulnerabilities associated with liquidity risk, credit risk and interest rate risk, some of which were exposed during the market turmoil in March. Credit provision by the non-bank financial sector can help diversify sources of corporate funding, and recent risk-taking is, to some extent, a desirable consequence of strong fiscal and monetary policy support (see Section 1.1). But the non-bank financial sector harbours structural vulnerabilities, such as maturity mismatches of life insurers or the mismatch between the liquidity of investment funds’ assets and their redemption terms (see Section 4.2). Such liquidity mismatches made parts of the money market and investment fund sector vulnerable to the large price corrections and redemptions seen during March.
Chart 4.2
Increased selling of debt securities by non-banks during the initial coronavirus shock and renewed inflows and risk-taking thereafter
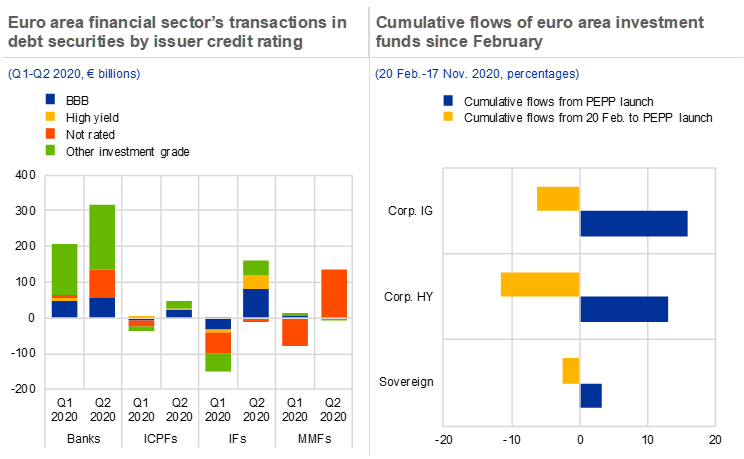
Sources: ECB securities holdings statistics, EPFR Global and ECB calculations.
Notes: The left panel covers net transactions in debt securities by the euro area sectors shown in the chart; this includes securities issued by financial and non-financial corporations and governments in the euro area and globally. The right panel shows total cumulative net flows as a share of total net asset value (based on data reported by EPFR Global) after the start of the pandemic emergency purchase programme (PEPP) on 26 March 2020 and from 20 February to the PEPP launch. “Corp. IG” refers to investment-grade corporate debt and “Corp. HY” to high-yield corporate debt.
The market turmoil in March led to increased asset sales by non-bank financial institutions. Euro area investment funds and insurers to a lesser extent shed debt securities worth about €180 billion across all rating categories (see Chart 4.2, left panel). Deleveraging and a sudden rise in cash needs might have amplified the procyclical selling by investment funds and other institutional investors during that period of market turmoil. Euro area MMFs also sold off assets, almost exclusively short-term bank debt, worth around €80 billion (i.e. approximately 8% of their portfolio assets), while increasing their bank deposits and buying government debt securities.[39] Such procyclical selling of assets was less pronounced among ICPFs, whereas, on a net basis, banks bought government and bank bonds.
Non-banks have rebalanced their portfolios towards higher-yielding but riskier and potentially more illiquid assets after the market turmoil. During first quarter, non-banks sold significant amounts of their BBB-rated debt, a segment in which potential downgrades would create “fallen angels” (see Box 3).[40] Investment funds and ICPFs, which are the main holders of BBB-rated debt issued by euro area NFCs, sold about 9% and 6% respectively of their exposures to these securities, while the euro area banking sector kept its exposures almost constant. However, debt securities sold by investment funds during the market turmoil in the first quarter were on average higher rated than net purchases during the second quarter, with about 25% of purchased assets in the high-yield segment (see Chart 4.2, left panel). Transactions in debt securities by ICPFs exhibited similar patterns, although total amounts were smaller. The recent surge in purchases of debt securities with higher credit risk is partly driven by renewed inflows into corporate bond funds, across the high-yield and investment-grade segments, which have more than offset the outflows they experienced during March (see Chart 4.2, right panel).
Going forward, renewed risk-taking and persistent structural vulnerabilities in parts of the non-bank financial sector could threaten the sector’s resilience. Given the long duration of their liabilities and nominal return targets, life insurers face particular challenges from the low interest rate environment, while non-life insurers have had to cope with increased claims stemming from the pandemic and natural catastrophes. As a result, insurance companies might seek to boost their returns by taking on more credit risk, liquidity risk and market risk, including by continuing to move into alternative asset classes.[41] Any significant rise in corporate credit risk would adversely affect the asset portfolios across the wider non-bank financial sector and could precipitate outflows from investment funds. Investment funds remain particularly susceptible to widespread outflows and renewed liquidity strains. Their overall liquidity position has deteriorated to some degree in recent months following initial increases in their cash positions and liquid asset holdings immediately after the turmoil in March (see Section 4.2). More generally, structural liquidity mismatches in bond funds and close interconnectedness with the rest of the financial system could again serve to amplify market volatility in a renewed stress scenario.[42] Given that companies are increasingly reliant on non-bank finance, such vulnerabilities highlight the need to strengthen the resilience of the non-bank financial sector to ensure that it represents a resilient source of funding at all times (see Section 5.2).
4.2 Investment funds increase their risk-taking
Since the pandemic emergency purchase programme (PEPP) started, euro area money market funds and corporate bond investment funds have consistently experienced significant inflows. Euro area-domiciled money market funds and investment-grade corporate bond funds have seen cumulative inflows of about 15% of assets under management (AuM). The high-yield corporate bond funds, which were the hardest hit during the turmoil, have also seen strong inflows of almost 12% since the start of the PEPP (see Chart 4.3, left panel). This reflects a recovery in investors’ risk appetite and financial conditions in the wake of large fiscal and monetary stimulus measures (see Chapter 2). Nevertheless, the growth of the whole investment fund sector was limited to 7.7% of AuM, held back mostly by equity funds. Funds of this type account for half of the sector in terms of AuM, and flows into such funds have not fully recovered to pre-pandemic levels.
Chart 4.3
Money market and investment-grade corporate bond funds saw marked inflows that only partially went into purchases of euro area NFC and sovereign debt securities

Sources: EPFR Global, Refinitiv, ECB securities holdings statistics and ECB calculations.
Notes: Data refer to euro area-domiciled funds only at daily frequency. Right panel: transactions in Q1 and Q2 2020 refer to securities sold/purchased during the first and second quarters of 2020. “Share of euro area securities” refers to the fraction of euro area securities sold/purchased in the total transaction amount by that sector. Given that MMFs invest in assets with short maturities, the large amount purchased by MMFs may reflect repeat purchases of essentially the same debt securities during the quarter.
In turn, investment and money market funds directed the inflows of funds into NFC and sovereign debt securities (see Chart 4.3, right panel). In the second quarter of 2020, investment funds expanded their portfolio of NFC debt by €100 billion after selling €150 billion of mostly sovereign debt securities in the dash for cash during the market turmoil. Around one-third of total investment fund purchases in the second quarter were of securities issued by euro area residents, highlighting the important role that investment funds have been playing in financing the recovery. The remainder predominantly reflected purchases of US NFC and sovereign debt. MMFs sold bank debt in March, while purchasing €100 billion of government securities in the second quarter. Given that MMFs invest in assets with short maturities while the data are quarterly, the large amount purchased by MMFs may reflect repeat purchases of essentially the same debt securities during the quarter. The reallocation from bank to sovereign debt was driven by investors’ flows across different types of MMF, with flows away from fund types investing in riskier securities into those investing primarily in government debt.[43]
Chart 4.4
After a brief reversal during the market turmoil in March, investment funds have reverted to their pre-pandemic trend of increasing liquidity risk

Sources: EPFR Global, Refinitiv, ECB securities holdings statistics and ECB calculations.
Notes: Left panel: highly liquid assets correspond to Level 1, liquid assets to Levels 2A and 2B and assets with little or no liquidity to non-HQLA. Right panel: distribution of liquid assets over total assets across funds by fund type. The boxes correspond to the interquartile range, and the whiskers to the 10th-90th percentiles. The left and right-hand scales are cut at 35% and 70% respectively to improve the visualisation; however, the 90th percentile for high-yield funds reaches 67%, 71% and 95% respectively at the displayed dates; the 90th percentile of MMFs exceeds 93% in all periods. Liquid assets include cash and HQLA (high-quality liquid asset) bonds. Data refer to euro area-domiciled bond funds and MMFs only. High-yield corporate bond funds are euro area-domiciled funds which primarily invest in high-yield bonds. This sample is distinct from the corporate bond fund sample, which has a broader investment focus.
Over the past years, investment funds have taken on more liquidity risk in the search for assets offering higher returns. For instance, the share of liquid debt securities held by euro area investment funds has constantly declined, from 36% in 2013 to less than 30% in June 2020 (see Chart 4.4, left panel). The decreased share of liquid assets has reduced the sector’s ability to absorb a shock to market liquidity accompanied by large outflows, as experienced in March, and contributed to the amplification of market dynamics.[44]
Liquidity risk in funds has started to increase again, after a temporary improvement in liquidity positions following the March turmoil. During March, all investment fund types significantly increased their holdings of cash and liquid assets (see Chart 4 in the Overview, and Chart 4.4, right panel) in the face of redemptions, but also to meet margin calls in securities lending and derivative transactions.[45] In the second quarter of 2020, this reversed on aggregate. Over this period, MMFs increased their holdings of liquid assets only slightly. Corporate bond funds returned to their pre-turmoil levels. Liquid assets of high-yield corporate bond funds have declined since March, but are still twice the size seen in the fourth quarter of 2019. That said, high-yield funds have more illiquid assets in their wider portfolios than other fund types, which means they face greater exposure to redemption risk.
A decline in the liquidity of euro area investment funds coincides with an increase in exposure to securities with longer durations and lower credit ratings (see Chart 4.5). In the second quarter, investment funds increased their holdings of riskier securities: around 70% of new investments were in securities with longer durations (i.e. due in between five and ten years or over ten years) and around 65% were in securities with lower ratings (high yield and BBB), higher than in the past (see Chart 4.5, left panel). The €55 billion increase in holdings of BBB securities, the lowest-rated securities in the investment-grade category, exposes funds to downgrades of these securities to the high-yield category (see Box 3). An additional cliff-edge risk to the investment fund sector comes from the potential end of government support to the corporate sector, including the end of repayment holidays and guarantees. This could lead to rating downgrades, a sharp increase in corporate defaults and further market volatility (see Chapters 1 and 2).
The increase in investment funds’ exposure to longer-duration and lower-rated corporate debt reflects a changing market environment and riskier bond portfolios. As bond yields have declined in the euro area and globally, the share of negative-yielding assets in fund portfolios has increased over the recent years, standing at 15% in the second quarter (see Chart 4.5, right panel). Half of the funds’ debt portfolio currently yields 2% or less. At the same time, investment funds hold a higher share of relatively high-yielding assets compared with the overall market. About 30% of the funds’ bond portfolio currently yields 2% or more (see Chart 4.5, right panel), which compares with 10% of the outstanding amounts with a similar yield (see Chart 3, left panel, of the Overview). The broader-based decline in bond yields continues to put pressure on the medium-term absolute performance of bond funds and could intensify the search for yield.
Chart 4.5
Investment funds increased their exposure to longer-duration and lower-rated NFC debt, with about half of the debt portfolio offering a yield of 2% or less

Sources: ECB securities holdings statistics and ECB calculations.
Notes: Data refer to euro area non-MMF investment funds. Left panel: global NFC holdings and transactions, H refers to holdings, T to transactions. Right panel: total bond holdings.
During the pandemic, there has been a strong appetite for environmental, social and corporate governance (ESG) financial instruments and green bonds (see Box 7). Assets under management of euro area bond and equity ESG funds have tripled in the past ten years to reach €1.3 trillion in 2020 (see Box 7, Chart A, left panel). During the pandemic, ESG funds have proved more resilient than their non-ESG peers (see Chart 4.6, left panel, left chart) with cumulative inflows of around 15-20% since the turmoil in March. In comparison, both equity and bond non-ESG funds have not recovered as well from the outflows in March despite a similar performance between ESG and non-ESG funds in terms of returns (see Chart 4.6, left panel, right chart).[46] The green bond market is also growing rapidly and currently exceeds €350 billion (see Chart 4.6, right panel). Among euro area investors, investment funds are the largest holders of green bonds, with a gradually increasing share that has reached 20% in 2020.
Chart 4.6
Increasing investor interest in green financial products: growth and better resilience of ESG funds and green bonds
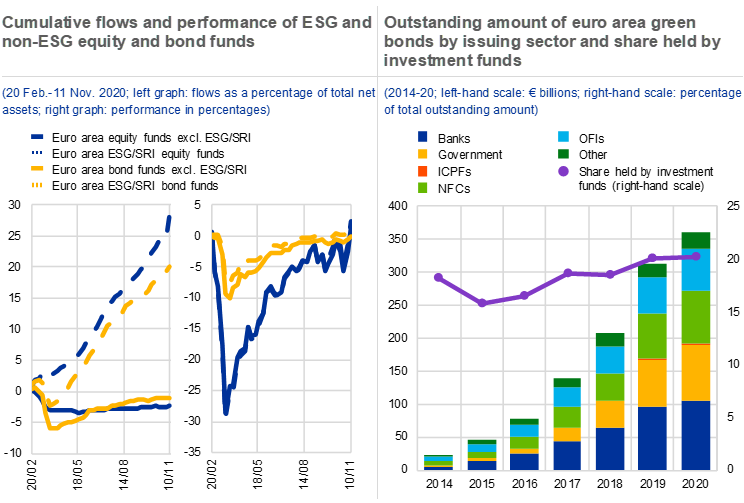
Sources: EPFR Global, Dealogic, ECB securities holdings statistics and ECB calculations.
Notes: Left panel: weekly observations from 20 February 2020 to 11 November 2020. ESG: environmental, social and corporate governance investments; SRI: socially responsible investments. Right panel: “Other” refers to currently non-attributed sectors. The holdings are by euro area investment funds only. The outstanding amounts and holdings are as at year-end (in 2020 as at June 2020).
Box 7
The performance and resilience of green finance instruments: ESG funds and green bonds
Green financial markets are growing rapidly globally. Assets of funds with an environmental, social and governance (ESG) mandate have grown by 170% since 2015 (see Chart A, left panel). The outstanding amount of euro area green bonds has increased sevenfold over the same period. Given the financial stability risks stemming from climate change,[48] this box aims to understand the performance of such products and their potential for greening the economy. It focuses on the resilience of ESG funds and the absence of a consistent “greenium” a lower yield for green bonds compared with conventional bonds with a similar risk profile reflecting the fact that green projects do not benefit from cheaper financing.
More4.3 Profitability pressures could induce further risk-taking by insurers
Despite significant losses, the solvency of insurance companies in the euro area has generally remained solid during the crisis caused by the pandemic (see Chart 4.7, left panel). Asset valuation losses in the first quarter of the year and a further decline in interest rates weighed on solvency ratios (see Chapter 2). But the sector’s capital positions were supported by the market recovery in the second quarter, together with the suspension of share buyback programmes and dividend payouts.[49] Looking ahead, solvency ratios could weaken on the back of credit downgrades and defaults, changes in the valuation of illiquid asset exposures, such as real estate, a reversal in the regulatory volatility adjustment or higher claims.
In view of the greater sovereign vulnerabilities due to the pandemic, financial markets also link the solvency of insurers to the creditworthiness of their respective sovereigns. Credit default swap (CDS) spreads indicate a close relationship between the default risk of euro area insurers and their sovereigns (see Chart 4.7, right panel). The link is especially pronounced for insurers in lower-rated countries. This reflects the fact that insurers in some euro area countries invest heavily in domestic sovereign debt.[50] As a result, the refinancing costs for insurers’ €135 billion of outstanding debt could increase in the event of renewed stress in sovereign markets.
Chart 4.7
Insurers’ solvency ratios remain strong despite recent deterioration, while their creditworthiness is also linked to that of their sovereign

Sources: SNL, S&P Global Market Intelligence and ECB calculations.
Notes: Left panel: based on a sample of up to 19 large euro area insurers offering life and non-life products. The full sample is not covered in 2020 due to reporting lags. Right panel: based on monthly data for a sample of ten euro area insurance corporations. Lower-rated countries refer to euro area countries with credit ratings below high grade (AA-) during the sample period.
The pandemic has weighed on insurers’ profitability due to lower revenues. The market turmoil in March led to the average return on investment plummeting, with several insurers suffering negative investment income in the first quarter of the year (see Chart 4.8, left panel). The lockdown and the resulting economic contraction caused the growth of gross premiums written to collapse as well, with life insurers more heavily affected (see Chart 4.8, right panel). Looking ahead, these revenues may struggle to recover to pre-crisis levels given the ever higher share of low-yielding assets (see Chapter 2), which is likely to weigh on investment income. Also, household demand for life insurance products is likely to remain feeble amid the recession.
Insurers and reinsurers face potentially higher claims stemming from the pandemic and a relatively large number of natural catastrophes. Coronavirus-related claims mainly stem from travel and event cancellation, business interruption and trade credit lines. To date, these losses are estimated to be in the mid-double-digit USD billion range globally. In addition, high natural catastrophe losses could arise from this year’s active hurricane season and several floods, storms and wildfires, including those in Australia and southern California. Compared with last year, insured losses from natural catastrophes in the first half of this year increased by almost 50% to USD 28 billion.[51] These developments highlight the ongoing risks that climate change poses to the insurance sector.[52]
Additional claims from renewed lockdowns are expected to be lower than at the beginning of the pandemic. Most event cancellation losses have been booked assuming disruptions until at least the end of 2020 and exclusions are applied to new business. Travel insurance claims will be significantly lower due to the reduction in travel. Business interruption policies have also been revised or clarified to exclude pandemics, although litigation on old contracts is set to continue. From a life insurance perspective, the mortality rate from the coronavirus appears to be lower than immediately after the initial outbreak. Moreover, social distancing could reduce the cyclical increase in claims due to the normal flu season.
Chart 4.8
Insurers’ profitability declined because of lower investment and premium revenues, coupled with potentially higher claims going forward
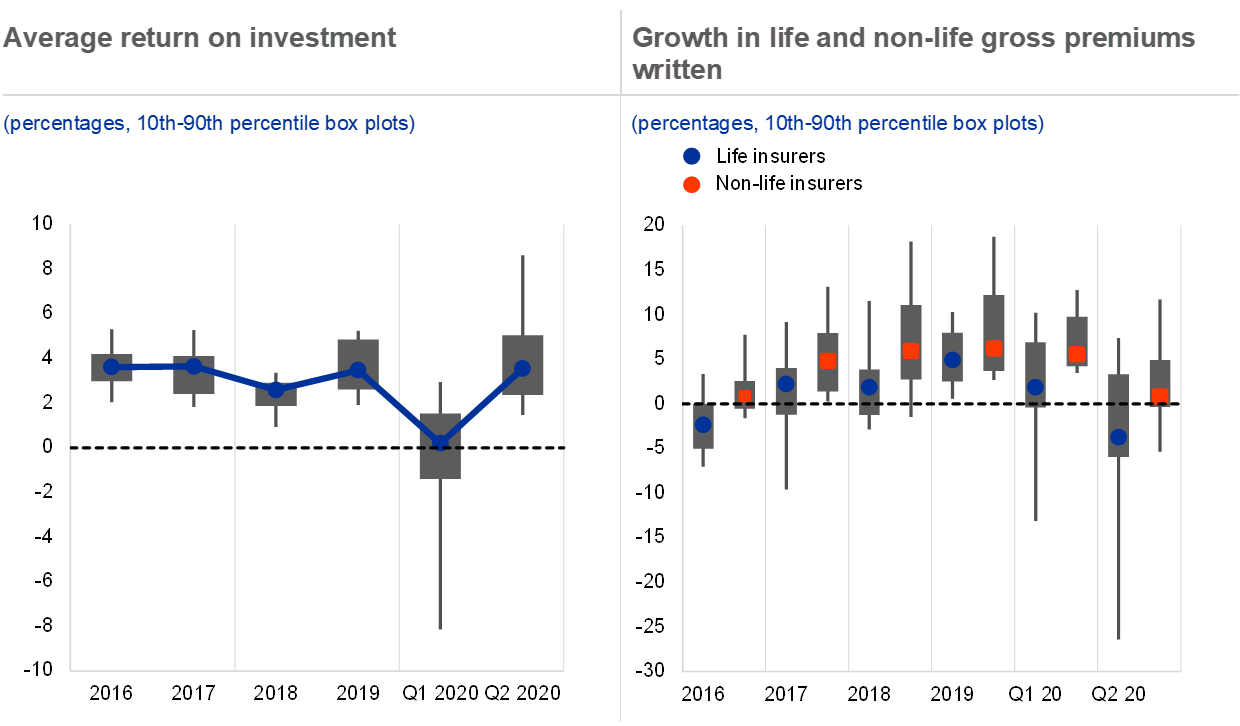
Sources: S&P Global Market Intelligence and ECB calculations.
Notes: Based on a sample of up to 19 large euro area insurers offering life and non-life products. The full sample is not covered in 2020 due to reporting lags.
The ongoing rise in the cost of premiums could help to improve non-life insurers’ and reinsurers’ profitability in the future, but this may also lead to insurance protection gaps. Global non-life insurance prices have risen sharply over the last three years (see Chart 4.9, left panel). In Europe, this hardening of the market is mainly driven by rising underwriting losses from natural catastrophes and other property insurance lines. The acceleration of price growth in 2020 is also attributable to coronavirus-related losses. These developments could be an advantage for larger composite insurers, whose thriving non-life lines could compensate for lower earnings in a life segment that is struggling in the present low-yield environment. At the same time, such price growth could make some insurance products increasingly unaffordable. This raises questions about the emergence of insurance protection gaps, including in relation to pandemics and some weather-related risks associated with climate change, which could eventually become uninsurable by the private sector.[53]
Chart 4.9
Non-life insurers’ profitability could benefit from the ongoing rise in premium prices, while investors have a pessimistic view of the life insurance sector
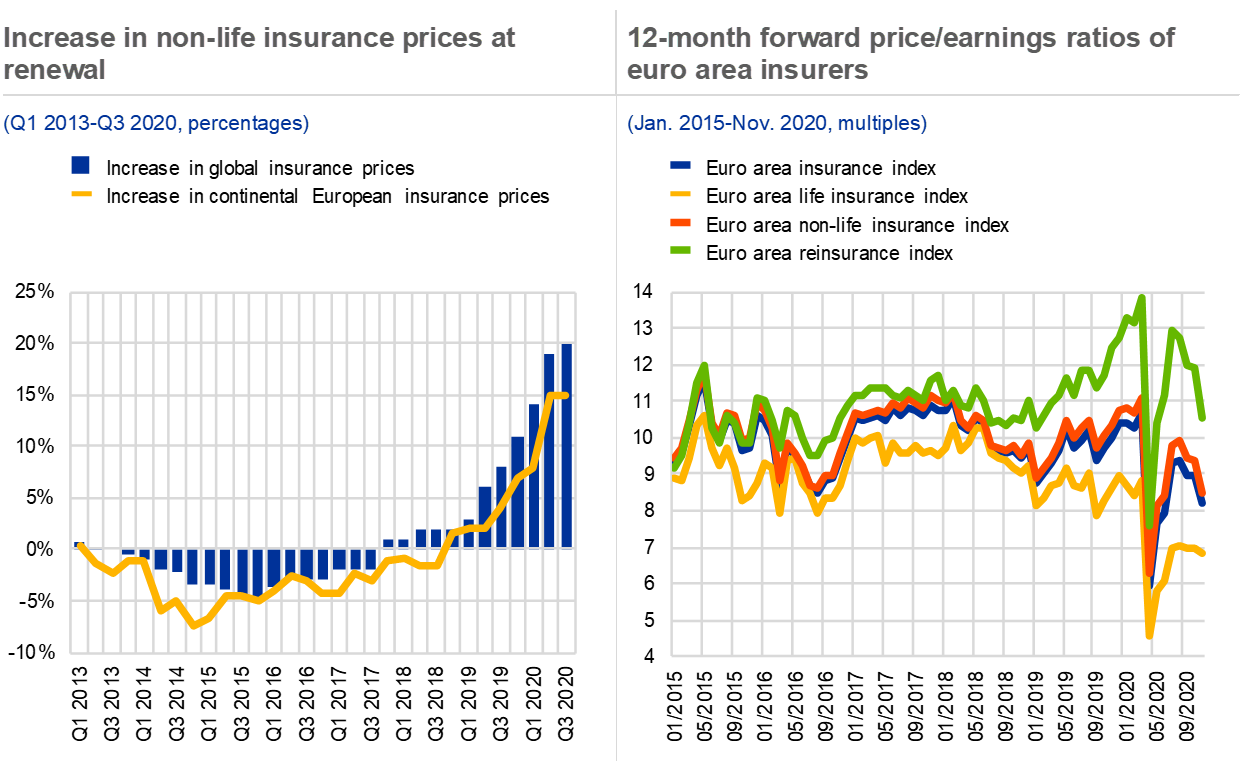
Sources: Marsh Global Analytics, Refinitiv and ECB calculations.
Rising insurance premiums and the accompanying positive market sentiment could help non-life insurers to recapitalise if needed. While remaining volatile, price/earnings ratios of non-life insurers and reinsurers have broadly recovered from their trough during spring (see Chart 4.9, right panel). Several insurance companies have already managed to raise additional capital this year, allowing them to strengthen their solvency positions. But with their price/earnings ratios well below the historical average, the prospects of life insurers are still viewed pessimistically, likely reflecting concerns about the challenges to the sector from the low-yield environment.
Chart 4.10
While insurers’ aggregate liquidity positions appear solid, low rates for longer may induce further risk-taking

Sources: ECB securities holdings statistics, ECB insurance corporation balance sheet statistics and ECB calculations.
Notes: Left panel: projections of future portfolio shares by rating are based on the whole debt securities portfolio of euro area insurers. It is assumed that all securities currently in the portfolio are held to maturity. All maturing securities are replaced such that the debt portfolio size is kept constant. For the new purchases, average yields of newly issued debt purchased by insurers during the second quarter of 2020 are used for the different rating groups. Green lines indicate average coupon income if 2019 portfolio shares are maintained. The light blue line (first projection) assumes that all maturing assets are reinvested such that the average portfolio coupon income is kept constant at the 2019 level (2.8%). The purple line (second projection) assumes that maturing assets are reinvested such that the drop in investment income under the green line is dampened by 50%. For the portfolio restructuring it is assumed that the proportions of the investment-grade/non-rated shares remain constant relative to each other, while the high-yield share is increased as much as needed to reach the projection yield target. This is necessary because only high-yield securities offered a higher return than the average portfolio income during the second quarter. Right panel: HQLA (high-quality liquid asset) Level 1 assets include debt securities in accordance with Commission Delegated Regulation (EU) 2015/61. This defines liquidity requirements for banks and is used here as a proxy for the insurance sector.
The pressures on profitability from low interest rates and higher claims could induce further risk-taking by insurers. Maintaining sufficiently high investment income in the current interest rate environment could require insurers to rebalance their portfolios towards higher-yielding, but riskier assets. If the debt portfolio shares by rating were kept constant, average coupon income would fall from 2.8% in 2019 to 2.1% in 2025 (see Chart 4.10, left panel). Instead, keeping the portfolio income at its 2019 level would require insurers to increase the share of high-yield assets from 2% of their debt securities portfolio to 30% by 2025. Even under a more moderate scenario, where the decline of portfolio income is only halved, the high-yield share would need to increase to 16% in 2025. In practical terms, such an investment policy would be difficult to achieve both because solvency capital requirements would increase disproportionately with the high-yield portfolio share and because of the limited supply of high-yield debt. A significant reduction of investment income over the medium term thus seems inevitable, despite higher risks being taken on. As a result, insurers may also continue to invest larger shares of their portfolios in alternative asset classes. This could help boost their investment income, but may also increase their credit risk and liquidity risk further.[54]
The liquid asset holdings of insurers have remained relatively stable overall, but may mask some heterogeneity. Cash, MMF shares and the most liquid debt securities represented 5.5%, 1.5% and 21% respectively of the sector’s total assets in the second quarter of 2020 (see Chart 4.10, right panel). While cash holdings have decreased, liquid assets have been broadly unchanged overall in recent years. But the stability in the aggregate liquid asset holdings at quarterly frequency masks considerable liquidity needs faced by some insurers during the coronavirus shock (see Box 8). These liquidity risks highlight the need for improved liquidity monitoring in the insurance sector (see Chapter 5).
Box 8
Interconnectedness of derivatives markets and money market funds through insurance corporations and pension funds
In the most turbulent week during the coronavirus-related market turmoil in March 2020, euro-denominated money market funds (MMFs) experienced very high outflows.[55] But which investors withdrew from these funds and why did they do so? This box suggests that the increase in variation margin (VM) on derivatives contracts held by euro area insurance corporations and pension funds (ICPFs) was one of the key drivers behind these outflows.[56]
More5 Macroprudential policy issues
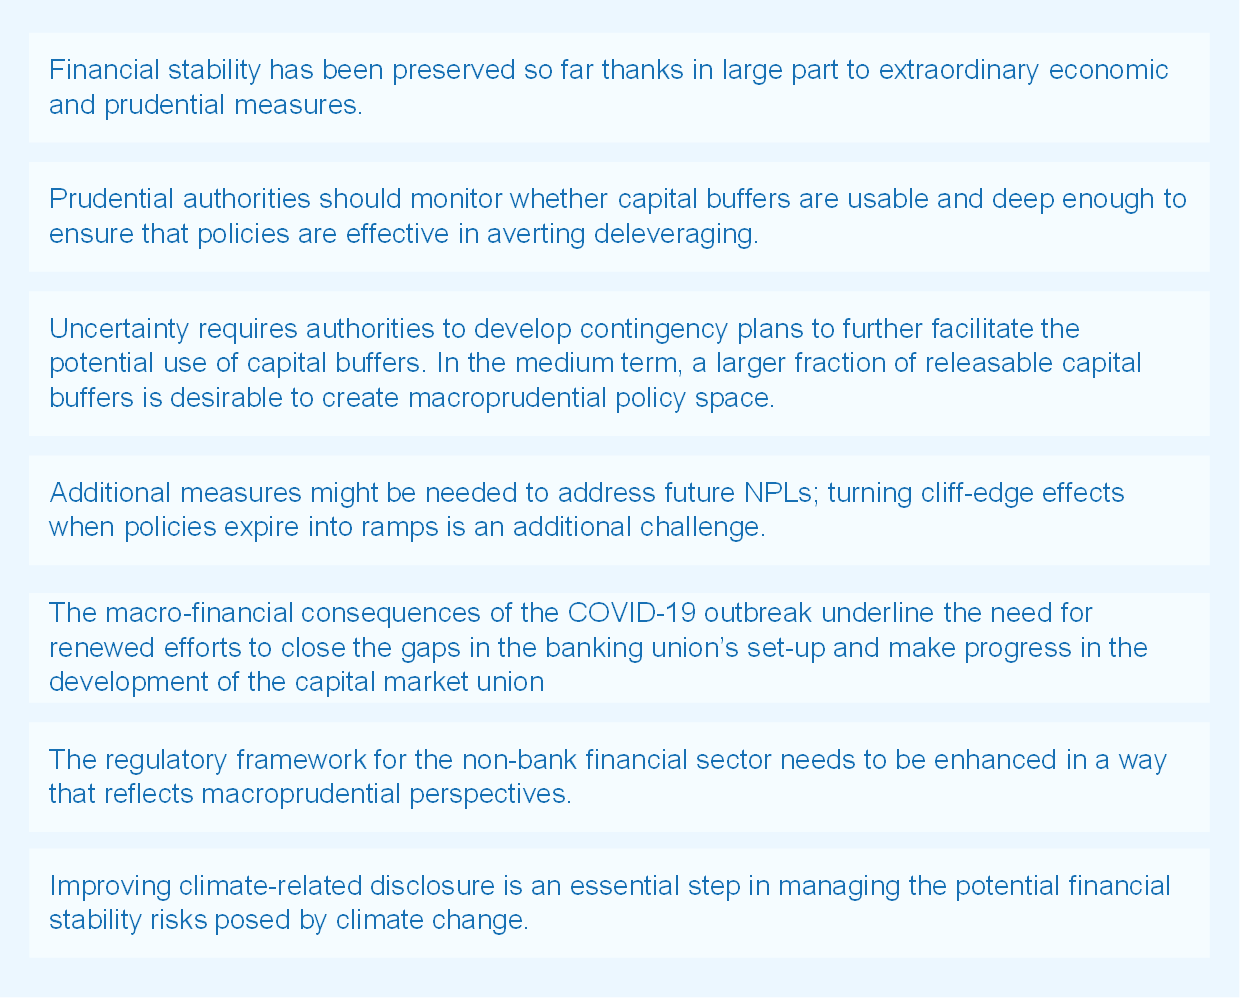
5.1 Banking sector policies
The extraordinary policy measures launched earlier this year have so far helped the economy and mitigated risks to financial stability. Some of the economic impact of the coronavirus pandemic has been cushioned by fiscal measures, including household and corporate income support, loan guarantees and payment moratoria, coupled with the ECB’s expanded set of unconventional monetary policy measures and prudential actions (see Chapter 1 and Special Feature A). In particular, these measures have been successful up to this point in preventing the immediate materialisation of credit risk and the formation of adverse feedback loops between the real economy and the financial system.
Since the May 2020 FSR, prudential authorities and regulators have taken further steps to ensure that banks remain resilient. After the initial actions to reduce banks’ incentives to constrain credit,[57] prudential authorities took additional steps to prevent banks’ capital positions being unduly weakened by dividend distributions.[58] Targeted revisions to the Capital Requirements Regulation known as the “quick fix” were published on 26 June. The revisions provide further flexibility to banks in responding to the challenging situation. For a sub-sample of listed banks which disclosed a positive impact from these regulatory changes, the median Common Equity Tier 1 (CET1) ratio improved by around 30 basis points (see Chapter 3). First, the changes included adjustments to the minimum amount of capital that banks are required to hold for non-performing loans (NPLs). This was done by extending the preferential treatment of such loans guaranteed by export credit agencies to NPLs guaranteed or counter-guaranteed by national governments or other public sector guarantors. Second, the transitional arrangements related to the implementation of the international accounting standard IFRS 9 were extended by two years, allowing banks to mitigate the potential negative impact of a likely increase in the provisions they recognise for expected credit losses. Third, targeted changes were made to the calculation methodology for the leverage ratio, allowing banks to exclude central bank exposures from their leverage ratio, and the introduction of the leverage ratio buffer was delayed by one year to January 2023.[59]
As macro-financial conditions evolve, prudential authorities will need to monitor the effectiveness of policies and develop contingency plans for further measures. The initial decisive policy reaction together with capital positions built up by banks since the global financial crisis enabled banks to meet the increased demand for credit from firms facing liquidity stress. Nevertheless, measures may not all be as effective as intended, should conditions worsen; for example, it is not clear whether capital buffers will be deep enough and whether banks will use them without excessive deleveraging. Therefore, prudential authorities will need to monitor the effectiveness of policies, including banks’ willingness to use buffers. If issues are identified, or the economic situation deteriorates significantly, further measures may be needed. Contingency plans should be drawn up to facilitate the potential use of capital buffers. This contingency planning should also look into possibilities for further capital buffer release in case of need, while also considering the limitations and constraints set by the existing buffer regulation.
Ensuring that capital buffers are usable is crucial for macroprudential policy to be effective. Averting bank deleveraging hinges on banks’ willingness to let capital ratios decrease and use capital buffers, including both management buffers Pillar 2 guidance and the combined buffer requirement (CBR).[60] But banks might face market stigma effects if their capital ratios start to fall, with negative implications for funding costs or market valuations. Furthermore, the distribution restrictions that banks face when their capital ratio falls below the CBR might discourage them from drawing down buffers. Uncertainty regarding future losses might also induce banks to keep their capital ratios well above the CBR to avoid unintended breaches. Finally, potential uncertainty about the time given to replenish buffers could further discourage buffer use. While it is too early to draw firm conclusions, market intelligence suggests some unwillingness on the part of banks to make use of their buffers. Furthermore, banks most likely to suffer from usability impediments (e.g. those with capital ratios closest to the CBR) reduced risk weights the most in the second quarter, possibly reflecting an attempt to boost capital ratios (see Chart 5.1, left panel). At the same time, however, these banks continued to expand assets via lending (see Chart 5.1, right panel).
Chart 5.1
Risk weights have fallen most for banks closest to the CBR, suggesting an attempt to boost capital ratios by “de-risking” while continuing to lend as much as other banks
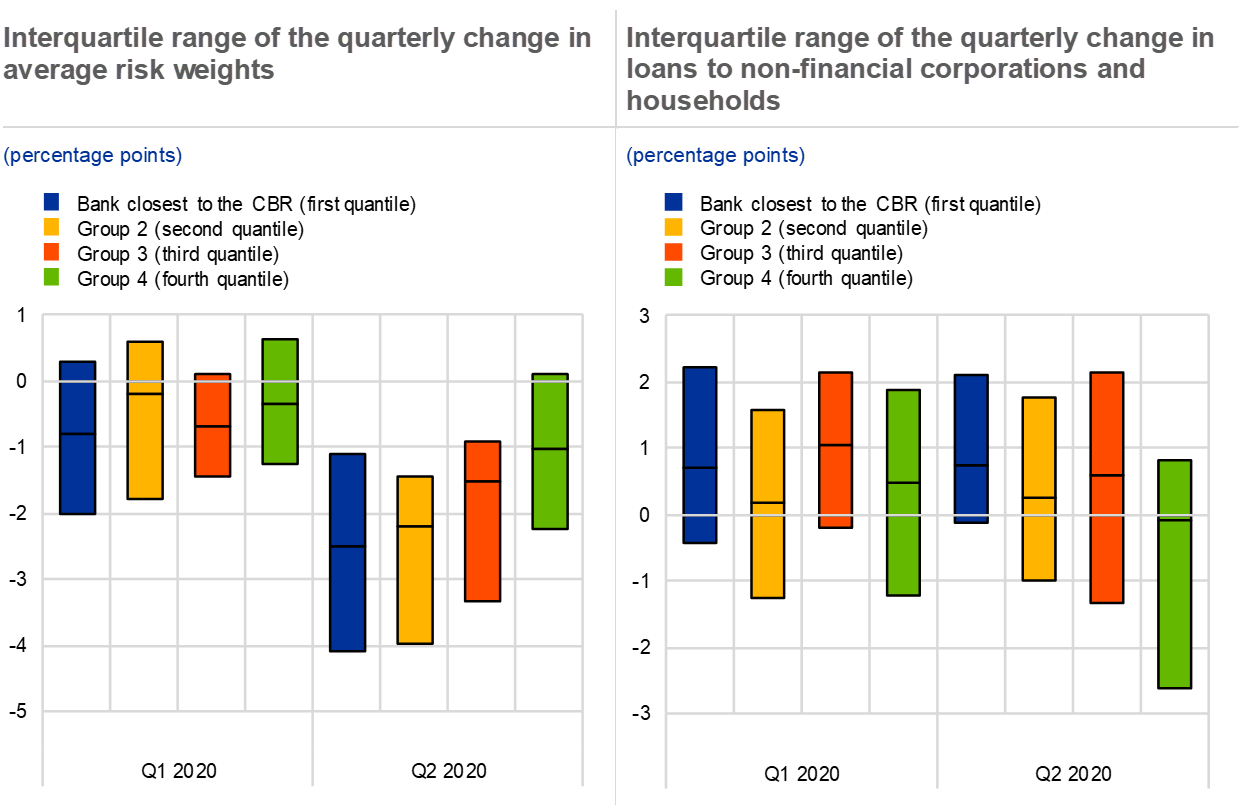
Sources: ECB supervisory data and ECB calculations.
Notes: Data for significant institutions. The distance from the CBR lies below the 25th quartile for banks allocated to group 1 (“Banks closest to the CBR”), within the 25th quartile and the median for banks allocated to group 2, within the median and the 75th quartile for banks in group 3 and above the 75th quartile for banks allocated to group 4. Grouping is performed on the basis of banks’ distance to the CBR threshold as reported in the first quarter of 2020.
In this context, communication by prudential authorities will play an important role in ensuring that banks are willing to use the buffers if needed. Specifically, communication by prudential authorities on the time horizon for the replenishment of buffers is important to shape bank and investor expectations in a business environment characterised by compressed profitability, limited capital-generation capacity and a high cost of bank equity capital. Against this backdrop, on 28 July 2020 ECB Banking Supervision encouraged banks to use their capital and liquidity buffers for lending purposes and loss absorption. Additionally, it stated that it will not require banks to start replenishing their capital buffers before the peak in capital depletion is reached, and in any case not before end-2022 (see Box 9).[61]
Further policy measures may also be required if distressed assets on bank balance sheets increase significantly. A large-scale, system-wide increase in NPLs would require a comprehensive approach at the national and EU levels. A full range of solutions should be considered, from on-balance-sheet workout by banks and bilateral portfolio sales through to centralised solutions such as asset management companies and NPL transaction platforms. At the same time, the choice of instruments should be tailored to the nature of the specific NPL problem.[62] Banks need to become better prepared individually to handle the increased NPLs[63] and recognise asset quality problems in a timely and accurate manner. A comprehensive approach should also facilitate market-based solutions. To this end, measures that improve the efficiency of secondary markets for NPLs, such as transaction platforms, should be considered at the European level to improve the quality and availability of data on NPLs and reduce barriers to entry for investors. Government-sponsored securitisation schemes, which have been successful in dealing with NPLs in some jurisdictions, could be used to support future disposals of distressed assets. Depending on the nature of the non-performing assets, public asset management companies may also play a role by freeing up bank balance sheets and acting as a reservoir for impaired assets to avoid fire-sale conditions.
In the medium term, a rebalancing between structural and cyclical capital requirements seems desirable to create macroprudential policy space. Releasing regulatory capital buffers accumulated in good times can support loss absorption and lending in a downturn. Analysis based on models of the euro area banking system (see Chart 5.2) shows that in the absence of prudential capital releases, banks’ capital targets in 2020 could have been pushed higher by the expectation of losses, creating pressure to deleverage. However, macroprudential policy space was limited at the onset of the pandemic, with the countercyclical capital buffer (CCyB), which is fully releasable, only accounting for a small fraction of bank capital in the euro area (0.11% against a CET1 ratio of 14.9%).[64] Increasing the share of buffers such as the CCyB that are releasable ex ante would make changes in capital requirements more predictable in times of crisis and enhance the credibility of the prudential framework.[65] Taking into account recent experience during the pandemic, a thorough review of the buffer framework is warranted to assess how a rebalancing between structural and cyclical buffers can best be achieved in the capital stack.
Chart 5.2
Capital relief measures helped to prevent a procyclical rise in bank capital targets
Change in announced target CET1 ratio since the fourth quarter of 2019
(percentages)

Sources: Bloomberg Finance L.P., ECB and ECB calculations.
Notes: The estimation is based on the findings of Andreeva, D., Bochmann, P. and Couaillier, C., “Financial market pressure as an impediment to the usability of regulatory capital buffers”, Macroprudential Bulletin, Issue 11, ECB, October 2020. The estimated coefficients, averaged using risk-weighted assets as weights, are applied to a panel of 31 large banks that announced target CET1 ratios both in the fourth quarter of 2019 and since the outbreak of the pandemic.
Finally, recent events demonstrate the need to close the gaps in the institutional set-up of the banking union. The establishment of the Single Supervisory Mechanism facilitated quick and decisive supervisory responses which ensured the continued functioning of the financial system while also preserving the level playing field across the banking union. The banking union remains unfinished, however, and efforts are required to improve its crisis management framework, establish its missing third pillar, the European deposit insurance scheme, and facilitate the flow of capital and liquidity within banking groups, while guaranteeing adequate safeguards for host Member States.
5.2 Non-bank financial sector policies
The resilience of the non-bank financial sector needs to be enhanced in a way that reflects macroprudential perspectives. Parts of the non-bank financial sector, including money market funds (MMFs) and some investment funds, experienced significant stress during the March market turmoil. The resilience of parts of the sector proved to be insufficient, and it became clear that existing (ex post) crisis management tools could not adequately mitigate the stress. Liquidity strains only started to ease after extraordinary monetary policy action was taken in the euro area and globally. The episode in March underlined the need for authorities to take a holistic and system-wide view, consider the role of different players and assess and design policies to address vulnerabilities in the non-bank financial sector, as also outlined by the Financial Stability Board (FSB).[66] For instance, structural vulnerabilities in MMFs and investment funds should be addressed and liquidity risks from procyclical margins mitigated. The events in March also underscored the importance of moving towards a stronger role for EU-wide supervision of capital markets, which would enhance cross-border risk monitoring and coordinated actions across Europe.[67] Throughout, policies should reflect the fact that the non-bank financial sector comprises a diverse set of entities and activities. Implementing macroprudential regulatory reforms should help both increase the resilience of the non-bank financial sector, ensuring that it provides a stable source of funding to the real economy at all times, and support the effective transmission of monetary policies. Such regulatory reforms should also reduce the need for extraordinary central bank interventions in the future, thus helping to alleviate concerns which may be associated with such action, such as risks to public funds and the creation of incentives for market participants to take on excessive risk.
Risks arising from the collective behaviour of investment funds require stronger pre-emptive policies. Such policies should be used to mitigate risk in the fund sector from a system-wide perspective. In particular, it should be ensured that the liquidity of a fund’s portfolio assets and its redemption terms are closely aligned. In addition, existing liquidity management tools, such as the suspension of redemptions, redemption gates or swing pricing, should be reviewed to ensure that they can help mitigate systemic risk. The role of fund leverage should also be assessed further, as it might have amplified procyclical selling and liquidity stress in financial markets during the market turmoil.
Requirements for MMFs should be reassessed in the light of the vulnerabilities which became evident during March.[68] Given that other market participants often use them as part of their liquidity management, MMFs should meet high standards regarding the stability of value and the ability to redeem at short notice, even in stressed market conditions. The possibility of suspending redemptions or imposing gates in a stress scenario can create unintended side effects, such as undermining market confidence and raising wider concerns among investors about a loss of the cash-like properties of MMF shares. Further work on MMFs should focus on enhancing liquidity features and removing incentives for investors to redeem early.
The market turmoil also highlighted the need to strengthen the resilience of insurance corporations and pension funds (ICPFs). ICPFs were less directly affected by the market stress in March than MMFs and investment funds. But they may have contributed to liquidity strains in MMFs due to their volatile cash needs driven by margin calls (see Box 8). From this perspective, regular monitoring and enhanced management of insurers’ liquidity risk – as anticipated by EIOPA’s recent draft advice[69] – should be key elements of the current review of Solvency II. Such liquidity risk management could encompass supervisory stress testing and new Pillar 2 liquidity provisioning requirements. This would be particularly useful for insurers with a vulnerable liquidity profile, such as those that hold derivatives and are subject to margin calls. The Solvency II review should also consider other macroprudential aspects such as symmetry in capital measures like the volatility adjustment, which would allow buffers to be built up during good times.[70]
The system-wide implications of sudden increases in initial and variation margin should be assessed. Margining requirements reduce counterparty credit risk, but they also increase liquidity risk – two phenomena that manifested themselves during the March market turmoil. The steep increase in both initial margin and variation margin helped to ensure that the extraordinary market volatility did not result in widespread concerns about counterparty credit risk. But margin calls may have also exacerbated liquidity stress, particularly in institutions with inadequate liquidity management. In particular, procyclicality in initial margins may have created externalities, such as stress amplification in MMFs, which are not sufficiently reflected in the current framework. At the same time, any assessment of the present set-up should also take account of the preparedness of non-bank financial entities for liquidity stress, as this can also influence the ease with which unexpected, large increases in both initial and variation margin can be handled.
5.3 Completing the capital markets union and managing climate change
5.3.1 Capital markets union
Establishing a genuine single European capital market is a long-term ambition, and progress towards it can address many of the challenges that the EU is currently facing. These include funding the post-pandemic recovery, ensuring the transition to a low-carbon economy and addressing the medium-term consequences of Brexit for financial services.[71] For example, bond and equity markets could complement bank lending and help ensure that businesses have access to funding. Well-functioning capital markets will also play an important role in the European Commission’s new bond issuance programme in the context of Next Generation EU.
The Commission’s new Action Plan on Capital Markets Union (CMU) published on 24 September 2020[72] is an important step towards building more integrated and resilient European capital markets. Since progress in sustainable finance and digitalisation is closely linked to effective capital markets, advancing in these areas will also make capital markets more integrated, efficient and sustainable. However, since the CMU will foster further growth in the non-bank financial sector, it will be important to ensure that the regulatory framework for the sector is fit for purpose and that further steps are taken on supervisory convergence, including the direct supervision of capital markets at the European level.
Many proposals in the Action Plan mirror the priorities previously identified by the ECB[73] and could lead to significant progress on the CMU if fully implemented. Examples include measures aimed at improving access to funding in these challenging times, such as the establishment of a European single access point that would provide investors with access to financial and sustainability-related company information and that could be implemented over a relatively short period of time. A second group of measures, such as initiatives on financial education, would help citizens reap the benefits of the CMU. Other proposals are more challenging, such as the harmonisation of corporate insolvency or post-trade taxation procedures.
5.3.2 Climate change
Climate change requires policy action both to foster the transition to a more sustainable economy and to guard against climate-related risks to the financial system. Enhanced climate-related disclosure requirements and a developed green bond market are essential steps in a smooth transition towards a sustainable and more integrated economy. At the same time, further policy action may be required to ensure the resilience of the financial system against climate-related risks.
The planned ECB climate stress test will inform future policy discussions.[74] The stress test will make it possible to assess the impact of potential regulatory and policy measures aimed at mitigating climate risks to the financial sector in a forward-looking way and for different climate scenarios. The stress test will allow the sectors that are most vulnerable to climate change risks to be identified. This feature, combined with adequate climate scenarios, will make it possible to assess the implications of policy reforms. Finally, the stress test will help to reveal data gaps that need to be filled to enable climate risks to be evaluated more effectively.[75]
The European Commission’s plan to issue €225 billion of green bonds as part of the Next Generation EU programme is an important step towards financing the climate transition. This issuance will further expand a green bond market that has already grown rapidly in recent years, doubling in size in 2019. It will be important to make progress on the CMU, as the new bond issuance by the European Commission will rely on well-functioning capital markets as it provides financing for the transition.[76]
Chart 5.3
Green finance could also support financial integration
Home bias in green bonds versus the aggregate bond market
(Q4 2014-Q4 2019)
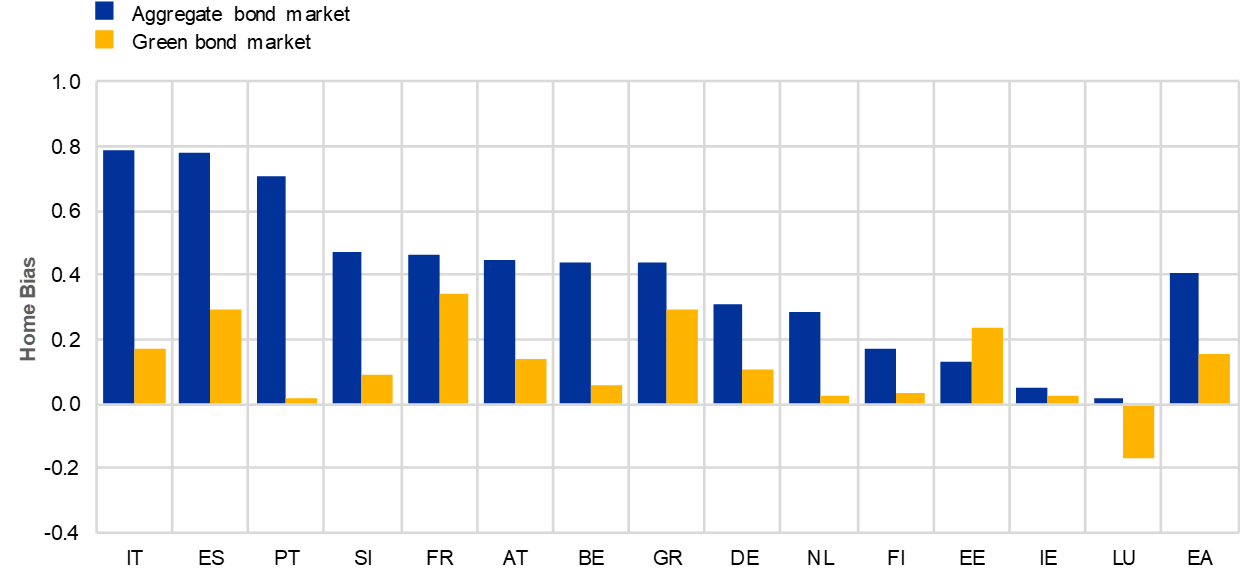
Sources: ECB and ECB calculations. The indicator of whether a bond is considered green is compiled from Bloomberg Finance L.P.
Notes: The blue columns depict aggregate home bias taking into account all bonds, whereas the yellow columns depict home bias calculated solely on the basis of the sample of green bonds. The measure for home bias for each country is one minus the ratio of the share of foreign bonds held in a given country to the share of that country’s bond market in the aggregate portfolio. This measure is standard in the literature and closely follows Tesar and Werner.[77] Negative values indicate negative home bias, indicating that the share of foreign holdings in a given country’s portfolio is larger than the share of foreign assets in the aggregate portfolio. Cyprus, Latvia, Lithuania, Malta and Slovakia are not included in this chart as they are either not recorded as having issued any green bonds or have issued so few green bonds that any comparison would be misleading.
The relatively low home bias in green bond markets suggests that financing the climate transition could help to drive further financial integration. The aggregate green bond market, worth €140 billion at the end of 2019, shows a level of home bias that is less than half that of the aggregate bond market (see Chart 5.3).[78],[79] Given the lower levels of home bias for green bonds, beyond financing the climate transition the sustainable finance agenda could also have a positive impact on financial integration.
Enhancing disclosure and information is an essential first step in managing the financial stability risks posed by climate change. Information on carbon emissions and other relevant metrics of environmental performance have improved in recent years, but remain inconsistent, largely incomparable and often unavailable. This is also the case for disclosures of climate-related risks to which companies and financial institutions are exposed and the improvements they are making, which are sometimes used to market green bonds. The absence of a “greenium” may reflect the fact that investors do not fully price in climate-related risks or, in the absence of standards for green bonds, they fear “greenwashing” practices (see Box 7). Improving disclosure of climate-related risks requires a revision of corporate disclosure, notably a review of the Non-Financial Reporting Directive (NFRD). For example, non-financial disclosure could be made mandatory and coverage of the NFRD could be expanded to non-listed companies.[80] Overall, improved climate-related disclosure requirements could contribute to a smooth transition towards a resilient and sustainable economy (see Figure 5.1). This transition can be made easier by efficient capital markets providing the necessary funding: as such, a more integrated CMU and the EU Renewed Sustainable Finance Strategy are mutually reinforcing.
Figure 5.1
The EU Renewed Sustainable Finance Strategy: channels through which climate-related disclosure requirements contribute to a smooth transition towards a resilient and sustainable economy, supported by the capital markets union

Source: ECB.
Box 9
A macroprudential perspective on replenishing capital buffers
ECB Banking Supervision recently announced that banks will not be required to start replenishing capital buffers before the peak in capital depletion is reached.[82] ECB Banking Supervision has committed to allowing banks to operate below the Pillar 2 guidance (P2G) and the combined buffer requirement (CBR) until at least the end of 2022, without automatically triggering supervisory actions. The exact timeline will be decided following the 2021 EU-wide stress test and, as in every supervisory cycle, on a case-by-case basis according to the individual situation of each bank. In particular, ECB Banking Supervision will look at the profitability of banks and how much capital will be required to replenish the buffer. Taken together, this forward looking supervisory guidance should give banks confidence that they can currently draw on capital buffers to absorb losses and support lending.[83]
MoreSpecial features
Financial stability considerations arising from the interaction of coronavirus-related policy measures
Fiscal, prudential and monetary authorities have responded to the coronavirus pandemic by providing unprecedented support to the real economy. Importantly, the combination of policy actions has done more to limit the materialisation of risks to households and firms than each policy individually. Exploiting policy complementarities and ensuring the most effective combination of policies will, however, be equally important when authorities start to phase out the various relief measures. The differences in the enacted fiscal and labour market measures across the largest euro area economies, as well as their phase-out schedules, further complicate the challenge of obtaining the most effective policy combination.
MoreProspects for euro area bank lending margins in an extended low-for-longer interest rate environment
In the wake of the pandemic, the economic outlook has deteriorated, the recovery is uncertain and interest rates are expected to remain at historical lows for even longer. The persistently low interest rate environment can both support and dampen the profitability and resilience of euro area banks. This special feature examines some aspects of how the low-for-even-longer interest rate environment may affect bank lending margins, and in turn banks’ ability to lend to the real economy and overall financial stability. It analyses euro area banks from 2000 onwards and finds evidence that margins fall more in response to declines in nominal short-term rates when these are low to begin with. The compression of margins reflects the sluggish response to further policy rate cuts of deposit rates as they approach the zero lower bound. Moreover, the analysis indicates that bank margins and overall profitability are influenced by both the level of real rates and, more materially, the level of inflation expectations embedded in nominal rates, which reflects the fact that bank profits are partly akin to seigniorage. Should a large share of deposit rates continue exhibiting persistent downward rigidity in the absence of a rebound in inflation expectations, the outlook for net interest margins will remain weak, adding to the bank balance sheet stress induced by the pandemic, notwithstanding the mitigating effect of low interest rates on bank provisions.
More© European Central Bank, 2020
Postal address 60640 Frankfurt am Main, Germany
Telephone +49 69 1344 0
Website www.ecb.europa.eu
All rights reserved. Reproduction for educational and non-commercial purposes is permitted provided that the source is acknowledged.
For specific terminology please refer to the ECB glossary (available in English only).
PDF ISSN 1830-2025, QB-XU-20-002-EN-N
HTML ISSN 1830-2025, QB-XU-20-002-EN-Q
- For further details, see the press release entitled “Financial stability: Commission adopts time-limited decision giving market participants the time needed to reduce exposure to UK central counterparties (CCPs)”, European Commission, 21 September 2020.
- For further details, see the press release entitled “ESMA to recognise three UK CCPS from 1 January 2021”, European Securities and Markets Authority (ESMA), 28 September 2020.
- For a more detailed discussion on issues related to uncleared derivatives, see Box 1 entitled “Assessing the risks to the euro area financial sector from a no-deal Brexit – update following the extension of the UK’s membership of the EU”, Financial Stability Review, ECB, May 2019.
- For a more detailed discussion, see the Supervision Newsletter entitled “Brexit: banks should prepare for year-end and beyond”, ECB Banking Supervision, 18 November 2020.
- See also the 18 September speech by Isabel Schnabel, Member of the Executive Board of the ECB, entitled “Unequal scars – distributional consequences of the pandemic”.
- See Box 1 entitled “Explaining cross-border transactions in euro area commercial real estate markets”, Financial Stability Review, ECB, November 2019.
- This calculation assumes that the full amount of the recovery fund (€750 billion) will be used and also includes the €100 billion under the Support to mitigate Unemployment Risks in an Emergency (SURE) programme.
- See Alcidi, C. and Gros, D., “Public debt and the risk premium: A dangerous doom loop”, Centre for European Policy Studies, May 2019.
- See Box 2 entitled “Valuations in corporate bond and equity markets”, Financial Stability Review, ECB, November 2019.
- For more information, see Box 5 entitled “Leveraged loans: a fast-growing high-yield market”, Financial Stability Review, ECB, May 2018, and Box 4 entitled “CLOs: a financial stability perspective”, Financial Stability Review, ECB, May 2019.
- See Kalemli-Özcan, S., Laeven, L. and Moreno, D., “Debt overhang, rollover risk, and corporate investment: evidence from the European crisis”, Working Paper Series, No 2241, ECB, February 2019.
- See, for example, “A system-wide scenario analysis of large-scale corporate bond downgrades”, ESRB technical note, July 2020.
- With bank profitability declining strongly in 2020, the return on equity figure for the second quarter of 2020 depends on the way net income is annualised. In the FSR, the four quarter average of total equity is used in the denominator while net income is annualised using four quarter trailing sums. ECB Banking Supervision annualises quarterly/semi-annual data by multiplying it by four and two respectively, resulting in a different headline profitability number.
- The European Commission extended the temporary framework to support companies facing significant turnover losses on 13 October 2020. Hence, it is now possible for governments to prolong access to loan guarantee schemes until 30 June 2021 instead of 31 December 2020. See “State aid: Commission prolongs and expands Temporary Framework to further support companies facing significant turnover losses”, European Commission, October 2020.
- The analysis presented in this box focuses on banks’ exposures to sovereign debt securities. Banks’ sovereign exposures also include loans to governments, developments in which are more stable over time. Also, banks’ loans to governments are not subject to the issue of market price valuation, which affects debt securities and could then have implications for capital losses.
- This chapter includes references to countries more or less affected by the global financial crisis and/orthe euro area sovereign debt crisis. Countries more affected by those crises comprise Cyprus, Greece,Ireland, Italy, Portugal, Slovenia and Spain.
- Stage 2 includes assets that have had a significant increase in credit risk since initial recognition, while Stage 3 includes assets that have objective evidence of impairment at the reporting date. For both Stage 2 and Stage 3 assets, lifetime expected credit losses (ECLs) are recognised.
- The contributions of foreign currency translation effects and fair value changes of debt instruments measured at fair value through other comprehensive income were 24 and 12 basis points respectively.
- Some further benefits from the CRR “quick fix” are expected to be realised in the second half of the year (e.g. the exemption of certain software assets from capital deductions and prudential filters on debt instruments at FVOCI).
- Transition risks are expected to arise from changes in policy, technology or behaviour; see Network for Greening the Financial System, A call for action – Climate change as a source of financial risk, Banque de France, April 2019.
- Le Quéré, C. et al., “Temporary reduction in daily global CO2 emissions during the COVID-19 forced confinement”, nature climate change, Volume 10, 2020, pp. 647-653; International Energy Agency, Global Energy Review 2020 – The impacts of the Covid-19 crisis on global energy demand and CO2 emissions, 2020.
- The sample is unbalanced, with coverage of firms reporting emissions increasing in recent years, and considerable variability between firms’ emission intensity within each sector (see Chart 8 in European Systemic Risk Board, Positively green: Measuring climate change risks to financial stability, June 2020).
- Battiston, S., et al., “A climate stress-test of the financial system”, nature climate change, Volume 7, 2017, pp. 283-288.
- For an assessment of projected economic losses from physical risk drivers, see, for example, Feyen, L., et al., “Climate change impacts and adaptation in Europe”, JRC PESETA IV final report, 2020.
- Giuzio, M. et al., “Climate change and financial stability”, Financial Stability Review, ECB, May 2019.
- Tschumi, E. and Zscheischler, J., “Countrywide climate features during recorded climate-related disasters”, Climatic Change, Issue 158, February 2020, pp. 593-609; Schiermeier, Q., “Droughts, heatwaves and floods: How to tell when climate change is to blame”, nature, Volume 560, August 2018.
- ECB calculations based on the Guha-Sapir, D., EM-DAT: The International Disaster Database, UCL, Brussels, Belgium. The database includes climate- and weather-related catastrophes with one of the following criteria: 10 or more fatalities, 100 or more people affected, declaration of a state of emergency and/or appeal for international assistance. Most exposed countries are those exposed to heat and humidity risk, as classified by McKinsey (see footnote below for source).
- While global warming and related impacts of climate change are locked in for the next few years to come, their pathway until the end of the century depends on the policy action taken now; see also speech by Schnabel I., “When markets fail – the need for collective action in tackling climate change”, 28 September 2020.
- Country groupings by risks are taken from McKinsey Global Institute, “Climate risk and response: Physical hazards and socioeconomic impacts”, January 2020. The group of countries with increased water stress includes 22 countries and the group of several risk drivers includes five countries.
- This model is described in Budnik, K., Balatti, M., Dimitrov, I., Groß, J., Kleemann, M., Reichenbachas, T., Sanna, F., Sarychev, A., Siņenko, N. and Volk, M., “Banking euro area stress test model”, Working Paper Series, No 2469, ECB, September 2020.
- The dynamic balance sheet approach increases the realism of the assessment in comparison to stress tests that assume that the size and structure of banks’ assets do not change over the scenario horizon.
- The scenario analysis presented here also differs from the 2020 vulnerability analysis by incorporating information about banks’ situation until the second quarter of 2020 (as against the fourth quarter of 2019).
- Both baseline and adverse scenarios assume conservatively that banks will remain reluctant to use their capital buffers in support of lending. Under both scenarios, banks’ readiness to dip into their capital buffers would be reflected in higher lending dynamics with benefits for the economy and without any noticeable negative effect on their capital position. See Enria, A., “The coronavirus crisis and ECB Banking Supervision: taking stock and looking ahead”, The Supervision Blog, ECB, 28 July 2020, in Borsuk, M., Budnik, K. and Volk, M., “Buffer use and lending impact”, Macroprudential Bulletin, Issue 11, ECB, October 2020.
- Composed of Pillar 1 requirements, Pillar 2 requirements and combined buffer requirements.
- Budnik, K., Balatti, M., Dimitrov, I., Groß, J., Kleemann, M., Reichenbachas, T., Sanna, F., Sarychev, A., Siņenko, N. and Volk, M., “Banking euro area stress test model”, Working Paper Series, No 2469, ECB, September 2020.
- For a more detailed description of the scenario design, see Dees et al. (op. cit.) and Henry, J. and Kok, C. (eds.), “A macro stress testing framework for assessing systemic risks in the banking sector”, Occasional Paper Series, No 152, ECB, October 2013. Regarding the tool used to calibrate financial shocks, see the technical note on the ESRB’s website.
- Due to data limitations, it is not clear to what extent OFIs are consolidated in either financial or non-financial corporations. This would serve to increase or decrease the measure of market-based and non-bank credit and hence the broad range of estimates, especially for non-bank credit (see Chart 4.1).
- OFI lending comprises many different activities, including intra-company financing through captive financial institutions, often as part of a larger corporate structure. In Luxembourg, for example, holding corporations and intragroup lending companies held more than three-quarters of the total assets of captive financial institutions over the period 2014-19.
- See Box 7 entitled “Recent stress in money market funds has exposed potential risks for the wider financial system”, Financial Stability Review, ECB, May 2020.
- In this context, the term “fallen angels” typically refers to debt which has been downgraded to non-investment grade, i.e. with a rating below BBB.
- See Box 9 entitled “Insurers’ investment in alternative assets”, Financial Stability Review, ECB, May 2019.
- See Box 6 entitled “The role of bank and non-bank interconnections in amplifying recent financial contagion”, Financial Stability Review, ECB, May 2020.
- See Box 5 entitled “The role of bank and non-bank interconnections in amplifying recent financial contagion”, Financial Stability Review, ECB, May 2020.
- See Financial Stability Review, ECB, May 2020.
- See Special Feature B entitled “Derivatives-related liquidity risk facing investment funds”, Financial Stability Review, ECB, May 2020.
- Non-ESG bond funds include sovereign, high-yield and investment-grade corporate bond funds, and other mixed bond funds. The difference in the sample explains why flows into non-ESG bond funds are lower than flows into sovereign, high-yield and investment-grade corporate bond funds separately in Chart 4.3 (left panel).
- Sante Carbone, Angelica Ghiselli and Filip Nikolic provided data support.
- See Special Feature A entitled “Climate change and financial stability”, Financial Stability Review, ECB, May 2019. For a discussion on the vulnerability of financial markets to tail events stemming from the mispricing of climate risks, see Schnabel, I., “When markets fail – the need for collective action in tackling climate change”, speech at the European Sustainable Finance Summit, 28 September 2020.
- Empirical evidence also suggests that the recommendation by EIOPA to suspend dividend payouts and share buybacks did not have persistent effects on insurers’ equity valuations. See Jakubik, P., “The impact of EIOPA statement on insurers’ dividends: evidence from equity market”, Financial Stability Report, European Insurance and Occupational Pensions Authority (EIOPA), July 2020, pp. 104-116.
- See Chapter 4, Financial Stability Review, ECB, May 2020.
- Estimates are taken from Swiss Re Institute.
- For a discussion of these risks, see Special Feature A entitled “Climate change and financial stability”, Financial Stability Review, ECB, May 2019.
- Insurance protection gaps can have severe macroeconomic consequences as shown, for example, by von Peter, G., von Dahlen, S. and Saxena, S., “Unmitigated disasters? New evidence on the macroeconomic cost of natural catastrophes”, BIS Working Papers No 394, Bank for International Settlements, December 2012.
- See Box 9 entitled “Insurers’ investment in alternative assets”, Financial Stability Review, ECB, May 2019.
- See Box 7 entitled “Recent stress in money market funds has exposed potential risks for the wider financial system”, Financial Stability Review, ECB, May 2020.
- Variation margin is collateral exchanged by two counterparties to a derivative transaction, which reflects the price movement of such a transaction or a portfolio of such transactions.
- The temporary release of Pillar 2 guidance (P2G) and the adjustments to Pillar 2 requirements (P2R) allowed by ECB Banking Supervision made around €120 billion of bank capital available to absorb losses and support lending. In addition, macroprudential authorities across the euro area released or reduced more than €20 billion of capital buffer requirements, including the release of countercyclical capital buffers. It was also recommended that banks limit payouts to shareholders to retain capital. See Chapter 5 of the May 2020 ECB Financial Stability Review for more information on policy actions.
- The European Systemic Risk Board (ESRB) issued a recommendation on restricting distributions during the COVID-19 pandemic on 27 May 2020. National authorities complied with this, and on 27 July ECB Banking Supervision also extended its recommendation on dividend distributions until 1 January 2021 accordingly.
- See “ECB allows temporary relief in banks’ leverage ratio after declaring exceptional circumstances due to pandemic”, press release, ECB, 17 September 2020.
- Article 128(6) of Directive 2013/36/EU of the European Parliament and of the Council of 26 June 2013 on access to the activity of credit institutions and the prudential supervision of credit institutions and investment firms (CRD IV) defines the CBR as the total amount of Common Equity Tier 1 capital that institutions must hold to meet the requirement for the capital conservation buffer extended by, as applicable, the institution-specific countercyclical capital buffer, the global systemically important institution buffer, the other systemically important institution buffer and the systemic risk buffer.
- The exact timeline will be decided following the 2021 EU-wide stress test and, as in every supervisory cycle, on a case-by-case basis according to the individual situation of each bank.
- For a discussion of the range of solutions, see Special Feature B entitled “Addressing market failures in the resolution of non-performing loans in the euro area”, Financial Stability Review, ECB, November 2016.
- The ECB outlined its supervisory expectations with respect to operational preparedness for rising NPLs in a letter to banks. See “Operational capacity to deal with distressed debtors in the context of the coronavirus (COVID-19) pandemic”, ECB Banking Supervision, 28 July 2020.
- Values based on the requirements and CET1 ratios of a sample of around 500 significant and less significant institutions reported at the highest level of consolidation.
- Countercyclical macroprudential policy that supports bank lending and loss absorption in times of crisis also benefits and complements other policy domains. For monetary policy, it facilitates policy transmission through a stable banking sector and reduces the need for unconventional measures. With regard to fiscal policies, building up more releasable capital in good times helps to absorb losses without bank deleveraging in bad times and reduces the likelihood of bailouts in times of crisis.
- See “Holistic Review of the March Market Turmoil”, FSB, 17 November 2020.
- See “ECB contribution to the European Commission’s consultation on Capital Markets Union mid-term review 2017”, ECB, May 2017.
- See Box 7 entitled “Recent stress in money market funds has exposed potential risks for the wider financial system”, Financial Stability Review, ECB, May 2020.
- See “Consultation Paper on the Opinion on the 2020 review of Solvency II”, European Insurance and Occupational Pensions Authority (EIOPA), 15 October 2019.
- See “Enhancing the macroprudential dimension of Solvency II”, ESRB, February 2020.
- See Bergbauer, S. et al., “Implications of Brexit for the EU financial landscape”, Financial Integration and Structure in the Euro Area, ECB, March 2020.
- See the European Commission’s website.
- See de Guindos, L., Panetta, F. and Schnabel, I., “Europe needs a fully fledged capital markets union – now more than ever”, The ECB Blog, 2 September 2020.
- On the general usefulness of stress tests to assess climate-change-related risks, see for example “Guide to climate scenario analysis for central banks and supervisors”, Network for Greening the Financial System, June 2020.
- For example, climate-risk-related data on banks’ retail exposures do not include the information required to quantify counterparty vulnerability to climate risks. More granular reporting requirements to be developed by the European Banking Authority or supervisors would be beneficial in this specific regard.
- See de Guindos, L., Panetta, F. and Schnabel, I., “Europe needs a fully fledged capital markets union – now more than ever”, The ECB Blog, 2 September 2020.
- Tesar, L. L. and Werner, I. M., “Home bias and high turnover”, Journal of International Money and Finance, Vol. 14(4), August 1995, pp. 467-492.
- An analysis of a sample of 730 green bonds issued since 2013 worth €140 billion at the end of 2019 shows that green bonds have significantly lower levels of home bias than the aggregate bond market. Mean home bias in the green bond market (0.16) is less than half of the average home bias in the aggregate bond market (0.4).
- This bar chart is an early product of ongoing research into home bias and key characteristics of the green bond market by David Cesar Heymann, Anouk Levels, Claudia Lambert and Michael Wedow. David Cesar Heymann, Claudia Lambert and Michael Wedow are affiliated with the ECB, while Anouk Levels is affiliated with De Nederlandsche Bank.
- See the Eurosystem reply to the European Commission’s public consultations on the Renewed Sustainable Finance Strategy and the revision of the Non-Financial Reporting Directive.
- With useful input and comments from Markus Behn, Diego Moccero and Giulia Usai.
- See Enria, A., “The coronavirus crisis and ECB Banking Supervision: taking stock and looking ahead”, The Supervision Blog, ECB Banking Supervision, 28 July 2020, and the press release entitled “ECB extends recommendation not to pay dividends until January 2021 and clarifies timeline to restore buffers”, ECB Banking Supervision, 28 July 2020.
- See Chapter 5 of the May 2020 Financial Stability Review for an overview of the mitigating actions taken by prudential authorities in the euro area.
- With input from Álvaro Álvarez-Blázquez Ponce, Martin Bijsterbosch, Marija Deipenbrock and Johannes Werner.
-
25 November 2020