
Economic Bulletin Issue 2, 2022
Economic, financial and monetary developments
Overview
The Russian invasion of Ukraine will have a material impact on economic activity and inflation through higher energy and commodity prices, the disruption of international commerce and weaker confidence. The extent of these effects will depend on how the conflict evolves, on the impact of current sanctions and on possible further measures.
The impact of the war has to be assessed in the context of solid underlying conditions for the euro area economy, helped by ample policy support. The recovery of the economy is being boosted by the fading impact of the Omicron variant of the coronavirus (COVID-19). Supply bottlenecks have been showing some signs of easing and the labour market has been improving further. In the baseline of the March 2022 ECB staff macroeconomic projections, which incorporate a first assessment of the implications of the war in Ukraine, GDP growth has been revised downwards for the near term owing to the conflict.
Inflation has continued to surprise on the upside because of unexpectedly high energy costs. Price rises have also become more broadly based. The baseline for inflation in the new staff projections has been revised upwards significantly. Longer‑term inflation expectations across a range of measures have re-anchored at the ECB’s inflation target. The Governing Council sees it as increasingly likely that inflation will stabilise at its 2% target over the medium term.
In alternative scenarios for the economic and financial impact of the war, economic activity could be dampened significantly by a steeper rise in energy and commodity prices and a more severe drag on trade and sentiment. Inflation could be considerably higher in the near term. However, in all scenarios, inflation is still expected to decrease progressively and settle at levels around the 2% inflation target in 2024.
Based on its updated assessment of the inflation outlook and taking into account the uncertain environment, the Governing Council has revised the purchase schedule for its asset purchase programme (APP) for the coming months. Monthly net purchases under the APP will amount to €40 billion in April, €30 billion in May and €20 billion in June. The calibration of net purchases for the third quarter will be data-dependent and will reflect the Governing Council’s evolving assessment of the outlook. If the incoming data support the expectation that the medium-term inflation outlook will not weaken, even after the end of its net asset purchases, the Governing Council will conclude net purchases under the APP in the third quarter. If the medium-term inflation outlook changes and financing conditions become inconsistent with further progress towards the 2% target, the Governing Council stands ready to revise its schedule for net asset purchases in terms of size and/or duration. Any adjustments to the key ECB interest rates will take place some time after the end of net purchases under the APP and will be gradual. The path for the key ECB interest rates will continue to be determined by the Governing Council’s forward guidance and by its strategic commitment to stabilising inflation at 2% over the medium term. Accordingly, the Governing Council expects the key ECB interest rates to remain at their present levels until it sees inflation reaching 2% well ahead of the end of its projection horizon and durably for the rest of the projection horizon, and judges that realised progress in underlying inflation is sufficiently advanced to be consistent with inflation stabilising at 2% over the medium term. The Governing Council also confirmed its other policy measures.
Economic activity
The global economy expanded at a robust pace during 2021, despite headwinds related to the resurgence of the coronavirus pandemic and supply bottlenecks. Survey indicators point to continued growth in activity in the first quarter of 2022. However, the Russia-Ukraine war casts significant uncertainty on an otherwise robust global outlook. Recent surveys of economic activity suggest that growth momentum picked up from January to February as pandemic and supply-side pressures eased. However, on account of the economic fallout from the war and the gradual unwinding of policy stimulus, projections of global growth have been revised downwards, in particular for 2022 and 2023, when compared with the December projections. Global real GDP (excluding the euro area) is estimated to have expanded by 6.3% in 2021, with the pace of growth projected to moderate to 4.1% in 2022 and 3.6% in both 2023 and 2024. Euro area foreign demand growth is projected to moderate from 9.9% in 2021 to 4% in 2022, 3.2% in 2023 and 3.6% in 2024. Compared with global imports, euro area foreign demand is more heavily affected by the conflict, given the relatively large share of euro area trade which stems from Russia and countries in central and eastern Europe that are particularly exposed to the headwinds from the conflict. Compared with the previous projections, the growth rate of euro area foreign demand has been left unchanged for 2022 (as the impact of the invasion fully offsets the positive carry-over effect from 2021) and has been revised downwards for 2023 and 2024. Supply bottlenecks are expected to start easing during 2022 and to fully unwind by 2023. The export prices of the euro area’s competitors have been revised upwards for 2022 and 2023 as higher commodity prices, supply bottlenecks and recovering demand overlap. While the future course of the pandemic remains an important risk factor affecting the baseline projections for the global economy, the Russia-Ukraine war significantly amplifies uncertainty. Downside tail risks from a further escalation could be significant and could derail the global recovery, while fuelling inflationary pressures.
The Russia-Ukraine war will have a material impact on economic activity in the euro area through higher energy and commodity prices, the disruption of international commerce and weaker confidence. However, underlying conditions are solid, helped by ample policy support. The economy grew by 5.3% in 2021, with GDP returning to its pre-pandemic level at the end of the year. However, growth slowed to 0.3% in the last quarter of 2021 and is expected to remain weak during the first quarter of 2022. The prospects for the economy will depend on the course of the Russia-Ukraine war and on the impact of economic and financial sanctions and other measures. At the same time, other headwinds to growth are now waning. In the baseline of the staff projections, the euro area economy should still grow robustly in 2022, but the pace will be slower than was expected before the outbreak of the war. Measures to contain the spread of the Omicron variant have had a milder impact than those employed during previous waves and are now being lifted. The supply disruptions caused by the pandemic also show some signs of easing and the labour market has continued to strengthen. The impact of the massive energy price shock on people and businesses may be partly cushioned by drawing on savings accumulated during the pandemic and by compensatory fiscal measures.
According to the March 2022 ECB staff macroeconomic projections, the euro area general government budget balance remains on a path to improvement following the very high deficits recorded as a result of the coronavirus crisis. Risks to this baseline are, however, substantial and increasingly tilted towards larger budget deficits, mainly related to the war in Ukraine. According to the baseline, the deficit ratio is estimated to have fallen to 5.5% of GDP in 2021 from a peak of 7.2% in 2020. It is projected to fall further to 3.1% in 2022 and to 2% by the end of the forecast horizon. In terms of the euro area fiscal stance, a strong expansion in 2020 was followed by a moderate tightening in 2021 once adjusted for Next Generation EU (NGEU) grants. In 2022 the stance is projected to tighten further, mainly owing to a reversal of a significant part of the coronavirus crisis emergency support. The tightening is projected to be only marginal over the last two years of the forecast horizon, and significant support to the economy remains in place. In the light of high risks currently emanating from multiple sources, which are in part already materialising, fiscal measures, including at EU level, would help to shield the economy. Fiscal policies need to remain agile as the situation evolves. A willingness to employ fiscal measures is not inconsistent with the need for a credible medium‑term normalisation of public finances.
Over the medium term, according to the baseline of the staff projections, growth will be driven by robust domestic demand, supported by a stronger labour market. With more people in jobs, households should earn higher incomes and spend more. The global recovery and the ongoing fiscal and monetary policy support are also contributing to this growth outlook. Fiscal and monetary policy support remains critical, especially in this difficult geopolitical situation. Euro area growth is still expected to be robust in 2022, but the pace will be slower than was expected before the outbreak of the war. The March staff macroeconomic projections foresee annual real GDP growth at 5.4% in 2021, 3.7% in 2022, 2.8% in 2023 and 1.6% in 2024. Compared with the December projections, the outlook has been revised down for 2022 and 2023. This builds on the assumption that current disruptions to energy supplies and negative impacts on confidence linked to the conflict are temporary and that global supply chains are not significantly affected. In an adverse scenario in which stricter sanctions are imposed on Russia, leading to some disruption in global value chains, higher energy costs and some temporary cuts in euro area production, as well as additional financial disruption and more persistent uncertainty, euro area growth would be 1.2 percentage points lower than the baseline in 2022. The difference in 2023 would be limited, and in 2024 growth would be somewhat stronger owing to catch-up effects. In the event of a severe scenario (which, in addition to the features of the adverse scenario, assumes a stronger reaction of energy prices to more stringent cuts in supply and stronger repricing in financial markets), GDP growth could end up 1.4 percentage points below the baseline in 2022 and 0.5 percentage points below it in 2023, with relatively modest catch-up effects in 2024.
Inflation
Inflation increased to 5.8% in February from 5.1% in January and is expected to rise further in the near term. Energy inflation, which reached 31.7% in February, continues to be the main reason for the high overall rate of inflation and is pushing up prices across many other sectors. Food prices have also increased, owing to seasonal factors, elevated transportation costs and higher fertiliser prices. Energy costs have risen further in recent weeks and there will be more pressure on some food and commodity prices owing to the war in Ukraine. Price rises have become more widespread. Most measures of underlying inflation have risen over recent months to levels above 2%. However, it is uncertain how persistent the rise in these indicators will be, given the role of temporary pandemic-related factors and the indirect effects of higher energy prices. Market-based indicators suggest that energy prices will stay high for longer than previously expected but will moderate over the course of the projection horizon. Price pressures stemming from global supply bottlenecks should also subside. Labour market conditions have continued to improve, with unemployment falling to 6.8% in January. Even though labour shortages are affecting more and more sectors, wage growth remains muted overall. Over time, the economy’s return to full capacity should support somewhat faster growth in wages. Various measures of longer-term inflation expectations derived from financial markets and from surveys stand at around 2%. These factors will also contribute further to underlying inflation and will help headline inflation to settle durably at the 2% target.
The March 2022 staff macroeconomic projections foresee annual inflation at 5.1% in 2022, 2.1% in 2023 and 1.9% in 2024 – substantially higher than in the previous projections in December, especially for 2022. Inflation excluding food and energy is projected to average 2.6% in 2022, 1.8% in 2023 and 1.9% in 2024, which is also higher than in the December projections. Should the adverse scenario described above materialise, inflation could be 0.8 percentage points higher in 2022. As oil and gas markets rebalance, the large spikes in energy prices would gradually unwind, causing inflation to decline to below the baseline, especially in 2024. In the more severe scenario, inflation would be 2 percentage points higher in 2022, with significantly higher inflation also seen in 2023. In 2024 stronger second-round effects would offset the negative impact on inflation from declining energy prices, leaving inflation unchanged from the baseline.
Risk assessment
The Governing Council sees the risks to the economic outlook as substantially increased and tilted to the downside. While risks relating to the pandemic have declined, the war in Ukraine may have a stronger effect on economic sentiment and could worsen supply-side constraints again. Persistently high energy costs, together with a loss of confidence, could drag down demand more than expected and constrain consumption and investment. The same factors are risks to the outlook for inflation, which are on the upside in the near term. The war in Ukraine is a substantial upside risk, especially to energy prices. If price pressures feed through into higher than anticipated wage rises or there are persistent adverse supply-side implications, inflation could also turn out to be higher over the medium term. However, if demand were to weaken over the medium term, this could also lower pressures on prices.
Financial and monetary conditions
The Russian invasion of Ukraine has caused substantial volatility in financial markets. Following the outbreak of war, risk-free market interest rates have partially reversed the increase observed since the Governing Council’s February meeting and equity prices have fallen. The financial sanctions against Russia, including the exclusion of some Russian banks from SWIFT, have so far not caused severe strains in money markets or liquidity shortages in the euro area banking system. Bank balance sheets remain healthy overall, owing to robust capital positions and fewer non-performing loans. Banks are now as profitable as they were before the pandemic. Bank lending rates for firms have increased somewhat, while lending rates for household mortgages remain steady at historically low levels. Lending flows to firms have declined, after increasing strongly in the last quarter of 2021. Lending to households is holding up, especially for house purchases.
Monetary policy decisions
Based on its updated assessment and taking into account the uncertain environment, the Governing Council has revised the purchase schedule for its asset purchase programme (APP) for the coming months. Monthly net purchases under the APP will amount to €40 billion in April, €30 billion in May and €20 billion in June. The calibration of net purchases for the third quarter will be data-dependent and will reflect the Governing Council’s evolving assessment of the outlook. If the incoming data support the expectation that the medium-term inflation outlook will not weaken, even after the end of its net asset purchases, the Governing Council will conclude net purchases under the APP in the third quarter. If the medium-term inflation outlook changes and financing conditions become inconsistent with further progress towards the 2% target, the Governing Council stands ready to revise its schedule for net asset purchases in terms of size and/or duration.
The Governing Council also intends to continue reinvesting, in full, the principal payments from maturing securities purchased under the APP for an extended period of time past the date when it starts raising the key ECB interest rates and, in any case, for as long as necessary to maintain favourable liquidity conditions and an ample degree of monetary accommodation.
The interest rates on the main refinancing operations, the marginal lending facility and the deposit facility will remain unchanged at 0.00%, 0.25% and -0.50% respectively.
Any adjustments to the key ECB interest rates will take place some time after the end of net purchases under the APP and will be gradual. The path for the key ECB interest rates will continue to be determined by the Governing Council’s forward guidance and by its strategic commitment to stabilise inflation at 2% over the medium term. Accordingly, the Governing Council expects the key ECB interest rates to remain at their present levels until it sees inflation reaching 2% well ahead of the end of its projection horizon and durably for the rest of the projection horizon, and judges that realised progress in underlying inflation is sufficiently advanced to be consistent with inflation stabilising at 2% over the medium term.
The Governing Council is conducting net asset purchases under the pandemic emergency purchase programme (PEPP) at a lower pace in the first quarter of 2022 than in the previous quarter. It will discontinue net asset purchases under the PEPP at the end of March 2022.
The Governing Council intends to reinvest the principal payments from maturing securities purchased under the PEPP until at least the end of 2024. In any case, the future roll-off of the PEPP portfolio will be managed to avoid interference with the appropriate monetary policy stance.
The pandemic has shown that, under stressed conditions, flexibility in the design and conduct of asset purchases has helped to counter the impaired transmission of monetary policy and has made the Governing Council’s efforts to achieve its goal more effective. Within the Governing Council’s mandate, under stressed conditions, flexibility will remain an element of monetary policy whenever threats to monetary policy transmission jeopardise the attainment of price stability. In particular, in the event of renewed market fragmentation related to the pandemic, PEPP reinvestments can be adjusted flexibly across time, asset classes and jurisdictions at any time. This could include purchasing bonds issued by the Hellenic Republic over and above rollovers of redemptions in order to avoid an interruption of purchases in that jurisdiction, which could impair the transmission of monetary policy to the Greek economy while it is still recovering from the fallout from the pandemic. Net purchases under the PEPP could also be resumed, if necessary, to counter negative shocks related to the pandemic.
The Governing Council will continue to monitor bank funding conditions and ensure that the maturing of operations under the third series of targeted longer-term refinancing operations (TLTRO III) does not hamper the smooth transmission of its monetary policy. The Governing Council will also regularly assess how targeted lending operations are contributing to its monetary policy stance. As announced, it expects the special conditions applicable under TLTRO III to end in June this year. The Governing Council will also assess the appropriate calibration of its two-tier system for reserve remuneration so that the negative interest rate policy does not limit banks’ intermediation capacity in an environment of ample excess liquidity.
In view of the highly uncertain environment caused by the Russian invasion of Ukraine and the risk of regional spillovers that could adversely affect euro area financial markets, the Governing Council has decided to extend the Eurosystem repo facility for central banks (EUREP) until 15 January 2023. EUREP will therefore continue to complement the regular euro liquidity-providing arrangements for non‑euro area central banks. Together, these form a comprehensive set of backstop facilities to address possible euro liquidity needs in the event of market dysfunction outside the euro area that could adversely affect the smooth transmission of the ECB’s monetary policy. Requests from non-euro area central banks for individual euro liquidity lines will be assessed by the Governing Council on a case-by-case basis.
The Governing Council stands ready to adjust all of its instruments, as appropriate, to ensure that inflation stabilises at its 2% target over the medium term.
1 External environment
The March 2022 ECB staff macroeconomic projections for the euro area point to subdued global economic activity at the turn of the year as the Omicron variant of the coronavirus (COVID-19) started to spread quickly, supply bottlenecks persisted and commodity prices remained high. The Russia-Ukraine war casts significant uncertainty on the global outlook, especially in the near term. Global real GDP (excluding the euro area) is estimated to have expanded by 6.3% in 2021, with the pace of growth projected to moderate to 4.1% in 2022 and 3.6% in both 2023 and 2024. Compared with the previous projections, global growth has been revised upwards for 2021, when significant policy support fuelled global demand for goods, and downwards for 2022 and 2023 in particular, on account of the economic fallout from the Russia-Ukraine war and the gradual unwinding of policy stimulus. After a strong rebound in 2021 (12.1%), global import growth is set to moderate in 2022 on the back of lower activity and the negative impact on trade of the Russia-Ukraine war. In 2023 and 2024 global imports are projected to grow at a slower pace, reflecting the effect of the ongoing conflict, a broad-based deceleration across regions and the assumption that demand for consumer goods will gradually normalise. Euro area foreign demand growth is projected to moderate from 9.9% in 2021 to 4% in 2022, 3.2% in 2023 and 3.6% in 2024. Compared with global imports, euro area foreign demand is more heavily affected by the conflict, given the higher weight in euro area trade of Russia and countries in central and eastern Europe, which are more exposed to the headwinds from the conflict than other countries outside the euro area. Compared with the previous projections, the growth rate of euro area foreign demand has been left unchanged for 2022, as the impact of the invasion fully offsets the positive carry-over effect from 2021, and revised downwards for 2023 (-1.1 percentage points) and 2024 (-0.3 percentage points). Supply bottlenecks are expected to start easing during 2022 and to fully unwind by 2023. The export prices of the euro area’s competitors have been revised upwards for 2022 and 2023 as higher commodity prices, supply bottlenecks and recovering demand coalesce. While the future course of the pandemic remains an important risk factor affecting the baseline projections for the global economy, the Russia-Ukraine war significantly amplifies uncertainty. Looking ahead, downside tail risks from a further escalation of the conflict could be significant and could derail the global recovery, while fuelling inflationary pressures.
Global economic activity and trade
The global economy expanded at a robust pace during 2021, despite headwinds related to the resurgence of the pandemic and supply bottlenecks. In 2021 COVID-19 infections surged at different times across the globe and weighed on economic activity even where strong containment measures were not imposed. Nonetheless, real GDP continued to recover, driven by significant policy support and a strong rebound in global demand for manufactured goods as consumer demand rotated away from services in response to pandemic-related containment measures. With producers struggling to meet higher demand by increasing the supply of goods to an equal extent, and disruptions in the logistics industry hampering the timely supply of production inputs, severe strains in global production networks already started to weigh on the global business cycle towards the end of 2020, thus creating headwinds to the economic recovery during 2021.[1] Compared with the December 2021 Eurosystem staff macroeconomic projections, global real GDP growth (excluding the euro area) in 2021 has been revised up by 0.3 percentage points to 6.3%.
Survey indicators point to continued growth in activity in the first quarter of 2022 and to supply-side disruptions having peaked since the end of 2021. In February the global composite PMI index (excluding the euro area) rose to 53.1 from 51 in January, driven mainly by the services sector, which rebounded from a decline at the turn of the year induced by the spread of the Omicron variant. The global manufacturing output PMI also increased but to a lesser extent, signalling positive albeit moderate growth. Overall, the economic impact of the Omicron variant is expected to be moderate and limited to the first quarter of 2022. Nevertheless, the emergence of novel and more aggressive variants of the virus cannot be ruled out and COVID-19 remains a downside risk to the global economy despite the strong protection offered by vaccines. Compared with the December 2021 Eurosystem staff macroeconomic projections, global real GDP growth (excluding the euro area) for the first quarter of 2022 has been revised down by 0.7 percentage points, to 0.5% quarter on quarter, largely on account of the impact of the Omicron variant. The global suppliers’ delivery times PMI (excluding the euro area) has been improving slightly of late but remains tight and still points to long delivery times, while congestion in ocean shipping remains elevated. At the same time, given strong growth in merchandise trade and car production in recent months, it appears that supply constraints in some sectors might have passed their peak. Overall, the March 2022 ECB staff macroeconomic projections continue to assume that supply bottlenecks will gradually start to ease over the course of 2022 and to fully unwind by 2023. This will happen as consumer demand rotates back from goods to services and shipping capacity and semiconductor supply increase on the back of planned investment.
The Russia-Ukraine war casts significant uncertainty on an otherwise robust global outlook. The Russian invasion of Ukraine has sent jitters through the global economy and is assessed to weigh on the global outlook via three main channels. First, the substantial financial and (non-energy) trade sanctions being imposed on Russia will severely affect economic activity and trade in the country over the projection horizon. The exclusion of some Russian banks from SWIFT translates into more extensive disruptions, also affecting global trade, by severely impairing trade financing for Russian firms. Second, the conflict has put significant upward pressure on commodity prices, as Russia plays a major role in EU energy markets, while Ukraine is a top exporter of food commodities – mostly cereals – to the EU. Commodity prices had already been significantly affected by rising geopolitical tensions throughout 2021, and the invasion of Ukraine has pushed them up even further.[2] Finally, the Russia-Ukraine war is hurting global confidence, inducing negative effects on both the financial and the real economy sides. The ensuing worsening of financial conditions, together with sustained geopolitical tensions and uncertainty, is expected in turn to affect investment.
Chart 1
Global output PMI (excluding the euro area) by sector
(diffusion indices)

Sources: IHS Markit and ECB calculations.
Note: The latest observations are for February 2022.
The policy support for growth is diminishing over the projection horizon. Continued inflation surprises in the course of 2021 have prompted central banks to announce a faster unwinding of pandemic-related stimulus, with some emerging market economies (EMEs) already entering the tightening cycle in 2021. As a result, financial conditions have become tighter, thus weighing on economic growth in Brazil and other countries. Monetary policy is turning less accommodative across some large advanced economies as well. The Bank of England started to tighten in December 2021 and has raised interest rates three times since then. In the United States, the Federal Reserve System has started to unwind the monetary policy stimulus and raised the Federal Funds Rate in March 2022. The pace of monetary policy tightening is now expected to be faster than assumed some months ago, including a reduction in the monthly pace of net asset purchases at a coming meeting. The monetary policy stance remains accommodative in China, where the central bank has recently cut reserve requirement ratios for banks and lowered several key policy rates in response to the headwinds to growth. Also in Japan, monetary policy remains accommodative as inflation is below the central bank’s target.
Global financial conditions have tightened across advanced and emerging economies. Since the December 2021 Eurosystem staff macroeconomic projections, financial conditions in advanced economies have become less accommodative, although they remain loose in the United States when judged against the economy’s position in the business cycle. Developments were dominated initially by waning concerns about the downside risks posed by the Omicron variant and rising expectations of monetary policy tightening by the Federal Reserve System. More recently, the Russian invasion of Ukraine has had a tightening impact on financial conditions amid a deterioration in risk sentiment, particularly in European markets. Across EMEs, financial conditions continued to tighten as risk-off sentiment added to the tightening of monetary policy over the past year, especially in large EMEs, amid high inflation (excluding China).
Global real GDP growth (excluding the euro area) is projected to gradually moderate over the projection horizon. From 2022 onwards, global real GDP (excluding the euro area) is projected to record more moderate growth rates. This reflects the short-lived impact of the Omicron variant and, further out, the effect of the Russia-Ukraine war. Rising inflation is expected to keep private consumption subdued, while tighter labour market conditions and diminishing policy support, which are only partly counterbalanced by unwinding supply bottlenecks, are projected to remain a drag on the economy. This is especially the case for the United States, where it is assumed that monetary policy support will be unwound starting in 2022. Also, the fiscal stimulus embedded in the current baseline is smaller than assumed until the December 2021 Eurosystem staff macroeconomic projections. Given that Congress is not expected to approve the Build Back Better Act, only the measures adopted over the summer are included in the baseline projections. Economic growth in Russia is projected to take a severe hit from the effects of the war in Ukraine and the sanctions that have been imposed. Among other EMEs, growth is projected to slow in Brazil, mainly due to aggressive monetary policy tightening in response to rising inflationary pressures, and in Turkey given the market turmoil related to high policy uncertainty and very high inflation, adversely affecting consumption and investment. Compared with the December 2021 Eurosystem staff macroeconomic projections, global real GDP growth has been revised down over the projection horizon (-0.4 percentage points in 2022, -0.3 percentage points in 2023 and -0.1 percentage points in 2024). In 2022 the adverse impact of the factors listed above is partly offset by a positive carry-over effect from the end of 2021, while in later years downward revisions relate to weaker global growth on account of the Russia-Ukraine war and also to lower growth in both the United States and some large EMEs. Real GDP growth is projected to total 4.1% in 2022 and 3.6% in both 2023 and 2024.
In the United States, economic activity is expected to have slowed down at the turn of the year as a result of the Omicron variant and lower government support. The US economy expanded strongly in the fourth quarter of 2021, driven mainly by strong replenishment of inventories. Growth is projected to have declined at the turn of the year due to the impact of the Omicron variant and lower private consumption induced by reduced government transfers. Economic activity is expected to rebound thereafter, albeit only gradually, as the Russia-Ukraine war is seen to weigh on activity especially in the second quarter. Consumer price inflation, both headline and core, continued to surprise to the upside over the last few months, thus leading the Federal Reserve to start unwinding its monetary policy stimulus and raising rates in March 2022. At the same time, the overall number of rate hikes anticipated for 2022 was raised to seven in the recently released March 2022 Federal Open Market Committee projections, including an overshooting of the neutral long-run rate in 2023-24. Over the forecast horizon, US growth is expected to moderate on the back of a smaller fiscal impulse and monetary policy tightening. Headline inflation is forecast to peak at above 7% in the first quarter of 2022 and decline thereafter, but to remain above the Federal Reserve’s target of 2%, consistent with a positive output gap.
In China, economic activity remained subdued at the turn of the year, buffeted by persistent headwinds. Real GDP growth declined in the second half of 2021 in annual terms, reflecting the turmoil in the residential property sector and new outbreaks of COVID-19. These headwinds continued to weigh on investment and consumption at the turn of the year, such that GDP and trade growth are seen to decelerate in the first quarter of 2022. In the second quarter, the effect from the Russia-Ukraine war is expected to slightly limit the strength of the anticipated rebound. Headline consumer price inflation decreased from 1.5% in December to 0.9% in January (year on year), largely due to food price deflation as pork prices normalised and food supply recovered from disruptions caused by bad weather. Core CPI, excluding food and energy, remained unchanged at 1.2% (year on year). Higher commodity prices have resulted in upward revisions to forecast inflation in early 2022 but are not expected to materially change the inflation outlook for 2022-24. Policy is turning more accommodative to counterbalance the headwinds to economic growth.
In Japan, a firmer recovery is expected further ahead following a temporary slowdown in growth at the start of 2022. The economic recovery resumed towards the end of 2021, after containment measures were lifted in late summer and some supply constraints started to ease. While the economy is expected to have slowed again at the start of 2022 due to the impact of the Omicron variant and lingering supply constraints, a firmer recovery is seen further ahead, supported by recent announcements of additional fiscal policy stimulus. The fallout from the Russia-Ukraine war is assessed to be rather limited at this stage and to occur mainly in the short term. Economic growth is then expected to moderate and gradually return to trend. Annual CPI inflation is projected to pick up in the near term, in part reflecting the waning of some temporary factors (including lower mobile phone charges), but to remain below the central bank’s target over the projection horizon.
In the United Kingdom, the outlook is expected to remain rather subdued amid strong price pressures and persistent supply bottlenecks. The pace of economic recovery remained weak in the last quarter of 2021, mainly because of the rapid spread of the Omicron variant in December, which added to the stress from supply bottlenecks and labour shortages in some sectors. While the drag from the Omicron variant appears short-lived, the fallout from the Russia-Ukraine war is seen to weigh on growth in the near term. Further out, other, more structural impediments, partly related to Brexit, are expected to continue weighing on UK activity over the projection horizon. Consumer price inflation surprised to the upside in January as a result of high food prices and rising services costs. Headline inflation is projected to peak at close to 7% in the second quarter of 2022 – with further rate hikes by the Bank of England expected to come – and to moderate thereafter.
In central and eastern EU Member States, headwinds – not least related to the war in Ukraine – are expected to slow the pace of economic expansion. Activity in central and eastern Europe continued to expand at a solid pace in the second half of 2021 on the back of strong household consumption. Going forward, real GDP growth is forecast to moderate amid the economic fallout from the war in Ukraine, persistent supply bottlenecks, price pressures and a temporary increase in the number of new COVID-19 cases. Economic activity is expected to remain resilient in the medium term, driven by recovering domestic demand. Developments in energy markets and the latest data point to continued inflationary pressures in 2022 and 2023, while a normalisation towards more moderate rates is projected at the end of the forecast horizon.
In Russia, the economy is expected to enter recession in 2022 as a result of the invasion of Ukraine and the ensuing sanctions imposed by Western countries. Growth momentum was strong towards the end of 2021, but the severe sanctions and negative sentiment are expected to significantly reduce both internal and external financing, cut consumption and investment and disrupt Russia’s international trade. Significant depreciation of the rouble prompted the central bank to raise its policy rate from 9.5% to 20% and impose capital controls to stabilise markets. Looking ahead, the depreciation of the rouble and import price shocks from sanctions will likely keep inflation high. Inflation is expected to return towards the Bank of Russia’s target of 4% only gradually in the medium term. The outlook remains clouded by significant geopolitical risks.
In Brazil, a fast tightening of monetary policy and a less benign foreign environment are expected to weigh on growth in 2022. Economic growth resumed in the last quarter of 2021, as net exports became less of a drag. At the same time, the recovery in domestic demand remained subdued due to high inflation, rising interest rates, worsening market sentiment and persistent supply bottlenecks. The fast tightening of monetary policy and the less benign foreign environment are likely to weigh on growth in 2022, while the impact of the Omicron variant is expected to be only short-lived. Economic growth is projected to rebound somewhat beyond 2022 as market sentiment improves and supply bottlenecks ease. However, limited fiscal space and insufficient progress on structural reforms will continue to constrain medium-term growth prospects. Given the recent surge in commodity prices, consumer price inflation is only expected to return to target in 2023.
In Turkey, economic activity is expected to slow sharply after growing strongly in 2021, as policy uncertainty and macroeconomic imbalances are exacerbated by significant exposure to the fallout from the Russia-Ukraine war. In 2021 economic activity rebounded strongly in Turkey on the back of accommodative economic policies, pent-up demand and buoyant external demand. Despite rising inflationary and depreciation pressures, the central bank delivered a fourth consecutive policy rate cut in December, to 14%. As a result, the foreign exchange and stock markets experienced historically high volatility, later curbed by sizeable currency interventions and the introduction of a new scheme of protected lira time deposits. Inflation reached 36.1% in December 2021 and rose to almost 55% in February 2022. Looking ahead, a slowdown in private consumption induced by rising living costs, coupled with a decline in investment, is expected to weigh on the growth outlook. The economic fallout from the Russia-Ukraine war is likely to be significant for Turkey, given the large flows of tourists from both countries as well as Turkey’s dependency on (energy) imports from Russia. The conflict could therefore seriously affect growth and macroeconomic stability, by adding to inflationary pressures, curtailing exports and widening the current account deficit, which could in turn exacerbate the already sizeable depreciation of the lira.
Global trade (excluding the euro area) grew robustly in 2021, supported by strong demand for goods, notwithstanding supply chain disruptions. Global trade proved stronger than expected in the second half of 2021, driven by a robust performance in emerging Asia and, in the fourth quarter, the United States. Strains in global production networks continue to be felt in the shipping sector in particular, where prices remain elevated. By contrast, the recovery in global car production points to some easing of semiconductor shortages in recent months. Compared with the December 2021 Eurosystem staff macroeconomic projections, global import growth (excluding the euro area) for 2021 has been revised up by 1 percentage point to 12.1%.
Incoming high frequency indicators point to subdued trade growth at the turn of the year, although this is expected to be temporary. Between December and January, services trade (as reflected in the weekly indicators for hotel bookings and numbers of flights) declined as the pandemic intensified. This volatility proved only temporary, as concerns about the severity of the Omicron variant’s impact started to dissipate. For the first quarter of 2022, high frequency data point to continued trade growth stemming from strong demand, in particular for steel and tech products, and somewhat less disruptive bottlenecks. Taiwan’s export orders, a global bellwether of global technology demand, have risen sharply since mid-2021 and reached record highs in November. Steel production recovered strongly towards the end of 2021 after a sharp contraction in the third quarter amid a slowdown in China’s real estate sector and new waves of COVID-19 infections. This strong recovery is expected to have continued in early 2022.
Chart 2
Global imports of goods and new export orders PMI (excluding the euro area)
(left-hand scale: index, December 2019 = 100; right-hand scale: diffusion index)
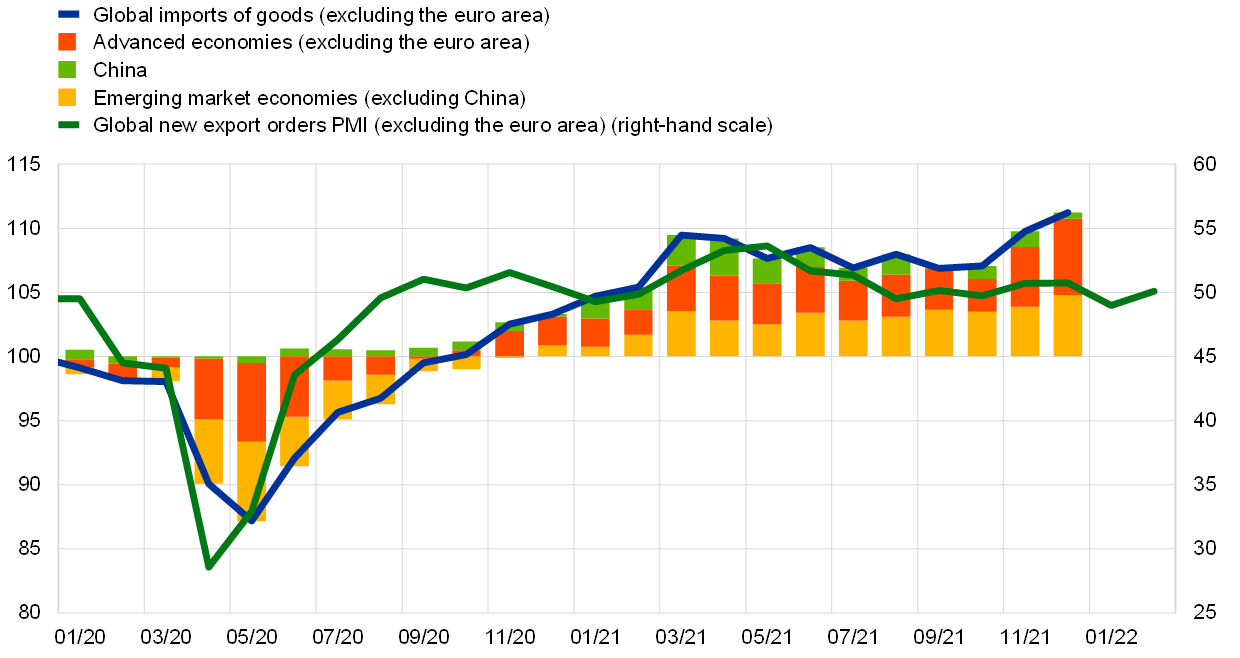
Sources: IHS Markit, CPB Netherlands Bureau for Economic Policy Analysis and ECB calculations.
Note: The latest observations are for February 2022 for the PMI data and December 2021 for global imports of goods.
Global import growth (excluding the euro area) is expected to gradually normalise over the projection horizon. The better than expected outturn in the second half of 2021 gives rise to a large carry-over effect into 2022 which more than offsets the weaker dynamics stemming from the revisions in global activity and the negative effects on trade of the Russia-Ukraine war. In 2023 global imports are projected to grow at a more moderate pace, reflecting the effect of the ongoing conflict, a broad-based deceleration across regions and the assumption that demand for consumer goods will gradually normalise. Compared with the December 2021 Eurosystem staff macroeconomic projections, global import growth has been revised upwards for 2022 (by 0.7 percentage points), on account of the positive carry-over effect, and downwards for 2023 and 2024 (by 0.7 percentage points and 0.2 percentage points respectively).
Euro area foreign demand is also projected to moderate gradually over the projection horizon, reflecting the fallout from the Russia-Ukraine war. After totalling an estimated 9.9% in 2021, growth in euro area foreign demand is projected to moderate to 4.0% in 2022, 3.2% in 2023 and 3.6% in 2024. Compared with global imports, it is more heavily affected by the conflict, given the large share in euro area trade of Russia as well as countries in central and eastern Europe, which are more exposed to the headwinds from the conflict than other countries outside the euro area. Compared with the December 2021 Eurosystem staff macroeconomic projections, the growth rate of euro area foreign demand has been left unchanged for 2022, as the impact of the invasion fully offsets the positive carry-over effect from 2021, and revised downwards for 2023 (by 1.1 percentage points) and 2024 (by 0.3 percentage points).
With uncertainty surrounding the forecast very high, the balance of risks around the global outlook is assessed to be to the downside for activity and to the upside for inflation. While the pandemic remains an important downside risk to the global outlook, the Russian invasion of Ukraine has raised global uncertainty significantly and is denting global growth. Looking ahead, downside tail risks from a further escalation of the conflict could be significant and could derail the global recovery while fuelling inflationary pressures. Firms may pass higher commodity prices that feed into higher production costs on to consumers in the form of higher prices for final goods. This in turn could lead to higher wage demands and further stoke inflationary pressures via wage-price spirals. Moreover, the Russia-Ukraine conflict could aggravate supply bottlenecks, causing shortages of commodities and critical raw materials in particular, as well as logistical and transport issues resulting from flight and shipping bans affecting trade across the region.
Global price developments
High and rising energy prices remain a key headwind for the global economy. Oil spot prices have risen quickly since the cut-off date for the December 2021 Eurosystem staff macroeconomic projections (+57% as of 9 March) and continue to reflect the recovery in demand as well as supply-side limitations. On the demand side, oil markets appear to reflect optimism that the Omicron variant will not affect global oil demand as much as previously feared. More recently, oil prices have been driven primarily by risks to supply. First, the Russian invasion of Ukraine has prompted fears about short-term threats to oil supply as Russia accounts for around 10% of global supply. Second, OPEC+ countries have continued to fall short of the planned production targets, particularly Nigeria and Angola owing to outdated infrastructure and political instability. According to the latest US Energy Information Administration report, the 2022 targets are also unlikely to be reached as some countries are having difficulty bringing idle capacity back online. Oil futures prices remain on a downward slope, reflecting current tightness in the oil market and a high convenience yield, but upside tail risks have increased as tensions between Russia and Ukraine escalated into war. European gas spot prices remain very volatile, reflecting fears that Russia may ration energy supply to Europe in a potentially prolonged conflict (at the cut-off date of 9 March, they were 62% higher than in the December 2021 Eurosystem staff macroeconomic projections). Non-energy commodity prices also increased, due to the increase in both metal and food prices as high energy prices pushed up metals and fertiliser prices, among other factors. Notably, the price of wheat has increased substantially following the Russian invasion of Ukraine as the two countries are among the world’s largest exporters of the cereal, together accounting for 25% of global supply.
Consumer price inflation increased sharply across advanced and emerging economies in 2021. In several key economies, consumer price inflation surprised to the upside in the course of 2021 on account of a variety of factors (e.g. high energy prices, strains in global production networks and labour shortages) which are proving more persistent than initially assumed. Across OECD countries, CPI inflation accelerated for the fourth consecutive month in January to reach 7.2%, while core inflation stood at 5.1%. This marked a very steep increase compared with December (+0.6 percentage points and +0.5 percentage points respectively), largely driven by exceptional price developments in Turkey, where headline inflation in January increased to 48.7%. Excluding Turkey, the increase in headline inflation was more moderate (rising to 5.8% from 5.5% in December) but still sizeable and broad-based across countries. While the increase in inflation in EMEs has brought it to levels broadly in line with historical regularities, inflation in advanced economies has reached multi-year highs.
Chart 3
OECD consumer price inflation
(year-on-year percentage changes; percentage point contributions)

Sources: OECD and ECB calculations.
Note: The latest observations are for January 2022.
Inflationary pressures among the euro area’s major trading partners are likely to persist in 2022, albeit with declining intensity in some cases, implying ongoing high growth in the export prices of euro area competitors. Producer prices globally have increased substantially, supported by rising prices for energy and other commodities, particularly food, amid persisting mismatches between supply and demand which was also underpinned by past policy stimulus. As a reflection of this, the annual rate of increase in euro area competitors’ export prices is projected to be much stronger than previously expected in 2022 before slowing to a more subdued pace over the remainder of the projection horizon.
2 Financial developments
Over the review period (16 December 2021 to 9 March 2022), euro area financial markets were predominantly influenced, before 24 February 2022, by shifts in the inflation outlook and rising geopolitical uncertainty with regard to a possible military intervention by Russia in Ukraine and, after 24 February 2022, by Russia’s large-scale invasion of Ukraine. Reflecting growing expectations of monetary policy normalisation in an environment of rising near-term inflation expectations, the short end of the euro short-term rate (€STR) forward curve increased markedly, a situation which continued until the end of February. After that, forward rates declined to some extent, with markets adjusting their policy outlook in the face of Russia’s invasion of Ukraine. In line with short-term rates, risk-free long-term overnight index swap (OIS) rates also increased strongly at first, before experiencing reversals towards the end of the review period. Sovereign bond spreads remained broadly unchanged overall. The heightened geopolitical uncertainty seen since the end of February triggered significant volatility across markets, with global equities recording notable losses. Euro area corporate bond spreads widened during the review period, a trend which accelerated following Russia’s invasion of Ukraine. The euro depreciated against most major currencies.
The benchmark €STR averaged -58 basis points over the review period. Excess liquidity increased by approximately €105 billion to €4,483 billion, mainly reflecting an increase of around €140 billion[3] in securities held for monetary policy purposes under the pandemic emergency purchase programme and the asset purchase programme, as well as the €51.97 billion take-up of the tenth operation under the third series of targeted longer-term refinancing operations (TLTRO III) on 22 December 2021. The growth in monetary policy assets was substantially offset by early repayments associated with previous TLTRO III operations, which amounted to €60.21 billion worth of funds borrowed.
Following the December meeting of the Governing Council, there was a marked upward shift in the short end of the €STR forward curve, which accelerated after the February meeting of the Governing Council, suggesting a significant repricing of rate hike expectations by market participants, while the curve flattened somewhat after Russia invaded Ukraine on 24 February 2022 (Chart 4). The short end of the €STR forward curve moved up during the first part of the review period, until late February, in an environment characterised by upward surprises in headline inflation and increasing near-term inflation expectations. The steepening was especially marked in the light of the firmer expectations of monetary policy normalisation triggered by the February meeting of the Governing Council. Later in the review period, in response to Russia’s invasion of Ukraine, the rise in the €STR forward curve reversed to some extent, given increased uncertainty over the economic fallout from the still unfolding war. Overall, the expected rate path and lift-off timing were surrounded by a high level of uncertainty, as reflected by elevated volatility in money markets.
Chart 4
€STR forward rates
(percentages per annum)

Sources: Bloomberg and ECB calculations.
Long-term average euro area sovereign bond yields increased in line with risk-free rates, reaching levels that were significantly higher than they had been at the start of the review period, despite a transitory drop after Russia’s invasion of Ukraine on 24 February 2022, with partly differing patterns across euro area countries (Chart 5). Between mid-December and mid-February, sovereign bond yields increased in line with the strong upward trend in longer-term risk-free rates, which also resulted in a steeper sovereign yield curve, reflecting higher inflation compensation amid waning concerns over the Omicron variant of the coronavirus (COVID-19) and firmer expectations in respect of monetary policy normalisation. However, sovereign bond yields subsequently dropped in the wake of the Russian invasion of Ukraine as real rates fell, with some minor flight-to-safety movements but, overall, a broad-based decline across the euro area amid expectations of slower monetary policy normalisation given the economic uncertainties ahead. Over the review period, both the GDP-weighted euro area average ten-year sovereign bond yield and the ten-year risk-free OIS rate based on the €STR increased by approximately 70 basis points, to 0.74% and 0.64% respectively. Similar developments were seen in the United States, where the ten-year sovereign bond yield increased by around 50 basis points, reaching 1.95% at the end of the review period.
Chart 5
Ten-year sovereign bond yields and the ten-year OIS rate based on the €STR
(percentages per annum)

Sources: Refinitiv and ECB calculations.
Notes: The vertical grey line denotes the start of the review period on 16 December 2021. The latest observation is for 9 March 2022.
Long-term euro area sovereign spreads relative to €STR OIS rates increased in some jurisdictions, especially following the February meeting of the Governing Council, before declining again because of the escalating war in Ukraine (Chart 6). Several sovereign bond markets displayed spread increases around the February meeting of the Governing Council, in anticipation of potential monetary policy normalisation amid rising inflation concerns (e.g. 19 basis points in Italy, 12 basis points in Portugal and 11 basis points in Spain between 2 February and 4 February 2022). However, the more recent escalation of the Russia-Ukraine conflict more than reversed the upward movement, as expectations of interest rate increases abated. At the end of the review period, the GDP-weighted euro area average ten-year sovereign spread was 7 basis points lower than in December. This change was affected by the decrease in long-term sovereign yield spreads in Germany, which turned more negative by almost 20 basis points in the second half of the review period, possibly driven by a flight to safe-haven countries amid geopolitical tensions.
Chart 6
Ten-year euro area sovereign bond spreads vis-à-vis the ten-year €STR OIS rate
(percentage points)

Sources: Refinitiv and ECB calculations.
Notes: The spread is calculated by subtracting the ten-year €STR OIS rate from the ten-year sovereign bond yield. The vertical grey line denotes the start of the review period on 16 December 2021. The latest observation is for 9 March 2022.
After an initial rise to all-time highs, global equity markets sold off, initially in response to rising risk-free rates and later, more significantly, due to the rise in geopolitical uncertainty (Chart 7). While at the beginning of the review period solid earnings growth expectations supported equity markets overall, equity prices declined thereafter in both the euro area and the United States in response to the rise in risk-free discount rates. By the end of February, the materialisation of tensions between Russia and Ukraine, and the subsequent financial sanctions imposed by Western countries on Russia, had exerted additional downward pressure on equity prices and had led to significant market volatility on both sides of the Atlantic. More specifically, over the review period as a whole, the equity prices of non-financial corporations (NFCs) fell by 12% in the euro area and 9% in the United States, while euro area and US bank equity prices recorded a decrease of 10% and 8% respectively. The poorer performance of equity markets in the euro area compared with the United States reflected the relatively higher exposure of Europe to economic and financial fallout from the conflict and related sanctions.
Chart 7
Euro area and US equity price indices
(index: 1 January 2018 = 100)

Sources: Refinitiv and ECB calculations.
Notes: The vertical grey line denotes the start of the review period on 16 December 2021. The latest observation is for 9 March 2022.
Mirroring developments in equity prices, euro area corporate bond spreads widened over the review period, especially after Russia’s invasion of Ukraine (Chart 8). At the beginning of the review period, the investment-grade NFC bond spread and the financial sector bond spread (relative to the risk-free rate) started to increase slightly on the back of anticipated monetary policy normalisation, before rising more significantly in response to the elevated Russia-Ukraine tensions which manifested themselves in late February.
Chart 8
Euro area corporate bond spreads
(basis points)

Sources: Markit iBoxx indices and ECB calculations.
Notes: The spreads are the difference between asset swap rates and the risk-free rate. The indices comprise bonds of different maturities (with at least one year remaining) with an investment-grade rating. The vertical grey line denotes the start of the review period on 16 December 2021. The latest observation is for 9 March 2022.
In foreign exchange markets, the euro broadly depreciated in trade-weighted terms (Chart 9). Over the review period, the nominal effective exchange rate of the euro, as measured against the currencies of 42 of the euro area’s most important trading partners, weakened by 1.0%. Turning to bilateral exchange rate movements, the euro continued to depreciate against the US dollar (-3.0%), reflecting the further widening of the short-term interest rate differential between the euro area and the United States. The latter was driven by the faster rebound in economic activity and higher inflation in the United States, which affected the expected path of US monetary policy. The euro also depreciated against other major currencies, including the Swiss franc (-2.5%), the Japanese yen (-1.6%) and the pound sterling (-1.5%). In addition, it depreciated against the currencies of most major emerging economies, including the Chinese renminbi (-3.8%). At the same time, the euro appreciated strongly against the Russian rouble, as the rouble dropped by more than 30% on a single day following the imposition of unprecedented economic and financial sanctions against the Russian Federation, in response to its invasion of Ukraine in violation of international law. Given the nature of trading activity in the rouble market, the ECB suspended the publication of a euro reference rate for the Russian rouble, as of 1 March 2022. Over the reference period, the euro broadly appreciated against the currencies of most non-euro area EU Member States.
Chart 9
Changes in the exchange rate of the euro vis-à-vis selected currencies
(percentage changes)

Source: ECB.
Notes: EER-42 is the nominal effective exchange rate of the euro against the currencies of 42 of the euro area’s most important trading partners. A positive (negative) change corresponds to an appreciation (depreciation) of the euro. All changes have been calculated using the foreign exchange rates prevailing on 9 March 2022, except for the Russian rouble for which the change has been calculated using the foreign exchange rate prevailing on 1 March 2022 as the publication of a euro reference rate for the Russian rouble has been suspended.
3 Economic activity
In 2021 euro area real GDP grew by 5.3%, slightly surpassing its pre-pandemic level at the end of the year. In the final quarter of the year the pace of the expansion moderated, owing to weak private consumption which contracted by 0.6% as a result of increasing coronavirus (COVID-19) infections, coupled with higher energy prices weighing on the purchasing power of households. Net trade also made a negative contribution to growth in the fourth quarter. In contrast, investment and public sector consumption provided positive contributions to economic growth. On the production side, the ongoing recovery in industrial production suggests still tight, but gradually easing, supply bottlenecks. Overall, incoming data, surveys and high-frequency indicators point to continued economic weakness in the first quarter of 2022, amid negative carry-over effects from weak activity at the end of 2021, persistent supply disruptions, high energy prices and the unfolding effects of the war in Ukraine.
Growth should pick up over the course of 2022 as a number of headwinds start to fade. The expected improvement is based on the diminishing economic impact of the COVID-19 pandemic, continued favourable financing conditions and an improving labour market. However, the war in Ukraine is estimated to have reduced spending intentions in the near term, mainly via its impact on energy costs and confidence, resulting in expectations of a weaker expansion in the second quarter.
This assessment is broadly reflected in the baseline scenario of the March 2022 ECB staff macroeconomic projections for the euro area. The projections foresee annual real GDP growth of 3.7% in 2022, 2.8% in 2023 and 1.6% in 2024. Compared with the December 2021 Eurosystem staff macroeconomic projections, the outlook for economic activity has been revised downwards by 0.5 percentage points for 2022 and 0.1 percentage points for 2023, and remains unchanged for 2024. The revisions for 2022 largely reflect the impact of the Ukraine crisis on energy prices, confidence and trade. The risks to the economic outlook have increased substantially with the Russian invasion of Ukraine and are tilted to the downside. While risks relating to the pandemic have declined, the war in Ukraine may have a stronger than anticipated effect on economic sentiment and could worsen supply-side constraints again. Before the outbreak of the Russia-Ukraine war, the euro area economy had registered a sustained recovery, with growth reaching its pre-crisis level despite headwinds related to the pandemic, supply disruptions and high energy prices. While the ECB staff macroeconomic projections foresee economic activity expanding at a robust pace over the medium-term projection horizon, the Russia-Ukraine war will have a material impact on activity. In alternative scenarios that take account of the economic impact of the war, growth could be dampened significantly by steeper rises in energy and commodity prices, as well as more severe drags on trade and sentiment.
Following two quarters of dynamic expansion, real GDP growth decreased in the fourth quarter of 2021. The modest 0.3% growth in the fourth quarter was mainly due to weakness in private consumption and net trade, while investment and public sector consumption, alongside inventory developments, made positive contributions to growth (Chart 10). At the end of 2021 output had slightly surpassed its pre-pandemic level, growing by 5.3% in the year as a whole. On the production side, developments in the fourth quarter of 2021 varied across sectors. While value added in the services sector declined following the imposing of new containment measures amid the resurgence in COVID-19 cases (Chart 11, left-hand panel), output in the industrial sector (excluding construction) increased further, marking positive dynamics in the last quarter of 2021.
Chart 10
Euro area real GDP and components
(percentage changes since the fourth quarter of 2019; percentage point contributions)
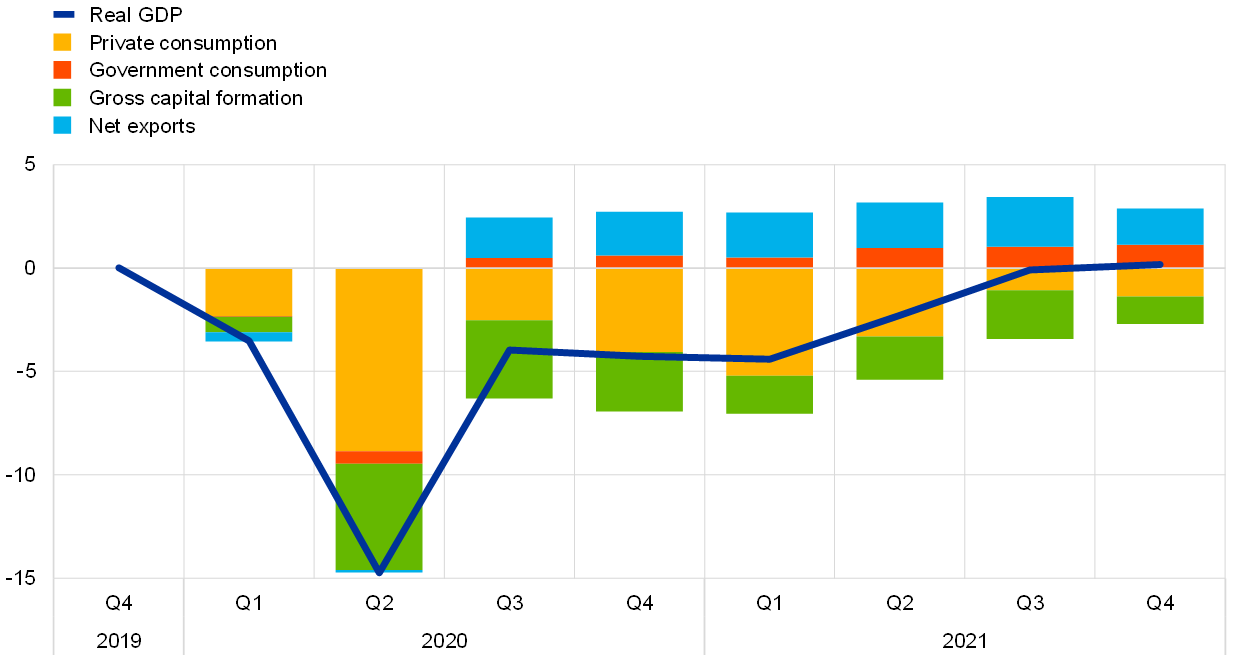
Sources: Eurostat and ECB calculations.
Note: The latest observations are for the fourth quarter of 2021.
Euro area GDP growth is estimated to remain subdued in the first quarter of 2022, amid negative carry-over effects from weak activity at the end of 2021, high energy prices and the unfolding effects of the war in Ukraine. While a normalisation of growth rates was expected following emerging signs of a gradual easing of supply bottlenecks (Box 1) and the waning of the Omicron wave, the current slowdown is likely to have been amplified by the combined effects of sharp increases in energy prices and high levels of uncertainty in the context of the war in Ukraine (Chart 11, right-hand panel). Incoming data in the first few months of 2022 point to a similarly moderate rate of growth in the near term. Amid lingering uncertainty about the pandemic and elevated inflationary pressures, the February round of the European Commission’s consumer survey indicated that, overall, consumer confidence and households’ expectations about their future financial situation have deteriorated further.
Chart 11
The Oxford Stringency Index and the uncertainty measure in the euro area
(index)

Sources: Bloomberg, Oxford University and ECB staff calculations.
Notes: The Oxford COVID-19 Stringency Index is a composite measure based on nine government response indicators including school closures, workplace closures and travel bans, rescaled to a value from 0 to 100 (100 = strictest). The VSTOXX index measures volatility in the EURO STOXX 50 index. The latest observations are for 9 March 2022.
The euro area labour market strengthened further in the fourth quarter of 2021. Employment grew by 0.5%, quarter on quarter, in the fourth quarter of 2021 (Chart 12), surpassing its pre-pandemic level. Strengthening labour demand was also reflected in a further increase in the aggregate job vacancy rate, which rose to a new series high of 2.7% in the fourth quarter of 2021. Moreover, this rise was more broad-based across sectors. The size of the labour force and the labour force participation rate returned to close to their pre-pandemic levels in the fourth and third quarters of 2021 respectively. After averaging 7.1% in the final quarter of 2021, the unemployment rate declined further to stand at 6.8% in January 2022. However, support from job retention schemes remained substantial, with their use ticking up slightly to 1.5% of the labour force in January as containment measures were reimposed.
Chart 12
Euro area employment, the PMI assessment of employment and the unemployment rate
(left-hand scale: quarter-on-quarter percentage changes, diffusion index; right-hand scale: percentages of the labour force)
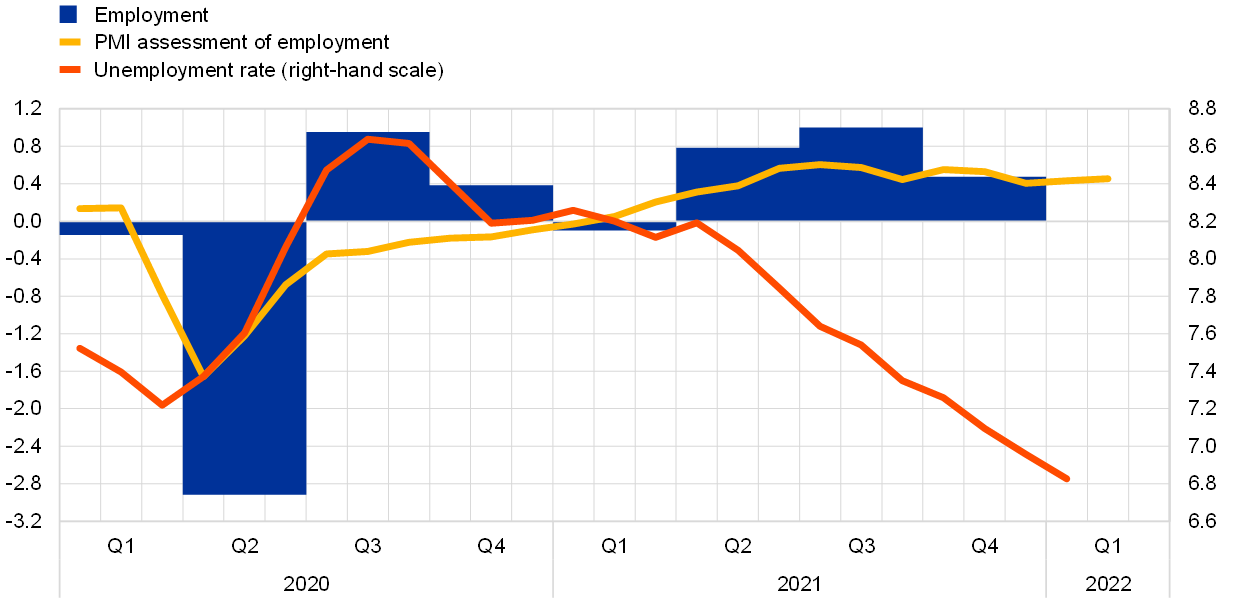
Sources: Eurostat, Markit and ECB calculations.
Notes: The Purchasing Managers’ Index (PMI) employment indicator and the unemployment rate are shown at a monthly frequency, while employment is shown at a quarterly frequency. The PMI is expressed as a deviation from 50 divided by 10. The latest observations are for the fourth quarter of 2021 for employment, February 2022 for the PMI and January 2022 for the unemployment rate.
Survey data point to continued robust employment growth in the early months of 2022. The monthly composite Purchasing Managers’ Index (PMI) employment indicator, which encompasses both industry and services, stood at 54.5 in February, broadly unchanged from January and well above the threshold of 50 that indicates growth in employment. This outcome was recorded despite an intensification of the pandemic during the first few weeks of the year and reported difficulties in filling vacancies. By contrast, some downward pressure on average hours worked was likely due to absences related to the Omicron variant, although this was possibly attenuated by co-workers increasing their hours.
Private consumption contracted at the end of 2021 and is expected to remain weak in the first quarter of 2022. It declined by 0.6%, quarter on quarter, at the end of 2021, amid a surge in COVID-19 infections and tightening restrictions in contact-intensive sectors. Private consumption was 2.5% below its pre-pandemic level at the end of 2021. Incoming data do not suggest that this gap will be closed in the first quarter of 2022. In January 2022 retail sales registered a modest monthly increase of 0.2% after contracting by 3%, month on month, in December when new car registrations also declined, falling by 5.4%. Consumer confidence continued to fall in February, seemingly still reflecting lingering uncertainty about the pandemic as well as elevated inflationary pressures. Overall, the adverse pandemic-related impact on contact-intensive services, compounded by higher energy prices weighing heavily on the purchasing power of households, implies subdued consumption dynamics in the first quarter of 2022. Thereafter, private consumption is expected to remain the main driver of economic growth, aided by a continued normalisation of saving behaviour and as households tap the excess savings that they accumulated during the pandemic. Despite increased precautionary motives for saving related to the war in Ukraine, the high stock of savings is expected to buffer the energy price shock to some extent.
Corporate (non-construction) investment grew strongly in the fourth quarter of 2021 as supply bottlenecks showed signs of easing and demand for capital goods remained strong. Euro area non-construction investment increased by 6.3%, quarter on quarter, in the fourth quarter, rebounding after the decline in the third quarter while still standing about 13% lower than its pre-pandemic level. Among the largest euro area countries, non-construction investment surged by close to 7%, quarter on quarter, in both Spain and the Netherlands, grew by about 1% in Germany and France, and rose by nearly 2% in Italy. Looking at the components of non-construction investment, investment in intellectual property products grew by 13%, while investment in transport equipment also rebounded strongly in the euro area overall – with some countries recording double-digit growth – after contracting for three quarters. A slight improvement in some survey-based indicators of delivery times and stockbuilding may suggest the first signs of a gradual easing of supply-side bottlenecks. Looking ahead, higher business confidence in February and a more optimistic assessment of order books of capital goods producers had pointed to positive conditions for business investment in the first half of 2022 prior to the outbreak of the war in Ukraine. Moreover, robust corporate revenue growth and the high level of corporate savings could support investment once the existing supply bottlenecks weaken (Box 4). However, the war in Ukraine with the associated restrictions and uncertainty are expected to dampen euro area business investment, particularly in the near term. In addition, energy price increases could strongly affect the production of energy-intensive capital goods.
Housing investment picked up in the fourth quarter of last year and is expected to continue to grow in the short term. Housing investment increased by 0.7% in the fourth quarter of 2021 after falling by 1.4%, quarter on quarter, in the third quarter. The European Commission’s indicator of recent trends in construction activity increased markedly, on average, in the first two months of 2022, standing well above its long-term average. The PMI for residential construction activity also rose significantly, moving further into expansionary territory. On the household side, survey data from the European Commission show buoyant demand, with consumers’ near-term renovation intentions remaining at a very high level in the first quarter of 2022, despite declining somewhat, while their intentions to buy or build a home in the next two years continued to increase. The favourable developments in demand are also reflected on the corporate side, with companies’ assessments of order book levels improving and perceived constraints on construction activity caused by insufficient demand decreasing somewhat further. At the same time, supply bottlenecks appear to remain considerable, with companies reporting only a slight decline in shortages of materials and labour from very high levels amid a lengthening of suppliers’ delivery times and increases in input prices in February. Moreover, the recent outbreak of the Russia-Ukraine war and the associated uncertainties pose further risks to the near-term outlook.
Exports of goods grew moderately in the fourth quarter of 2021, while exports of services were dampened by the Omicron variant. Extra-euro area exports of goods and services expanded by 2.9% in the fourth quarter. A breakdown of exports of goods suggests that the momentum was driven by exports to the United States, while exports to the United Kingdom remained stable and exports to China declined. Extra-euro area imports of goods and services grew by 4.6% in the fourth quarter. The rise in goods imports after a decline in the previous quarter reflects pent-up demand from the industrial sector. Imports recorded particularly strong increases in value terms because of the surge in global energy prices. Forward-looking indicators point to tentative signs of easing supply chain bottlenecks, but this improvement could be offset by trade disruptions resulting from the Russia-Ukraine war. On the services side, following a slowdown in activity in the travel sector owing to the new coronavirus wave, forward-looking indicators suggest an improvement in the period ahead for exports of travel services as pandemic-related restrictions are eased. The recent outbreak of the Russia-Ukraine war, however, adds an additional layer of uncertainty to the outlook for international trade.
Amid elevated uncertainty, euro area activity is expected to pick up in the course of 2022. The March 2022 ECB staff macroeconomic projections for the euro area foresee annual real GDP growth at 3.7% in 2022, 2.8% in 2023 and 1.6% in 2024 (Chart 13). Compared with the December 2021 Eurosystem staff macroeconomic projections, the growth profile has been revised downwards for 2022 and has remained broadly unchanged for 2023 and 2024. The downward revisions to the near-term outlook largely reflect the stronger than expected energy price shock – despite being partially cushioned by the high savings accumulated during the pandemic – and the negative confidence shocks triggered by the Russia-Ukraine war. Despite headwinds, the expansion continues to be supported in the medium term by a further strengthening of domestic demand alongside an improving labour market and strengthening global growth, as well as ongoing policy support. Furthermore, progress with the implementation of the Next Generation EU programme is an additional factor that is expected to support the recovery.[4]
Chart 13
Euro area real GDP (including projections)
(index; fourth quarter of 2019 = 100; seasonally and working day-adjusted quarterly data)

Sources: Eurostat and the article entitled “ECB staff macroeconomic projections for the euro area, March 2022” published on the ECB’s website on 10 March 2022.
Note: The vertical line indicates the start of the March 2022 projections and follows the last observation for euro area real GDP, which relates to the fourth quarter of 2021.
The risks to the economic outlook have increased substantially with the Russian invasion of Ukraine and are tilted to the downside. While risks relating to the pandemic have declined, the war in Ukraine may have a stronger than anticipated effect on economic sentiment and could worsen supply-side constraints again. Persistently high energy costs, together with a loss of confidence, could drag down demand more than expected and constrain consumption and investment.
4 Prices and costs
Euro area HICP inflation rose to 5.8% in February 2022, up from 5.1% in January, and it is likely to remain high in the short term. Energy prices continue to be the main reason for the elevated rate of inflation. These were directly responsible for more than half of all headline inflation in February, and they are pushing up prices in many other sectors, too. Food prices have also risen as a result of seasonal factors, elevated transport costs and increases in the price of fertiliser. Looking ahead, further pressure on some food and commodity prices should be expected as a result of the war in Ukraine. Price rises have become more widespread, with marked increases being seen in the prices of large numbers of goods and services. Most measures of underlying inflation have risen in recent months, although it is uncertain how persistent the rise in these indicators will be, given the role of temporary pandemic-related factors and the indirect effects of higher energy prices. Market‑based indicators point to a moderation in energy price dynamics in the course of 2022, and price pressures stemming from global supply chain bottlenecks should also subside. Market and survey-based measures of longer-term inflation both stand at around 2%. The war in Ukraine is a substantial upside risk to the outlook for inflation in the near term, especially for energy prices.
According to Eurostat’s flash estimate, HICP inflation increased further in February 2022, standing at 5.8% (Chart 14). That represented a further historical high, following rates of 5.1% in January and 5.0% in December, but still only partially reflected the impact of the war in Ukraine. All of the main components – energy, food, services and non‑energy industrial goods – contributed to the increase in headline inflation. HICP inflation excluding food and energy (HICPX) rose to 2.7% in February, edging upwards again after a temporary moderation in January (when it had stood at 2.3%). That increase reflected the dynamics of both service prices and non-energy industrial goods prices.
Chart 14
Headline inflation and its main components
(annual percentage changes; percentage point contributions)

Sources: Eurostat and ECB calculations.
Note: The latest observations are for February 2022.
Energy prices continued to dominate HICP inflation, with energy inflation reaching a new historical high of 31.7% in February, up from 28.8% in January. Data for January suggest that the spike in that first month of the year primarily reflected higher gas and electricity tariffs, with prices being reset for the new year in many countries. Gas and electricity have also accounted for a large percentage of the recent heterogeneity in energy inflation, with strong and sustained contributions being made by both electricity and gas in countries such as Italy and the Netherlands, and by electricity in Spain. Those rising energy costs have probably also contributed to increases in other components of the HICP, including food inflation and non-energy industrial goods inflation (which stood at 4.1% and 3.0% respectively in February), given that energy is an input for both production and distribution.
Measures of underlying inflation have continued their recent upward movement, although this is probably, to some extent, a reflection of the indirect effects of energy price dynamics and pandemic-related factors. Measures of inflation that seek to remove the impact of temporary factors have tended to edge upwards in recent months (Chart 15). For example, HICPX inflation rose to 2.7% in February, up from 2.3% in January. Data on other measures of underlying inflation are only available up to January. In that month, HICPXX inflation (which, in addition to energy and food, also excludes travel-related items, clothing and footwear) moderated to stand at 2.3%, down from 2.4% in December. Meanwhile, the model-based Persistent and Common Component of Inflation (PCCI) rose to 3.6%, up from 3.0% in December (while the PCCI excluding energy rose to 2.3%, up from 2.1% in December), and the Supercore indicator, which comprises cyclically sensitive HICP items, edged upwards to stand at 2.6%, up from 2.5% in December. While all indicators of underlying inflation have now moved above 2%, it is uncertain how persistent the rise in these indicators will be, given the role of temporary pandemic-related factors (such as supply chain bottlenecks and the effect of reopening following coronavirus-related restrictions) and the indirect effects of higher energy prices.
Chart 15
Indicators of underlying inflation
(annual percentage changes)

Sources: Eurostat and ECB calculations.
Notes: The range of indicators of underlying inflation includes HICP excluding energy, HICP excluding energy and unprocessed food, HICPX (HICP excluding energy and food), HICPXX (HICP excluding energy, food, travel-related items, clothing and footwear), the 10% and 30% trimmed means, and the weighted median. The latest observations are for January 2022, with the sole exception of HICPX (which has been obtained from the February 2022 flash estimate).
Pipeline pressures on consumer prices for non-energy industrial goods have continued to build up, with indicators reaching record highs (Chart 16). Cost pressures have increased substantially relative to a year ago on the back of increases in global commodity prices and – in particular – energy prices. Supply chain disruption and the global recovery in demand have also contributed to input cost pressures. Looking at early stages of the pricing chain, the annual growth rate of producer prices for domestic sales of intermediate goods increased further to stand at 20.2% in January, up from 18.7% in December. Similarly, the annual growth rate of import prices for intermediate goods rose from 19.1% in December to 19.9% in January. Pressures that have built up at early stages of the pricing chain are also featuring more prominently at later stages of the chain, with producer price inflation for domestic sales of non-food consumer goods reaching a new historical high of 4.8% in January, up from 3.2% a month earlier. Import price inflation for non‑food consumer goods reached 6.1% in January, with the difference relative to domestic producer prices probably attributable to the depreciation of the euro over the last year. Import and producer prices for non-food consumer goods are key leading indicators for the dynamics of non-energy industrial goods inflation in the HICP, which implies that pressure on consumer prices is unlikely to ease in the near future.
Chart 16
Indicators of pipeline pressures
(annual percentage changes)

Sources: Eurostat and ECB calculations.
Note: The latest observations are for January 2022.
Wage growth in the euro area has remained moderate thus far (Chart 17). Growth in compensation per employee increased slightly to stand at 3.5% in the fourth quarter of 2021, reflecting increases in both hours worked per employee and compensation per hour (albeit the annual growth rate of the latter fell to 1.1% in that quarter). That increase in hours worked is a sign of further normalisation following the reopening of countries’ economies. At the same time, the pattern of growth in compensation per employee also reflects the changing impact of government support measures related to job retention schemes. In contrast, negotiated wages have not been directly affected by developments in hours worked or the recording of benefits from job retention schemes introduced in response to the pandemic, making them an important additional indicator of wage pressures. Growth in negotiated wages remained moderate in the fourth quarter of 2021, standing at 1.5%, up from 1.4% in the previous quarter (and averaging 1.5% over 2021 as a whole, down from 1.8% in 2020). However, this indicator is unlikely to reflect the impact of the current high levels of inflation, as it is backward-looking and based on past wage bargaining agreements. An ECB survey of large European companies indicates that wage growth in 2022 could be somewhat stronger, with some respondents citing the current high levels of inflation as a contributing factor.
Chart 17
Breakdown of compensation per employee into compensation per hour and hours worked
(annual percentage changes)
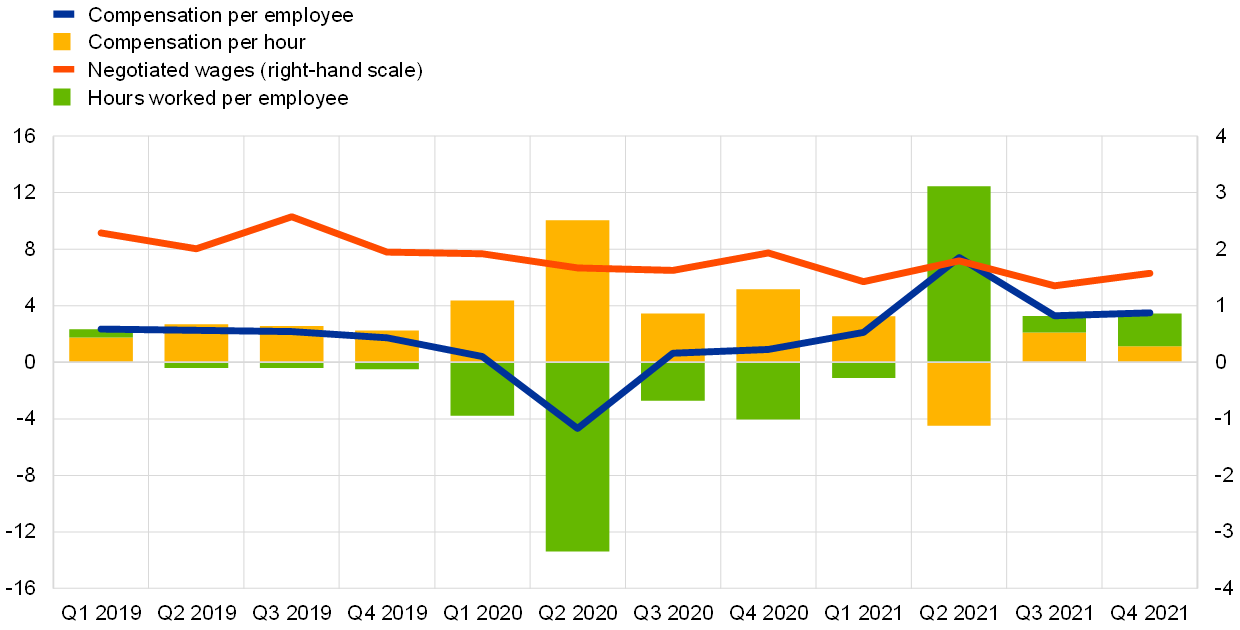
Sources: Eurostat and ECB calculations.
Note: The latest observations are for the fourth quarter of 2021.
Market-based indicators of inflation compensation have increased markedly amid extraordinary intra-period fluctuations, with survey-based measures of inflation expectations also edging upwards since the beginning of 2022. Russia’s invasion of Ukraine has led to a significant repricing of oil and natural gas in anticipation of a sharp deterioration in supply, with short-term inflationary pressures having already been strong prior to those events. As a result, short-term forward inflation compensation in the euro area has risen markedly. Markets are now pricing in a sharper and more persistent rise in euro area inflation over the short term relative to mid-December, with the one-year forward inflation-linked swap (ILS) rate one year ahead currently standing at around 2.50%, about 78 basis points higher than on 16 December 2021 at the start of the review period. Meanwhile, longer-term forward ILS rates initially declined in anticipation of a tightening of monetary policy, before rising again following the intensification of geopolitical tensions and the outbreak of war in Ukraine. Indeed, the five-year forward ILS rate five years ahead declined slightly to stand at around 1.85% at the end of January, before rising to 2.16% in early March. According to the ECB’s Survey of Professional Forecasters (SPF) for the first quarter of 2022 (which was conducted in the second week of January) and the January 2022 Consensus Economics forecasts, longer‑term inflation expectations have risen to 2.0%, up from 1.9% in their respective previous survey rounds (Chart 18).
Chart 18
Survey-based indicators of inflation expectations and market-based indicators of inflation compensation
(annual percentage changes)

Sources: Eurostat, Refinitiv, Consensus Economics, Survey of Professional Forecasters, ECB staff macroeconomic projections for the euro area and ECB calculations.
Notes: The market-based indicators of inflation compensation series is based on the one-year spot inflation rate, the one-year forward rate one year ahead, the one-year forward rate two years ahead, the one-year forward rate three years ahead and the one-year forward rate four years ahead. The latest observations for market-based indicators of inflation compensation relate to 8 March 2022. The Survey of Professional Forecasters for the first quarter of 2022 was conducted between 7 and 13 January 2022. In the Consensus Economics forecasts, the cut-off date for 2024, 2025 and 2026 was 10 January 2022, and the cut-off date for 2022 and 2023 was 7 February 2022. The cut-off date for data included in the ECB staff macroeconomic projections was 2 March 2022.
The March 2022 ECB staff macroeconomic projections for the euro area foresee inflation remaining elevated over the next few months before falling in the second half of the year, with headline inflation settling at 1.9% at the end of the projection horizon. Having reached 5.8% in February 2022, headline HICP inflation is expected to remain high over the next few months, before slowly declining in the second half of the year. Baseline projections point to headline HICP inflation averaging 5.1% in 2022, 2.1% in 2023 and 1.9% in 2024 (Chart 19). The spike in headline inflation in 2022 reflects a large increase in energy prices (driven by electricity and gas), strong increases in food prices, the impact of the reopening of the contact-intensive part of the service sector, and price pressures along the pricing chain (including energy input costs). Compared with the December 2021 Eurosystem staff macroeconomic projections, HICP inflation has been revised upwards across the entire projection horizon – most notably for 2022, for which the revision totalled 1.9 percentage points. That upward revision can, in part, be attributed to recent surprises in inflation outcomes and stronger than anticipated developments in current and future energy prices, which have been exacerbated by the geopolitical tensions surrounding the invasion of Ukraine. HICPX inflation is expected to hover around 2.6% for the next two quarters, before falling to 2.3% in the fourth quarter of 2022 (averaging 2.6% across 2022 as a whole). Strong demand, indirect effects of higher energy prices, and price pressures along the pricing chain as a result of supply bottlenecks are all expected to exert upward pressure. The impact of those factors is expected to ease in the medium term, bringing average HICPX inflation down to 1.8% in 2023 and 1.9% in 2024. Wage growth is projected to stand at 3.6% in 2022, before falling to 2.9% in 2024 – above the historical average since 1999 (2.2%) and higher than the rate observed before the global financial crisis (2.6%), reflecting the tightening of the labour market and some limited second-round effects from higher inflation.
Chart 19
Euro area HICP inflation (including projections)
(annual percentage changes)

Sources: Eurostat and ECB staff macroeconomic projections for the euro area (March 2022).
Notes: The vertical line indicates the start of the projection horizon. The latest observations are for the fourth quarter of 2021 (data) and the fourth quarter of 2024 (projections). The cut-off date for data included in the projections was 2 March 2022.
5 Money and credit
Money creation in the euro area continued to normalise in January 2022, amid greater volatility and despite heightened geopolitical risks. Eurosystem asset purchases remained the dominant driver of money creation. Growth in loans to the private sector increased, owing to favourable financing conditions and the improving economic situation. Bank lending rates remained close to their historical lows in January 2022, despite a slight rise in rates on lending to firms. In the fourth quarter of 2021, the total volume of external financing for firms increased further, primarily owing to the significant increase in bank loans. The overall cost of firms’ external financing increased from October 2021 to January 2022 – reaching the peak levels last seen in March 2020 – driven by the increase in market debt financing costs and statistical factors. Recent market fluctuations, triggered by Russia’s invasion of Ukraine, have contributed to a further increase in the cost of market-based debt and to a higher cost of equity following a pronounced stock market decline.
In January 2022 broad money growth stabilised close to its pre-pandemic pace. The annual growth rate of M3 declined to 6.4% in January, from 6.9% in December (Chart 20), amid greater volatility and despite heightened geopolitical risks, which increase the demand for liquid assets. The quarterly pace of money growth returned to a level close to its longer-term average, with shorter-run dynamics of M3 continuing to benefit from the significant support provided by the pandemic-related policy measures. On the components side, the main driver of M3 growth was the narrow aggregate M1, which includes the most liquid components of M3. During the early phases of the pandemic in 2020, money holders favoured liquid assets, which reflected precautionary motives. With pandemic-related containment measures being relaxed, and economic activity recovering, growth in M1 moderated in 2021 from the high growth rates observed during 2020. In January 2022, the annual growth rate of M1 decreased further, falling from 9.8% to 9.0%, which mainly reflected a normalisation in the growth of overnight deposits. Meanwhile, the annual growth rate of currency in circulation, which had been moderating since the first quarter of 2021, stood at 7.7% in January. The contribution of other short-term deposits and marketable instruments was neutral in that month, reflecting the low remuneration of these instruments.
Chart 20
M3, M1 and loans to the private sector
(annual percentage changes; adjusted for seasonal and calendar effects)

Source: ECB.
Notes: Loans are adjusted for loan sales, securitisation and notional cash pooling. The latest observations are for January 2022.
Growth in overnight deposits moderated further, while remaining at high levels. The annual growth rate of overnight deposits fell to 9.2% in January, from 10.2% in December. This decline was driven by firms and households, which made the largest contributions from a sectoral perspective. Sizeable inflows into overnight deposits have been observed since the onset of the pandemic, reflecting increased economic uncertainty.[5] Growth in the deposit holdings of firms and households has varied across countries, reflecting differences in liquidity needs and national (fiscal) support measures. In the fourth quarter of 2021, deposit accumulation by households temporarily fell below its pre-pandemic average, reflecting an increase in consumer confidence and consumption, as well as higher energy prices which compressed disposable income. However, in January 2022 there was a broad-based rebound in deposit flows, suggesting that households increased saving and reduced consumption. In addition, corporate deposits continued to grow, though more moderately than household deposits.
Money creation continued to be driven by Eurosystem asset purchases in January 2022. The Eurosystem’s net purchases of government securities under the asset purchase programme (APP) and the pandemic emergency purchase programme (PEPP) made the largest contribution to M3 growth (red portion of the bars in Chart 21), although this contribution moderated somewhat. Further support for M3 growth came from a higher contribution of credit to the private sector (blue portion of the bars). However, three factors dampened money creation: first, bank credit to general government made a negative contribution owing to sales of government bonds (light green portion of the bars); second, net external monetary outflows strengthened (yellow portion of the bars), coinciding with a weakening of the effective exchange rate of the euro; and third, outflows from other counterparts outweighed the modest inflows from longer-term financial liabilities (dark green portion of the bars).
Chart 21
M3 and its counterparts
(annual percentage changes; contributions in percentage points; adjusted for seasonal and calendar effects)
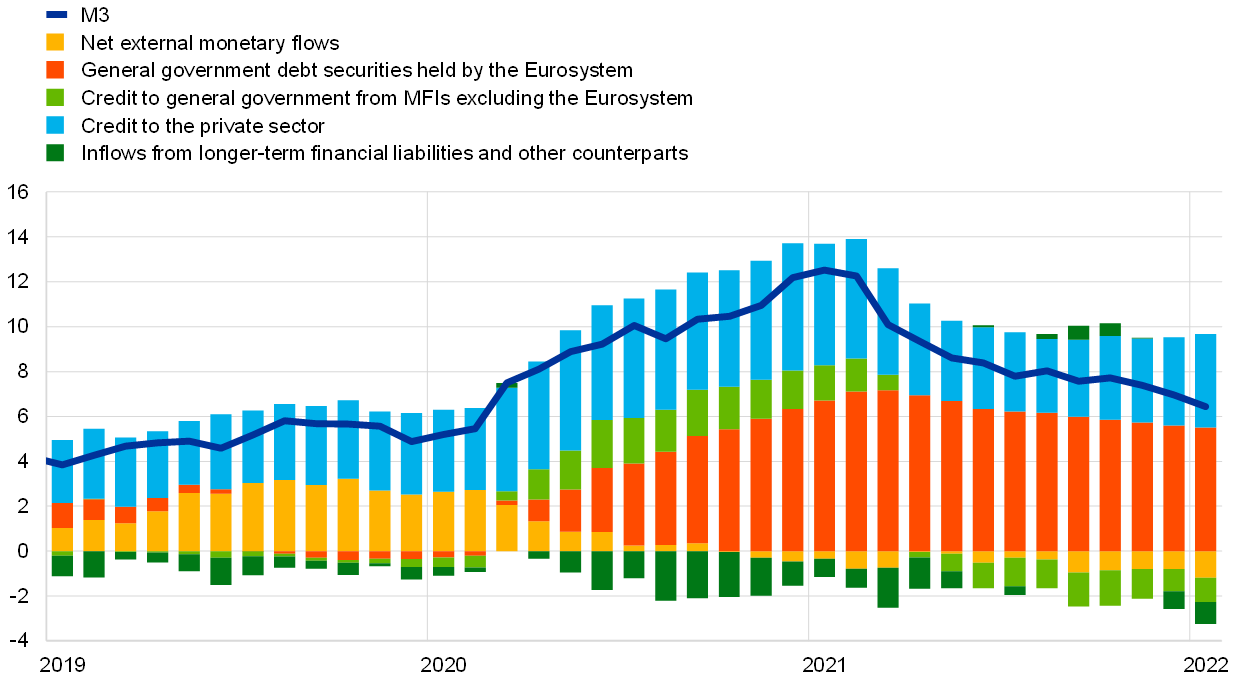
Source: ECB.
Notes: Credit to the private sector includes monetary financial institution (MFI) loans to the private sector and MFI holdings of debt securities issued by the euro area private non-MFI sector. As such, it also covers the Eurosystem’s purchases of non-MFI debt securities under the corporate sector purchase programme and the PEPP. The latest observations are for January 2022.
Annual growth in loans to the private sector increased in January 2022. Growth in loans to the private sector increased further in January, to 4.6% from 4.2% in December (Chart 20). This development was driven by lending to both firms and households, which continued to benefit from favourable financing conditions and the ongoing economic recovery. The annual growth rate of loans to non-financial corporations (NFCs) rose slightly in January, to 4.4% from 4.3% in December (Chart 22, panel a), driven by long-term loans and probably reflecting fixed investment needs. The growth rate of loans to households also increased slightly, to 4.3% in January from 4.2% in December (Chart 22, panel b). This was mainly the result of solid mortgage lending, as consumer credit growth remained weak. Overall, loan developments mask differences across euro area countries, reflecting among other things the uneven impact of the pandemic and the varying progress of the economic recovery across countries.[6]
Chart 22
MFI loans in selected euro area countries
(annual percentage changes; standard deviation)

Source: ECB.
Notes: Loans are adjusted for loan sales and securitisation; in the case of non-financial corporations (NFCs), loans are also adjusted for notional cash pooling. The cross-country standard deviation is calculated using a fixed sample of 12 euro area countries. The latest observations are for January 2022.
Debt funding costs for euro area banks have started to increase and now stand at around pre-pandemic levels. The recent increase in the composite cost of debt financing (Chart 23, panel a), was driven by higher bank bond yields (Chart 23, panel b) and reflects an increase in risk‑free rates, while deposit rates have remained stable at historical lows. The ECB’s monetary policy measures have so far helped to contain upward pressure on bank bond yields and to reduce divergence in funding conditions across countries, risk classes and maturities. Before the fourth quarter, bank funding costs had remained insulated from upward pressure for three reasons: the continued repricing of deposits at negative rates; the decline in banks’ share of debt funding; and banks’ access to central bank funding at favourable conditions, especially the third series of targeted longer-term refinancing operations (TLTRO III) and the pandemic emergency longer-term refinancing operations (PELTROs). However, if market rates increase further, there is a risk that bank funding costs will become subject to more upward pressure, especially given the prospective repayment of outstanding TLTRO funds. This may eventually translate into higher lending rates for firms and households.
Chart 23
Composite bank funding rates in selected euro area countries
(annual percentages)

Sources: ECB, ECB calculations and Markit iBoxx indices.
Notes: Composite bank funding rates are the weighted cost of deposits and unsecured market-based debt financing. The composite cost of deposits is calculated as an average of new business rates on overnight deposits, deposits with an agreed maturity and deposits redeemable at notice, weighted by their corresponding outstanding amounts. Bank bond yields refer to monthly averages of senior-tranche bonds. The latest observations are for January 2022.
Bank lending rates remained close to their historical lows in January 2022 (Chart 24), even though rates on lending to firms picked up somewhat. The composite bank lending rate for loans to NFCs increased to 1.43%, offsetting the decreases in the fourth quarter of 2021, while the equivalent rate for loans to households for house purchase remained broadly unchanged at 1.33%. The increase in lending rates for firms, which was most pronounced for loans with medium-term maturities, reflected a broad-based increase in market rates amid country heterogeneity. The spread between bank lending rates on very small loans and those on large loans was broadly unchanged and remained below pre-pandemic levels. The increase in euro area yields over the past few months could put upward pressure on domestic lending rates. The ECB’s policy measures have so far prevented a broad-based tightening of financing conditions, which would have amplified the adverse impact of the pandemic on the euro area economy.
Chart 24
Composite bank lending rates in selected euro area countries
(annual percentages, three-month moving averages; standard deviation)

Source: ECB.
Notes: Composite bank lending rates are calculated by aggregating short and long-term rates using a 24-month moving average of new business volumes. The cross-country standard deviation is calculated using a fixed sample of 12 euro area countries. The latest observations are for January 2022.
The total volume of external financing for firms increased further in the fourth quarter of 2021. The annual growth rate of external financing rose sharply from 2.3% in October to 2.8% in December, supported by firms’ greater need for financing and the low cost of debt financing. Larger external financing flows originated mostly from an increase in bank loans to firms, while greater issuance of debt securities and listed shares made a smaller contribution (Chart 25). This demand for credit was supported by business investment and higher working capital spending, in part related to persistent supply bottlenecks.[7] In countries and sectors that have been particularly affected by supply bottlenecks, the need for increased working capital – as a result of production delays and the rebuilding of inventories – has led to an increase in short-term borrowing.
Chart 25
Net external financing flows for euro area NFCs
(monthly flows in EUR billions)

Sources: ECB and ECB calculations, Eurostat and Dealogic.
Notes: Net external financing is the sum of borrowing from banks (MFI loans), net issuance of debt securities and net issuance of listed shares. MFI loans are adjusted for sales, securitisation and cash-pooling activities. The latest observations are for December 2021.
The overall nominal cost of external financing for NFCs (comprising bank loans, debt issuance in the market and equity finance) increased between October 2021 and January 2022, driven mainly by the cost of market-based debt. The cost of external financing rose to 5.2% in January 2022 (Chart 26), the same level as the peak seen in March 2020 and 110 basis points higher than the historical low of March 2021. This increase was mainly the result of both a higher cost of market-based debt and an increase in the weight of equity in the calculation of the overall cost of financing.[8] The latter more than compensated for a slight decline in the cost of equity in January compared with October, which was driven by a lower equity risk premium, in turn outweighing the effect of higher risk-free rates. The cost of borrowing from banks remained virtually unchanged between October and January. Higher risk-free rates and wider corporate bond spreads – in both the investment grade and high yield segments – were the factors accounting for the increase in the cost of market-based debt, which reached levels last seen in August 2020. More recently, the overall cost of financing is estimated to have increased further between the end of January and 9 March, reflecting a higher cost of equity amid the significant stock price declines since the end of February triggered by the war in Ukraine. Wider corporate bond spreads, combined with further increases in the risk-free rate, have also contributed to the increase in the cost of financing.
Chart 26
Nominal cost of external financing for euro area NFCs by component
(annual percentages)

Sources: ECB and ECB estimates, Eurostat, Dealogic, Merrill Lynch, Bloomberg and Thomson Reuters.
Notes: The overall cost of financing for NFCs is calculated as a weighted average of the cost of borrowing from banks, market-based debt and equity, based on their respective outstanding amounts. The dark blue diamonds indicate nowcasts for the overall cost of financing in February and March 2022 (Including data until 9 March), assuming that the cost of borrowing from banks remains unchanged at its January 2022 level. The latest observations are for 9 March 2022 for the cost of market-based debt (monthly average of daily data), 4 March 2022 for the cost of equity (weekly data) and February 2022 for the cost of borrowing from banks (monthly data).
6 Fiscal developments
According to the March 2022 ECB staff macroeconomic projections, the euro area general government budget balance continues to improve from the very high deficits recorded as a result of the coronavirus (COVID-19) crisis. Risks to this baseline are, however, substantial and increasingly tilted towards larger budget deficits, mainly related to the Russian war in Ukraine. According to the baseline, the deficit ratio is estimated to have fallen to 5.5% of GDP in 2021 from a peak of 7.2% in 2020. It is projected to fall further to 3.1% in 2022 and to 2% by the end of the forecast horizon. In terms of the euro area fiscal stance, a strong expansion in 2020 was followed by a less supportive fiscal stance in 2021 once adjusted for Next Generation EU (NGEU) grants. In 2022 the stance is projected to tighten further, mainly owing to a reversal of a significant part of the coronavirus crisis emergency support. The tightening is projected to be only marginal over the last two years of the forecast horizon, and significant support to the economy remains in place. In the light of high risks currently emanating from multiple sources, which are in part already materialising, fiscal measures, including at the European Union level, would help to shield the economy. Fiscal policies need to remain agile as the situation evolves. A willingness to employ fiscal policies is not inconsistent with the need for a credible path towards reducing budgetary imbalances over the medium term.
According to the March 2022 ECB staff macroeconomic projections, the euro area general government budget balance is still improving, continuing along the path that started in 2021.[9] The general government deficit-to-GDP ratio for the euro area is estimated to have declined to 5.5% of GDP in 2021, after having reached an unprecedented 7.2% in 2020. It is projected to fall even more strongly to 3.1% of GDP in 2022 and then to 2.1% and 2.0%, respectively, in the subsequent two years (Chart 27). Following economic support measures in response to the COVID-19 pandemic of around 4.0% of GDP in 2020, crisis and recovery support is estimated to have increased to about 4.3% of GDP in 2021. This reflects the fact that governments prolonged and gradually expanded the scale of emergency measures and/or adopted new ones to support the recovery, including the measures set out by countries in their national recovery and resilience plans under the NGEU.[10] The large negative cyclical component, which contributed to the large increase in the government deficit in 2020, is estimated to have started contributing less in 2021, albeit only moderately. The more significant improvement in the budget balance from 2022 onwards is projected to be driven by a higher cyclically adjusted primary balance, as a large share of the emergency measures not funded by NGEU grants will expire. Moreover, the negative contribution from the economic cycle is expected to fade swiftly as of 2022, turning slightly positive from 2023. The improvement in the budget balance will also be helped, albeit to a lesser extent, by somewhat lower interest payments than has been the case over the past few years. In the current projections, this effect refers mainly to 2022 and fades away over 2023-24.
Chart 27
Budget balance and its components
(percentages of GDP)

Sources: ECB and March 2022 ECB staff macroeconomic projections.
Note: The data refer to the aggregate general government sector of euro area countries.
The euro area aggregate fiscal stance is estimated to have tightened somewhat in 2021, following a very expansionary stance in 2020.[11] From still high levels of support after adjustment for revenues related to NGEU grants, a greater tightening of the fiscal stance is expected in 2022 as the fiscal support fades along with the expiry of pandemic and temporary support measures. In 2023 and 2024 the fiscal stance is projected to tighten only marginally.[12] Notwithstanding the fiscal tightening, the level of fiscal support to the economic recovery remains large over the whole projection horizon, which is reflected in the overall primary fiscal balance remaining firmly negative.
Compared with the December 2021 Eurosystem staff macroeconomic projections, the budget balance at the end of the projection horizon has been revised slightly downwards. The most significant annual revision concerns a more favourable budget balance estimate for 2021. Specifically, for 2021 the euro area general government budget balance as a share of GDP has been revised up by 0.5 percentage points to -5.5% of GDP, primarily on account of a higher-than-expected cyclically adjusted primary balance. Despite this improvement, the budget balance has been revised upwards only marginally by 0.1 percentage points for 2022, while it is left unchanged for 2023 and revised downwards by 0.2 percentage points for 2024. The downward revision of the budget balance at the end of the forecast horizon in the baseline stems from the deterioration in the macroeconomic outlook triggered by the Ukraine crisis and the upward revisions of interest payments as a share of GDP.
Following a large increase in 2020, the euro area government debt-to-GDP ratio is estimated to have declined slightly to around 96% in 2021 and is expected to shrink further to 89% in 2024. After an increase of close to 14 percentage points in the debt ratio in 2020, a falling but still high primary deficit in 2021 is estimated to have been more than offset by a significant debt-reducing contribution from the interest-growth differential. In 2022 and 2023 the debt ratio is projected to decline more quickly as debt-increasing primary deficits, although falling, are outweighed by favourable contributions from interest-growth differentials and, to a lesser extent, by negative deficit-debt adjustments (Chart 28). At the end of the projection horizon in 2024, the debt-to-GDP ratio is expected to fall to just below 89%, 5 percentage points above its pre-crisis level in 2019. Overall, the COVID-19 crisis has had a significantly smaller adverse impact on the euro area aggregate debt path than was generally expected in the initial phase of the crisis.[13]
Chart 28
Drivers of change in euro area government debt
(percentages of GDP, unless otherwise indicated)

Sources: ECB and March 2022 ECB staff macroeconomic projections.
Note: The data refer to the aggregate general government sector of euro area countries.
Risks to this fiscal baseline are, however, substantial and increasingly tilted towards larger budget deficits. The main uncertainty relates to the macroeconomic effects of the war in Ukraine and potential additional fiscal stimulus in the euro area. Such stimulus would mainly come from three sources: (i) additional support in response to high energy prices; (ii) higher defence spending; and (iii) increased spending on refugees. Furthermore, fiscal risks related to further waves of the COVID-19 pandemic cannot be ruled out.
National fiscal policies should remain agile as the situation evolves, while remaining attentive to medium-term fiscal sustainability. In the light of high risks currently emanating from multiple sources, which are in part already materialising, fiscal measures, including at the European Union level, would help to shield the economy. Fiscal policies need to remain agile as the situation evolves. A decisive shift towards a more growth-friendly composition of public finances and structural reforms that raise the growth potential of euro area economies would create additional fiscal room for manoeuvre if needed, while also helping to reduce budgetary imbalances. A willingness to employ fiscal policies is not inconsistent with the need for a credible path towards reducing budgetary imbalances over the medium term.
Boxes
1 Supply chain bottlenecks in the euro area and the United States: where do we stand?
Strains in global supply chains of goods have been weighing on the global business cycle since late 2020. Supply chain bottlenecks stem from the interplay of several factors. First, the strong rebound in global demand for manufacturing goods, in part induced by the rotation of consumption away from services in the context of the pandemic-related containment measures, was not matched by an equal increase in the supply of goods. Second, some sectors have been hit by severe supply shortages, particularly of semiconductors, with supply struggling to accommodate the surge in demand for electronic products and equipment, and in the automotive sector, which is gradually recovering after a sharp drop in output in 2020. Finally, disruptions in the logistics industry – resulting primarily from container vessel activity, port congestion and strict lockdown measures in some key Asian countries that produce intermediate inputs – further exacerbated supply bottlenecks.[14]
See more2 The role of credit risk in recent global corporate bond valuations
Corporate vulnerabilities increased particularly strongly around the world at the onset of the coronavirus (COVID-19) pandemic and – despite the subsequent recovery – could still be a cause for concern in some parts of the market. Vulnerabilities increased markedly, with firms around the world experiencing a wave of credit rating downgrades (Chart A, panel a). In the course of 2021, corporate credit quality (as assessed by credit rating agencies) recovered somewhat, with US firms, for instance, seeing more upgrades than downgrades. However, credit ratings have not yet fully returned to pre-pandemic levels, as there is uncertainty about longer-term prospects in some sectors – particularly those that have been more affected by the pandemic. Moreover, while earnings per share have increased on average, the ongoing pandemic has had a scarring effect, leaving some firms with weaker earnings, despite public support measures (see, for example, panel b of Chart A, which looks at firms in the S&P 500).
See more3 Liquidity conditions and monetary policy operations from 3 November 2021 to 8 February 2022
This box describes the ECB’s monetary policy operations and liquidity developments during the seventh and eighth reserve maintenance periods of 2021. Together, these two maintenance periods ran from 3 November 2021 to 8 February 2022 (the “review period”).
See more4 Corporate saving ratios during the pandemic
This box takes stock of the evolution of the saving ratios of non-financial corporations in the euro area and in the largest euro area countries during the pandemic. It focuses on corporate savings as part of the integrated euro area accounts. A distinction is made between savings including “consumption of fixed capital”, also known as depreciation expenses, and net savings, which are often referred to as retained earnings. Corporate saving is the part of entrepreneurial income that is not distributed as dividends to shareholders. Generally, firms accumulate savings because they help protect them in the event of a financial emergency, can be used to pay for operational as well as capital expenditures, help them to access external financing, reduce financial stress, and provide a greater sense of financial freedom. Savings are important as an internal source of funding for investment. The pecking order theory of corporate finance says that firms prioritise their sources of financing, with a preference for internal financing, then debt, and equity as a last resort.[16] In addition, having a high saving ratio can make it easier for firms to borrow funds, to the extent that it suggests a firm pursues sound balance sheet management and has good business prospects. If high savings are sustained over time, however, they may also signal a lack of productive investment opportunities or unwillingness to take business risks.[17]
See more5 The role of the inventory cycle in the current recovery
The inventory cycle is generally procyclical, with changes in inventories being a notoriously volatile expenditure component of GDP. This box reviews the impact of inventories and their drivers on euro area activity in the current economic recovery. The inventory cycle correlates strongly and positively with activity. Over the past two decades it has made contributions ranging from +1.0 percentage point to ‑1.5 percentage points to year-on-year euro area GDP growth rates, with particularly large fluctuations seen in crisis periods (Chart A). The economic interpretation of inventory dynamics is challenging for two main reasons. First, inventory contributions to GDP growth reflect changes in the speed of stockbuilding, i.e. whether there is an acceleration or deceleration.[18] Therefore, inventories can make a positive contribution to growth if the pace of destocking (i.e. reduction of inventories) merely slows down; it does not require actual stockbuilding to take place. Second, stockbuilding not only captures developments in several categories of inventories, which can offset each other in aggregate terms, but it also includes discrepancies (a “residual” component) and the net acquisition of valuables. The dynamics in these two elements are often unrelated to the business cycle.[19]
See more6 The labour market recovery in the euro area through the lens of the ECB Consumer Expectations Survey
This box analyses the current labour market recovery using data from the ECB Consumer Expectations Survey (CES).[20] The CES offers new insights into the euro area labour market.[21] Respondents provide information about their employment status, job searches, expectations regarding employment and earnings, their level of job satisfaction and how well their skills match their job. Some of this information is not available from the official EU labour market statistics and, for the main labour market aggregates, the CES provides more timely data. Thus, the CES data are a useful complement to the official EU data. This box uses these data to shed light on the current recovery in the euro area labour market.
See more7 Which sub-components are driving owner-occupied housing costs?
In January 2022, Eurostat began publishing official euro area aggregates as part of its Owner-Occupied Housing Price Index (OOHPI). This box looks at the various sub-components of that index and provides details of their correlation with other price indicators.
See moreArticles
1 Financial risks in China’s corporate sector: real estate and beyond
Recent tensions in China’s real estate market have highlighted the risks inherent in the country’s highly leveraged corporate sector. These risks have been building up for some time, as high investment rates have coincided with high levels of debt accumulation. Moreover, the source of debt has moved beyond the traditional banking sector, with non-bank financial institutions providing financing which is less stable and more susceptible to sudden changes in investor sentiment. In addition, tensions in large corporate sectors could be transmitted to the rest of the economy through a number of channels. These channels include households, which are themselves increasingly leveraged and whose wealth is significantly exposed to the real estate market. A wider Chinese growth slowdown could, in turn, have global repercussions, given the size of the Chinese economy, its important global trade linkages and the central role it plays in international commodity markets. Against this backdrop, this article will review the rise in financial risks in China’s economy stemming from increasing private sector leverage, the interconnectedness between the financial and non-bank financial sectors, and households’ rising debt exposures.
See more2 Assessing corporate vulnerabilities in the euro area
The coronavirus (COVID-19) crisis was a major shock for the non-financial corporate (NFC) sector. The pandemic and the associated containment measures translated into a large drop in sales for firms. The rapid pace of the decline in revenue in conjunction with the difficultly of adjusting costs sufficiently quickly led to a sudden increase in liquidity needs. These liquidity needs, if left unaddressed, could have easily morphed into broader solvency issues, leading to a sharp increase in corporate defaults and bankruptcies.
See moreStatistics
Statistical annex© European Central Bank, 2022
Postal address 60640 Frankfurt am Main, Germany
Telephone +49 69 1344 0
Website www.ecb.europa.eu
All rights reserved. Reproduction for educational and non-commercial purposes is permitted provided that the source is acknowledged.
This Bulletin was produced under the responsibility of the Executive Board of the ECB. Translations are prepared and published by the national central banks.
The cut-off date for the statistics included in this issue was 9 March 2022.
For specific terminology please refer to the ECB glossary (available in English only).
ISSN 2363-3417 (html)
ISSN 2363-3417 (pdf)
QB-BP-22-002-EN-Q (html)
QB-BP-22-002-EN-N (pdf)
- See Box 1 in this issue of the Economic Bulletin.
- While sanctions have not directly targeted the energy sector so far, some supply disruption has likely already occurred. This is because firms are increasingly reluctant to buy Russian oil, major companies are divesting Russian oil assets, and banks and insurance companies are increasingly unwilling to finance and insure Russian commodities trade.
- From the week ending 17 December 2021 to the week ending 4 March 2022.
- See the article entitled “ECB staff macroeconomic projections for the euro area, March 2022”, published on the ECB’s website on 10 March 2022.
- See the box entitled “COVID-19 and the increase in household savings: an update”, Economic Bulletin, Issue 5, ECB, 2021.
- See the box entitled “The heterogeneous economic impact of the pandemic across euro area countries”, Economic Bulletin, Issue 5, ECB, 2021.
- See the box entitled “Supply chain bottlenecks in the euro area and the United States: where do we stand?” in this issue of the Economic Bulletin.
- The cost of financing is calculated as a weighted average of the cost of equity, the cost of market-based debt and the cost of short and long-term borrowing from banks. The weights represent the share of each of the financing instruments in total outstanding external financing instruments of NFCs. Hence, the contribution of each component to the level of the overall cost of financing at any point in time is the cost (as a percentage) multiplied by its weight. The weights are updated regularly to account for changes in the NFC financing structure. The change in the contribution of a particular component to the change in the overall cost of financing is, therefore, the net result of the change in the cost and the change in the weight.
- See the “ECB staff macroeconomic projections for the euro area, March 2022”, published on the ECB’s website on 11 March 2021.
- NGEU grants amount to around 0.5% of GDP, on average, over the projection horizon, declining gradually after 2022. Together with a limited amount of loans, they are assumed to finance budget spending of 2.5% of GDP. The fiscal developments described in this section do not include the European supranational deficit and debt related to NGEU transfers.
- The fiscal stance reflects the direction and size of the stimulus from fiscal policies to the economy beyond the automatic reaction of public finances to the business cycle. It is measured here as the change in the cyclically adjusted primary balance ratio net of government support to the financial sector. Given that the higher budget revenues related to NGEU grants from the EU budget do not have a contractionary impact on demand, the cyclically adjusted primary balance is in this context adjusted to exclude those revenues. For more details on the concept of the euro area fiscal stance, see the article entitled “The euro area fiscal stance”, Economic Bulletin, Issue 4, ECB, 2016.
- The euro area aggregate fiscal stance was -4.2 percentage points of GDP in 2020 and is estimated to have been +0.5 percentage points of GDP in 2021. It is projected to stand at +0.9, +0.2 and +0.1 percentage points of GDP in 2022, 2023 and 2024 respectively, after adjustment for revenues related to NGEU grants.
- For instance, in the June 2020 Eurosystem staff macroeconomic projections, the debt-to-GDP level at the end of 2022 was projected to be about 8 percentage points higher than in the current projections.
- For a detailed analysis of these factors and their economic impact, see Lane, P.R., “Bottlenecks and monetary policy”, The ECB Blog, ECB, 10 February 2022, and the following boxes entitled: “What is driving the recent surge in shipping costs?”, Economic Bulletin, Issue 3, ECB, 2021; “The semiconductor shortage and its implication for euro area trade, production and prices”, Economic Bulletin, Issue 4, ECB, 2021; “The impact of supply bottlenecks on trade”, Economic Bulletin, Issue 6, ECB, 2021; and “Sources of supply chain disruptions and their impact on euro area manufacturing”, Economic Bulletin, Issue 8, ECB, 2021.
- Tatjana Schulze contributed to this box during her traineeship at the European Central Bank.
- For empirical evidence that the availability of internal sources of finance matters significantly for aggregate business investment in the euro area and the United States, see de Bondt, G. and Diron, M., “Investment, financing constraints and profit expectations: new macro evidence”, Applied Economics Letters, Vol. 15(8), 2008, p. 577-581. For panel evidence based on 47 countries that higher business saving is linked significantly to higher business investment, see Bebczuk, R. and Cavallo, E., “Is business saving really none of our business?”, Applied Economics, Vol. 48(24), 2016, p. 2266-2284. This study concludes that business savings and external financing are complementary sources of financing for investment.
- For example, excessive corporate savings in Japan have been linked to a lack of growth opportunities and poor corporate governance. See, for example, Tong, J. and Bremer, M., “Stock repurchases in Japan: A solution to excessive corporate saving?”, Journal of the Japanese and International Economies, Vol. 41(C), 2016, pp. 41-56; Aoyagi, C. and Ganelli, G., “Unstash the Cash! Corporate Governance Reform in Japan”, Journal of Banking and Financial Economics, Vol. 1(7), University of Warsaw, Faculty of Management, 2017, pp. 51-69; Sun, Z. and Wang, Y., “Corporate precautionary savings: Evidence from the recent financial crisis”, Quarterly Review of Economics and Finance, Vol. 56(C), 2015, pp. 175-186; and Dudley, E. and Zhang, N., ”Trust and corporate cash holdings”, Journal of Corporate Finance, Vol. 41(C), 2016, pp. 363-387.
- This is because production that is not sold in the accounting period in which it is made increases inventories in that period; hence it is the change in inventories that enters the “accounting identity” that links GDP and its expenditure components. See the box entitled “Stockbuilding – theoretical considerations and recent developments”, Monthly Bulletin, ECB, May 2012.
- Discrepancies occur because inventories often play a prominent role in the balancing process of national accounts and thus contain a large “residual” component, owing to the lack of actual or reliable source data on inventories at a quarterly frequency. Valuables comprise, for instance, precious metals and art objects and constitute a small share of inventories.
- More detail on the CES is available in “ECB Consumer Expectations Survey: an overview and first evaluation”, Occasional Paper Series, No 287, ECB, December 2021.
- The dataset covers six euro area countries: Belgium, Germany, Spain, France, Italy and the Netherlands.