


Published as part of the ECB Economic Bulletin, Issue 4/2022.
The war in Ukraine has generated a sharp increase in energy prices and significant volatility in energy markets. Amid fears of disruptions to energy supplies and increasingly strict sanctions on the Russian energy sector, prices have fluctuated, in particular as markets have tried to assess the potential implications for global energy supplies. Given their heavy reliance on Russian supplies before the invasion, euro area energy markets have been especially affected. This box provides an overview of the impact that the war in Ukraine has had on euro area energy markets so far. It outlines Russia’s role in the euro area’s energy supply and looks at measures that have influenced prices. In this context, it also discusses the implications for euro area energy commodity and consumer prices.
Oil, coal and gas prices spiked in the immediate aftermath of Russia’s invasion of Ukraine and have been volatile ever since. Energy commodity price volatility began mounting in December 2021 when reports of a potential Russian invasion of Ukraine increased. In the first two weeks after the invasion, the prices of oil, coal and gas went up by around 40%, 130% and 180% respectively (Chart A). Gas prices also drove up wholesale electricity prices in the euro area. Since then energy commodity prices have moderated, with oil and coal prices standing 27% and 50% respectively above their levels before the invasion, while gas prices are 11% lower than before the invasion. Oil prices have recently started to increase again, reflecting the EU’s agreement to embargo most Russian oil imports and the higher global demand for oil owing to China’s easing of COVID-19 restrictions. Wholesale electricity prices are 8% higher than before the invasion but have remained very volatile, affected in particular by policy measures taken in response to the price increases.
Chart A
Energy prices before and after the invasion of Ukraine
Energy prices
(index: 23 February 2022 = 100)
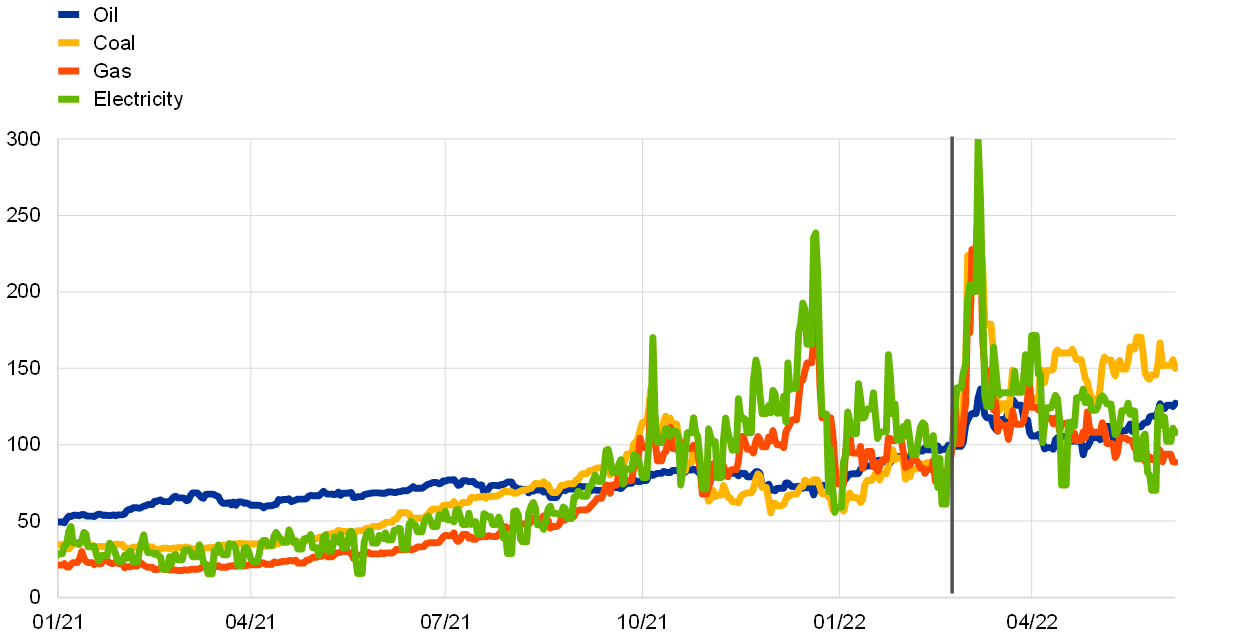
Sources: Refinitiv, Bloomberg and ECB staff calculations.
Notes: Oil prices are Brent crude oil prices, gas prices are the Dutch Title Transfer Facility day-ahead prices and coal prices are the nearby Rotterdam Coal Futures prices. Wholesale electricity prices for the euro area were calculated as a weighted average (applying net electricity generation as weights) of prices observed in the five biggest markets. The vertical line marks the start of the Russian invasion of Ukraine. The latest observations are for 7 June 2022.
Strains on energy supplies from Russia may affect the euro area via both world market prices and direct supplies. In 2019 Russia’s energy production accounted for 12% of the global supply of oil, 5% of coal and 16% of gas. In 2021 the country was the largest supplier of energy commodities to the euro area, constituting 23% of total energy imports (Chart B, panel a). Russia accounted for 23% and 43% of euro area crude oil and coal imports respectively in 2020, which represented 9% and 2% of the euro area’s primary energy consumption. However, the euro area is particularly dependent on natural gas imports from Russia, which in 2020 amounted to 35% of euro area gas imports and represented 11% of the euro area’s primary energy consumption (Chart B, panel b).[1] Germany and Italy have the highest dependence on Russian gas among the large euro area countries. The degree of substitutability of these energy sources is relevant to any analysis of the economic implications of the war for energy prices and euro area supplies.
Chart B
Russia’s share in euro area energy and gas imports
a) Energy imports by source country
(percentages)
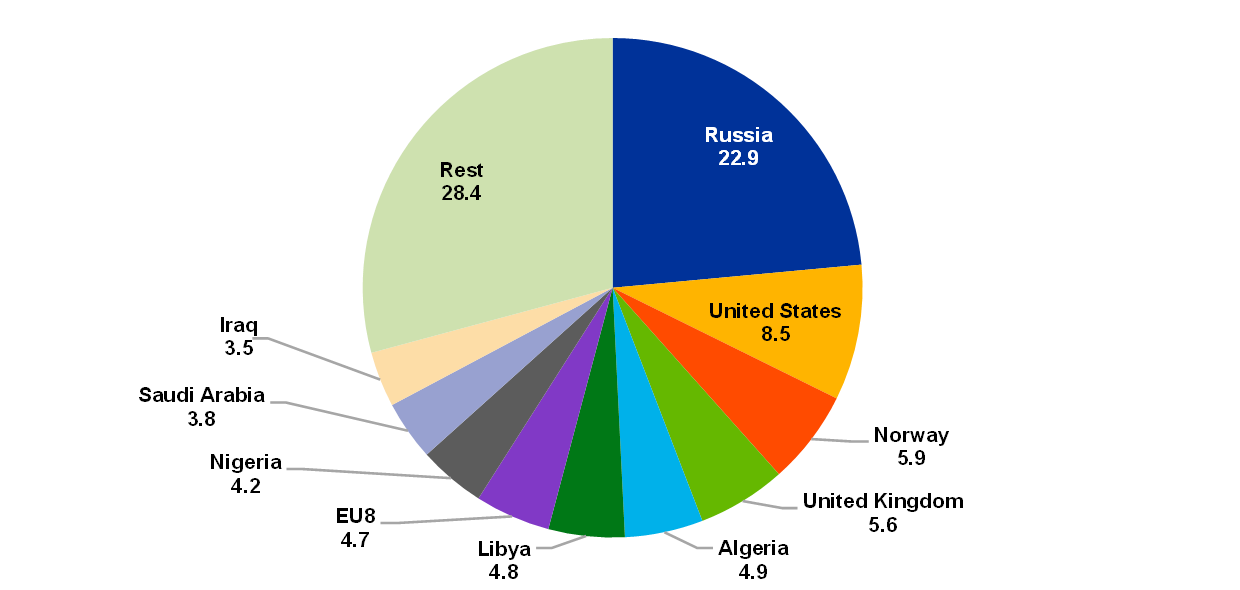
b) Share of gas imports in primary energy consumption*
(percentages)

Sources: Eurostat and ECB calculations.
Notes: Imports from other countries include imports from Algeria, Libya and Azerbaijan. EU8 refers to the Czech Republic, Estonia, Latvia, Lithuania, Hungary, Poland, Slovenia and Slovakia. Liquefied natural gas excludes imports from Russia, Norway and other countries. *adjusted for re-exports. The latest observations are for 2021 for panel a) and 2020 for panel b).
The European Union introduced economic sanctions targeting the Russian energy industry, most notably the coal and oil sectors. The sanctions also include a ban on EU exports of goods and cutting-edge technology used to develop the Russian oil and gas sectors. Moreover, the EU has prohibited the import of Russian coal as of August 2022. At the special meeting of the European Council at the end of May, it was decided to stop most Russian oil imports. The agreements foresee a ban on all seaborne oil shipments from Russia by the end of the year, with a temporary exemption for crude oil delivered via pipeline. While seaborne oil accounts for around two-thirds of total imports of oil from Russia, the embargo is expected to effectively encompass around 90% of oil imports from Russia, as Germany and Poland are reported to have pledged to stop importing pipeline oil.[2] Immediately after Russia’s invasion of Ukraine, European companies started “self-sanctioning”; energy, shipping and insurance companies cut ties with the Russian energy sector, leading to a 23% drop in shipments of Russian oil to Europe in March. Russia has been able to redirect oil exports to other destinations such as India, but signs of significant, persistent reductions in Russian oil production are emerging, with the Russian oil supply projected to fall by 25% in the second half of 2022 relative to the beginning of the year (Chart C, panel a).[3] Continued low Russian production levels are pointing to increased tightness in the global oil market, unless other main producers speed up production.[4] This would result in downward revisions to global oil supply forecasts for the rest of the year of around 3% since the start of the invasion (Chart C, panel b).
Chart C
Downward revisions to oil supply forecasts
a) Russian oil supply
(million barrels per day)

b) Global oil supply
(million barrels per day)
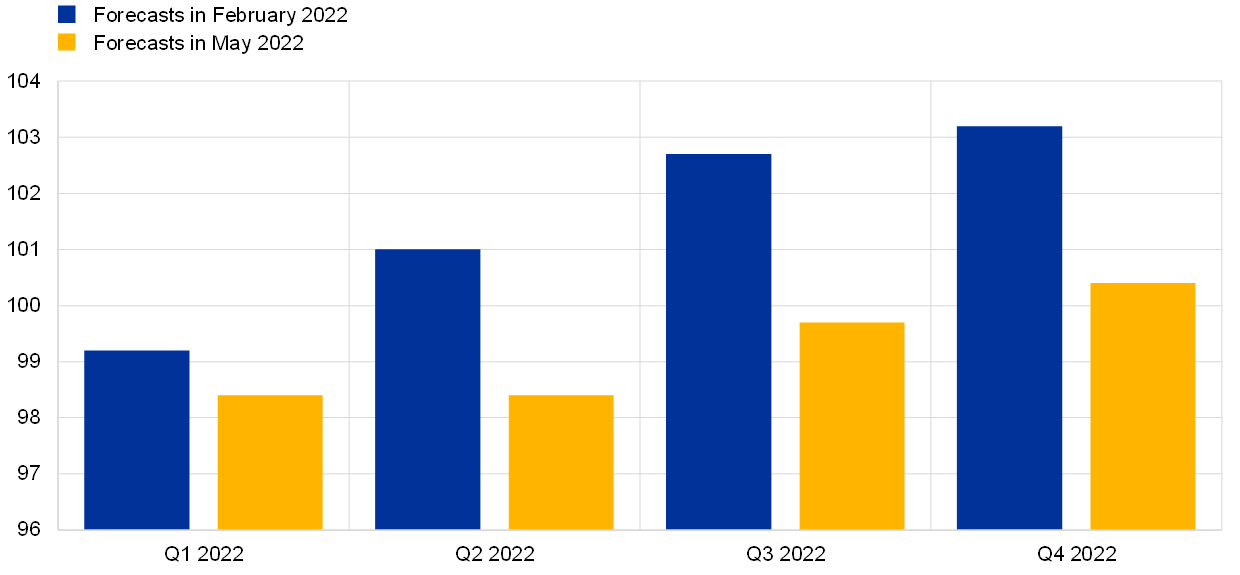
Source: International Energy Agency (IEA).
Note: Estimates are from the IEA’s monthly Oil Market Reports.
The EU has taken steps towards independence from Russian gas. While the EU’s sanctions targeting Russian gas exports have been limited, the launch of the recently constructed Nord Stream 2 gas pipeline between Russia and Germany has been put off. The war in Ukraine appears to have had a relatively low impact on flows of Russian gas into the euro area thus far, but there are signs of higher risks to the euro area’s gas supply. The EU therefore aims to reduce dependence on Russian gas by nearly two-thirds by the end of 2022 (the “REPowerEU” plan[5]). It intends to substitute around one-third of Russian gas by stepping up liquefied natural gas imports from other suppliers such as the United States and Qatar. Another 6% of gas should come by pipeline from countries such as Norway. Compared with oil and coal, gas is the source of energy that is most difficult for some euro area countries to substitute, as the infrastructure required to access other suppliers is not yet in place. Countries such as Germany and Italy have therefore been working on establishing the necessary infrastructure by expanding regasification capacity, and have also secured gas deals with other substitute suppliers.[6] The efforts of EU countries to substitute Russian gas, combined with low demand owing to mild weather conditions, led to a sharp increase in European gas inventories, which helped to reduce prices. As an act of retaliation, through April and May 2022 Russia stopped delivering gas to Poland, Bulgaria, Finland, Denmark and the Netherlands, as they refused to comply with Russia’s demands for payments for gas deliveries to be made in roubles. In May 2022 Russia imposed sanctions on the Polish part of the Yamal-Europe pipeline, which transports gas to Germany, as well as on a German Gazprom unit, which the country’s energy network regulator took control of in April.
Other factors have also helped to rein in energy commodity prices somewhat. To mitigate the high risks that the war in Ukraine is posing to the global energy supply, the International Energy Agency (IEA) has announced plans for the largest releases of strategic oil reserves in its history.[7] Furthermore, China’s reintroduction of COVID-19 lockdowns at the start of 2022 initially put downward pressure on energy demand. However, more recently COVID-19 infection rates in the country have fallen significantly, and there are signs that economic activity improved in May, with global demand for oil increasing again.
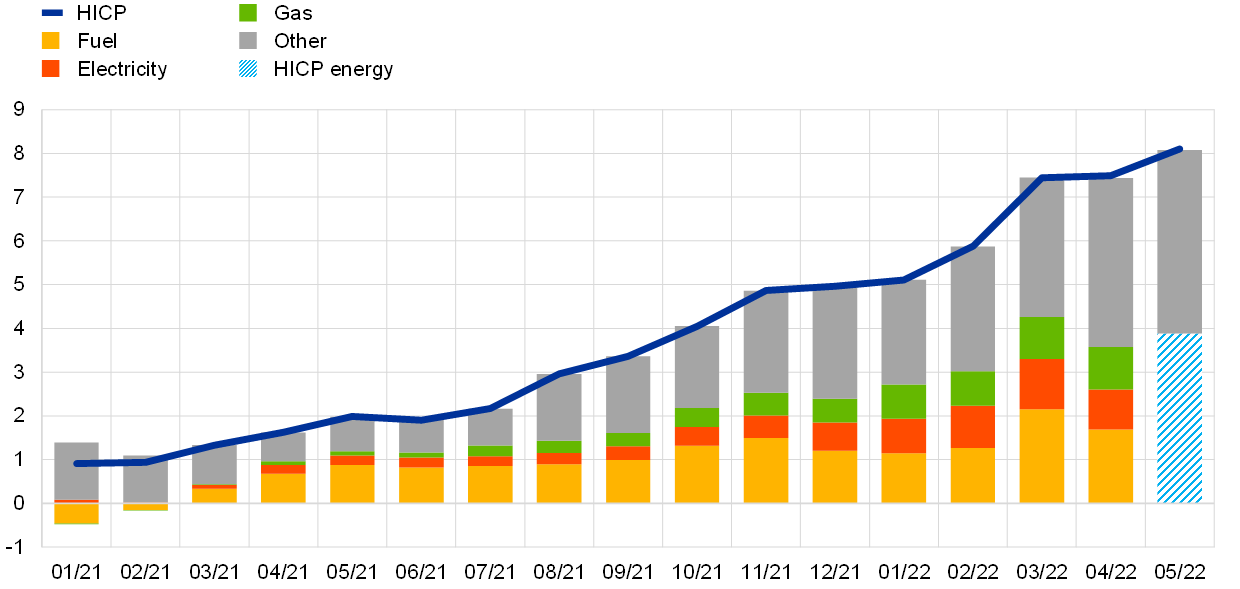
Higher energy commodity prices intensified the pressure on consumer energy prices in February and March 2022. HICP energy inflation rose to 32% in February and further to 44% in March, before dropping somewhat to 38% in April and 39% in May (Chart D, panel a).[8] The increases up to March reflected the strong month-on-month rise in all main energy components (liquid fuels, electricity and gas) on the back of the upsurge in global commodity markets and rising refining margins.[9]
Chart D
Rising HICP energy inflation curbed by government tax measures
a) Contribution of HICP energy components to overall developments in the HICP
(percentages; percentage point contributions)
b) Contribution of tax measures to reducing HICP energy inflation
(percentage points)

Sources: Eurostat and ECB calculations.
Notes: The impact of changes in indirect taxes is calculated as the difference between HICP energy inflation and HICP energy inflation at constant tax rates, assuming full and immediate pass-through of indirect taxes. The latest observations are for May 2022 for HICP energy inflation and fuel, and April 2022 for all other items.
HICP energy inflation remained high in April and May 2022, although pressures eased owing not only to the aforementioned developments in energy commodity prices, but also to governments’ mitigation measures. Many euro area governments have provided support to compensate households for high energy prices. Most of them also reduced excise duties and value added tax rates, which had a direct downward impact on consumer prices.[10] As a result of the changes to indirect taxes made in several countries from autumn 2021 alone, energy inflation was dampened by around 4.3 percentage points in March and 5.8 percentage points in April 2022 (Chart D, panel b).[11]
Natural gas is the second most important primary energy resource in the euro area, after petroleum-based products (see the box entitled “Natural gas dependence and risks to euro area activity”, Economic Bulletin, Issue 1, ECB, 2022).
After the invasion of Ukraine, the United States, the United Kingdom and Canada banned all imports of oil and gas from Russia. However, the EU is a significantly larger importer of Russian energy and its sanctions will have a greater effect on the Russian energy sector.
Production of crude oil dropped by around 1 million barrels per day to 10 million barrels per day in April.
On 2 June the OPEC+ group of oil-producing countries decided to accelerate oil production in July and August by almost 0.65 million barrels per day, up from planned increases of around 0.4 million barrels per day. This production increase is not large enough to compensate fully for Russian supply shortfalls.
The intention is for the EU to become completely independent of Russian fossil fuels well before 2030 by following a set of initiatives such as diversifying fossil fuel supplies, saving energy, expediting the roll-out of renewable energy and replacing fossil fuels in heating and power generation.
Since Russia’s invasion of Ukraine, a small fraction of gas imports has been substituted by increased imports from other suppliers such as Norway. Germany has reduced its gas imports from Russia, down from 55% to 45%, and aims to become almost independent by 2024. Italy has announced it will phase out Russian imports completely by the end of 2024, buying from other suppliers such as Algeria. Estonia, Latvia and Lithuania have also stopped importing Russian gas as part of European efforts to curb reliance on Russian energy.
In March the IEA announced a strategic release of 60 million barrels in total from their reserves, with the United States supplying 50% of the release. This was followed by a second announcement in April that 1.3 million barrels per day would be released over six months, with 1 million barrels per day coming from the United States.
The contribution of liquid fuels, electricity and gas was 22, 12 and 10 percentage points respectively in March and 17, 9 and 10 percentage points in April.
Wholesale electricity prices in Europe are strongly influenced by the price of natural gas, with gas-fired electricity generation often being the marginal technology that sets wholesale electricity prices. See also the article entitled “Energy price developments in and out of the COVID-19 pandemic – from commodity prices to consumer prices” in this issue of the Economic Bulletin.
Other measures implemented include transfers (e.g. for low income households) or price caps on the wholesale market. These are not directly reflected in the HICP.
For an illustration of how taxes and levies contribute to overall energy price levels please see the article entitled “Energy price developments in and out of the COVID-19 pandemic – from commodity prices to consumer prices” in this issue of the Economic Bulletin.