

- SPEECH
Inflation in the euro area
Speech by Philip R. Lane, Member of the Executive Board of the ECB, at the Institute of International and European Affairs, Dublin
Dublin, 27 May 2024
Introduction
The aim of this speech is to examine inflation in the euro area. In the next section, I review the various inflation indicators tracked by the ECB.[1] Subsequently, I discuss the implications for monetary policy.
Overview of Inflation Indicators
Chart 1 shows the evolution of headline and core inflation since 2019. Let me focus on the disinflation patterns since August 2023 (the month immediately prior to our last rate hike at our September monetary policy meeting). Inflation declined from 5.2 per cent last August to 2.4 percent in April, while core inflation decreased from 5.3 per cent in August to 2.7 per cent in April.
Chart 1
Headline inflation and core inflation
(annual percentage changes)

Sources: Eurostat.
Notes: HICP refers to headline inflation and HICPX to HICP excluding food and energy. The latest observation are for April 2024.
Chart 2 shows the relative contributions of the major categories: energy; food; goods; and services. Services inflation now accounts for the vast bulk of the overall inflation rate. In turn, this reflects the non-uniform dynamics: while the other categories have seen major declines, with the April data indicating energy inflation running at -0.6 per cent, food inflation at 2.8 per cent and goods inflation at 0.9 per cent, services inflation was still elevated at 3.7 per cent.
Chart 2
HICP decomposition
(annual percentage changes and percentage point contributions)

Sources: Eurostat and ECB staff calculations.
Notes: Goods refers to non-energy industrial goods. The latest observations are for April 2024.
Chart 3 shows the evolution of the refined versions of the underlying inflation measures tracked by the ECB, which adjust for the temporary impact of energy shocks and supply bottlenecks.[2] The improvements in these measures since August 2023 suggest that the observed disinflation has a substantial persistent component.
Chart 3
Adjusted measures of underlying inflation
(annual percentage changes
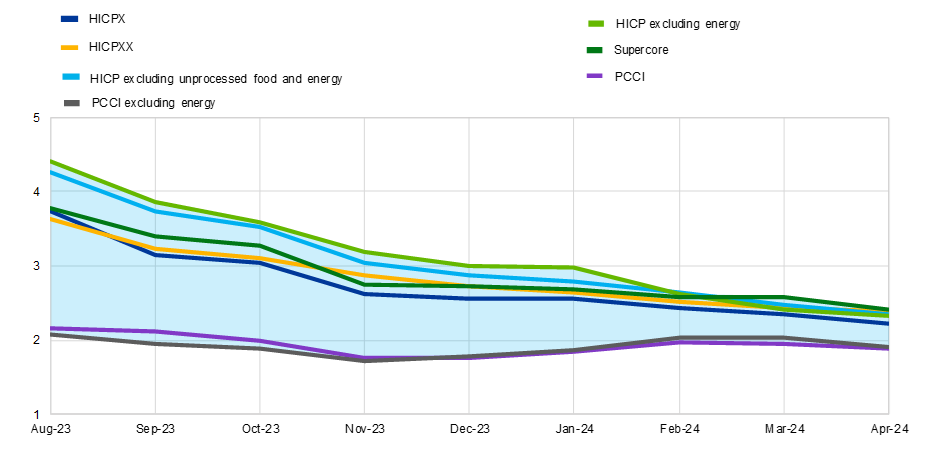
Sources: Eurostat and ECB staff calculations.
Notes: HICP refers to headline inflation, HICPX to HICP excluding food and energy, HICPXX to HICP excluding food, energy, travel-related items and clothing, and PCCI to the Persistent and Common Component of Inflation. The “adjusted” measures abstract from energy and global supply bottleneck shocks using a large structural vector autoregression (SVAR) model S as explained in Bańbura, M., Bobeica, E. and Martínez Hernández, C. (2023), “What drives core inflation? The role of supply shocks”, Working Paper Series, No 2875, ECB. The latest observations are for April 2024.
While Chart 3 reports broad measures of underlying inflation, Chart 4 examines the domestic inflation rate, which is aggregated across sectors with low import content. The focus on this measure is motivated by the higher sensitivity of domestic inflation to local cost pressures. Although domestic inflation remains quite elevated, the exclusion-type indicators (weighted median and trimmed measures) suggest that the breadth of the domestic inflation dynamic is narrowing.
Chart 4
Domestic inflation
(annual percentage changes)
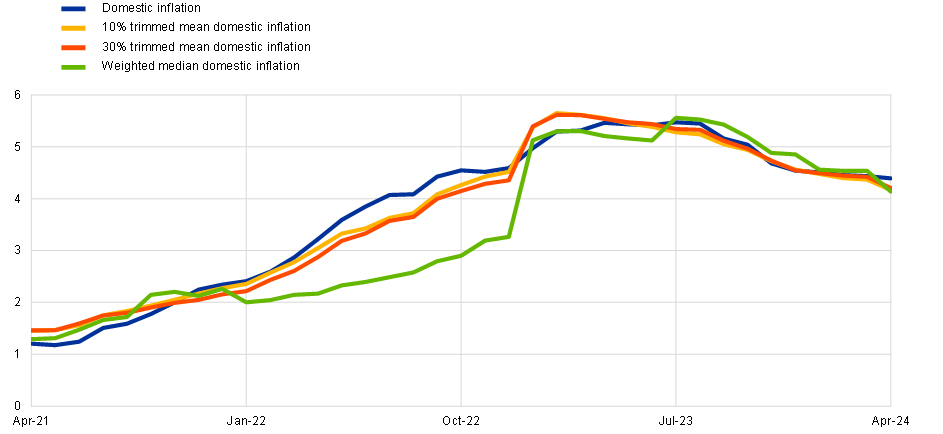
Sources: Eurostat and ECB staff calculations.
Notes: Domestic inflation is an aggregate of HICP items with a relatively low import intensity, as explained in Fröhling, A., O’Brien, D. and Schaefer, S. (2022), “A new indicator of domestic inflation for the euro area”, Economic Bulletin, Issue 4, ECB. The latest observations are for April 2024.
In a similar vein, Chart 5 shows services inflation. In April, services inflation declined slightly to 3.7 per cent. The decline in services inflation since last summer has largely been in non-labour-intensive services sectors, reflecting the indirect impact of lower energy prices, the easing of supply bottlenecks and the fading out of pandemic reopening effects in these sectors. As shown in Chart 5, there is a relatively tight medium-term relation between wage inflation and the inflation rate for labour-intensive services sectors (which make up a large part of the domestic inflation component). Over time, deceleration in wage growth is necessary in order for services inflation to converge to a rate that is consistent with meeting the two per cent target for overall inflation.[3]
Chart 5
Services inflation developments
(annual percentage changes)

Sources: Eurostat and ECB calculations.
Note: Latest observations are for the fourth quarter of 2023 for compensation per employee and April 2024 for the rest.
In relation to wage dynamics, Chart 6 shows the evolution of compensation per employee and compensation per hour until Q4 2023 and negotiated wages until Q1 2024, while Chart 7 shows a set of wage trackers.[4] The ECB wage tracker – an important tool used to assess wage developments across the euro area – is signalling that overall wage pressures have moderated since 2023.[5] Furthermore, the Indeed wage tracker – which reflects the wages offered in job postings and thereby should be a leading indicator for overall wage dynamics – has materially decelerated in recent months.[6]
At the same time, wage growth is expected to remain elevated in 2024, and to show a bumpy profile. These developments reflect the staggered nature of the wage adjustment process as workers continue to recoup real wage losses from past price shocks, as well as the important role of one-off payments in this process. Such one-off payments are also behind the increase in euro area negotiated wage growth in the first quarter. Similarly, one-off payments likely played a significant role in the increase in the growth rate of the “wages and salaries” component in the experimental flash release for Eurostat’s labour cost index (LCI) for Q1 2024, which jumped to 5.0 per cent from 3.2 per cent in Q4 2023.
The impact of higher wages on price pressures depends on the rate of labour productivity growth. In 2023, labour productivity fell, such that unit labour costs grew more quickly than wages. Preliminary data for the first quarter of 2024 suggest that aggregate labour productivity was constant; given the strongly pro-cyclical behaviour of labour productivity, the March staff projections foresee labour productivity growing at 0.1 per cent in 2024, 1.2 per cent in 2025 and 1.2 per cent in 2026 due to the output recovery outpacing employment growth.[7] Under this baseline, unit labour costs will grow more slowly than nominal wages.
In addition to a slower rate of growth of labour costs, deceleration in domestic inflation also requires compression in profits. The annual growth in unit profits peaked at 9.4 per cent in the last quarter of 2022 and stood at 2.5 per cent in the fourth quarter of 2023. The March projections exercise foresees unit profit growth turning negative in 2024, implying that profits will buffer the relatively strong labour cost growth. Unit profit growth is then expected to recover somewhat from 2025, helped by a robust economic recovery and strengthening productivity growth.
Chart 6
Labour cost indicators
(annual percentage changes)

Sources: Eurostat and ECB calculations.
Notes: Compensation per employee and per hour are calculated from calendar and seasonally adjusted data. The latest observations are for the first quarter of 2024 for negotiated wages and the fourth quarter of 2023 for the rest.
Chart 7
Wage trackers
(annual percentage changes)

Sources: ECB, national central banks, Central Bank of Ireland and the Dutch employers’ association (AWVN).
Notes: Euro area aggregate based on Germany, France, Italy, Spain, the Netherlands, Austria and Greece. The indicator "ECB wage tracker – average of agreements signed in last quarter including one-offs" displays the average growth rate of contracts signed in a given quarter in the first four quarters after signing. One-off payments are spread over the 12 months from the disbursement date. The latest observations are March 2024 for ECB wage trackers and April 2024 for Indeed Wage Tracker.
As shown in Charts 8 and 9, feedback from firms participating in the Corporate Telephone Survey (CTS) and the Survey on the access to finance of enterprises (SAFE) points to lower wage growth this year. The March 2024 staff projections foresee subsequent phases of further wage deceleration in 2025 and 2026, with the growth rate of compensation per employee declining from 5.3 per cent in 2023 to 4.5 per cent in 2024, 3.6 per cent in 2025 and 3.0 per cent in 2026.
Chart 8
CTS wage expectations
(number of responses)

Sources: April 2024 Corporate Telephone Survey (CTS) and ECB calculations.
Note: 54 responses for 2023 and 53 responses for 2024.
Chart 9
SAFE wage expectations one year ahead
(percentage changes over the next 12 months)

Sources: Survey on the access to finance of enterprises (SAFE) and ECB calculations.
Notes: Survey-weighted mean euro area firm expectations of changes in wages of current employees. Computed after trimming at the wave-country-specific 1st and 99th percentiles – all enterprises. The latest observations are for March 2024.
Finally, Chart 10 shows some forecasts of near-term inflation dynamics for the rest of 2024. Due to the swings in energy prices during 2023, there will be oscillations in base effects in the monthly inflation readings during 2024, while the staggered reversal of various temporary fiscal supports will also have uneven effects on price levels. Both headline inflation and core inflation are expected to fluctuate around current levels for the rest of the year.
Chart 10
Short-term forecasts for HICP (left panel) and HICPX (right panel)
(annual percentage changes)

Sources: Eurostat, March 2024 ECB staff macroeconomic projections for the euro area, Consensus Economics, Bloomberg and ECB calculations.
Notes: The cut-off date is 23 May 2024 for the regression forest and for fixings. Consensus Economics data were collected on 13 May 2024. The quantile regression forest estimates are from Lenza, M., Moutachaker, I. and Paredes, J. (2023), “Density forecasts of inflation: a quantile regression forest approach”, Working Paper Series, No 2830, ECB. The HICP fixings are observed market prices. The HICPX fixings are estimated on the basis of the model in Grønlund, A.M., Jørgensen, K. and Schupp, F. (2024), “Measuring market-based core inflation expectations”, Working Paper Series, No 2908, ECB. April 2024 observation for HICP/HICPX is actual data.
Even if inflation does not smoothly decline during the rest of 2024, further disinflation can be expected in the course of 2025. This next phase of disinflation should be underpinned by the lowering of labour cost pressures, ongoing compression of unit profits, the dissipation of the adverse effects of past energy shocks, supply bottlenecks and the pandemic reopening, and the further unfolding of the disinflationary impact of the restrictive monetary policy stance. This disinflationary dynamic is consistent with both inflation stabilising at our target later in 2025 and a substantial economic recovery. The latter will be supported by rising real incomes, improvements in the terms of trade and the prospect of disinflation unlocking future interest rate reductions and boosting domestic consumption and investment, while the normalisation of foreign demand will facilitate growth in exports. The sustainable attainment of the medium-term inflation target would be difficult in the absence of sufficient growth to foster the demand conditions that would be aligned with an overall inflation rate of two per cent.
Finally, it is essential to track the evolution of inflation risk, in addition to indicators of the expected inflation path. The lowering of perceived inflation risk since last summer is plausibly connected to the faster-than-expected decline in inflation (even if this has somewhat reversed in the initial months of 2024): the September 2023 staff projections pencilled in 2024 inflation at 3.2 per cent, while the March projections revised 2024 inflation down to 2.3 per cent. Since last summer, a range of measures show that near-term inflation expectations have also come down and that the risk of inflation staying above target in the long term has diminished: the right tail in the distribution of long-term inflation expectations in the Survey of Professional Forecasters has markedly diminished compared to the peak inflation phase in late 2022; the inflation risk premium embedded in five-year-on-five-year inflation swaps has declined by about 40 basis points since last summer; the option-implied probability of above 2.5 per cent inflation in the five-year-on-five-year interval has dropped, while the option-implied probability of below 1.5 per cent inflation has picked up; to the Consumer Expectations Survey, households have recognised the improvement in inflation outcomes and marked down their near-term inflation expectations; according to the results from the SAFE, firms have lowered their near-term inflation expectations, while the proportion of firms fearing high inflation in the medium term has decreased.[8]
Implications for monetary policy
The role of monetary policy in the disinflation process has been to ensure that the large inflation shocks did not translate into an increase in the medium-term inflation trend through medium-term inflation expectations shifting above our two per cent target. This has required a substantial adjustment in monetary policy for two reasons: first, in the normalisation phase, to avoid that excessively-low nominal interest rates would pro-cyclically add to the initial inflation shock; and, second, in the restrictiveness phase, to make sure that demand conditions are dampened, so as to ensure that the multi-round adjustment process for prices and wages is consistent with a timely return of inflation to the two per cent target.
Put differently, the aim of a restrictive monetary policy stance is to limit the persistence of backward-looking inflation dynamics and steer forward-looking inflation dynamics towards the medium-term anchor. While backward-looking inflation dynamics continue to play out (especially in relation to domestic/services inflation), these should continue to ease over the next year due to several factors: (a) with significant progress in 2023 and 2024 in reversing the real wage gap that was generated by the 2021-2022 inflation surge, wage growth should be lower in 2025 than in 2024; (b) with 2024 inflation lower than 2023 inflation, there will be less catch-up pressure from post-shock inflation on prices and wages in 2025; (c) the upward impact from the reversal of fiscal measures and energy base effects will be less relevant in 2025 than in 2024; and (d) the lagged impact of monetary policy tightening will still be contributing significantly to disinflation dynamics during 2025. With forward-looking inflation expectations well anchored, the dissipation of the backward-looking component will underpin the convergence in inflation towards the target.
At our June meeting, if our updated assessment of the inflation outlook, the dynamics of underlying inflation and the strength of monetary policy transmission were to further increase our confidence that inflation is converging to our target in a sustained manner, it would be appropriate to reduce the current level of monetary policy restriction. Among other considerations, the subsequent pace of rate cuts will be slower if there are upward surprises to underlying inflation (especially in relation to the underlying dynamics of domestic inflation and services inflation) and the level of demand (in view of the implications of demand conditions for the medium-term inflation outlook) and will be faster if there are downward surprises to underlying inflation and the level of demand.[9]
The future rate path will also depend on the evolving strength of monetary transmission. First, given the lags in transmission, the tightening effects from our past interest rate hikes are still unfolding. While the impact of the tightening cycle on economic activity might have reached its maximum level at the turn of this year, model-based analysis suggests that the bulk of the impact on inflation is comparatively backloaded, with substantial pass-through still expected to transpire in the period ahead.[10]
Second, with expected inflation at various horizons now lower than at the date of our last rate hike, a given nominal interest rate now maps into a higher real interest rate. It is straightforward that the calibration of the appropriate degree of restrictiveness should adjust for the impact of lower expected inflation.
Third, the overall restrictiveness of aggregate financial conditions also depends on the evolution of term premia and risk premia. Among other factors, these will be influenced by developments in global financial markets.
The future rate path will also be guided by our management of the two-sided risks in proceeding through the next phase. In one direction, easing the stance too quickly would not be consistent with inflation sustainably returning to target if inflation turns out to be more persistent than anticipated. In the other direction, keeping rates overly restrictive for too long could push inflation below target over the medium term. This would require corrective action through a subsequent acceleration in rate cuts that could even require having to descend to below-neutral levels to fix any persistent drift towards a below-target inflation trend.
In deciding on the appropriate policy rate path, we will continue to follow a data-dependent and meeting-by-meeting approach to determining the appropriate level and duration of restriction, and we are not pre-committing to a particular rate path. This approach has served us well in the tightening cycle and many of the same considerations will apply during the unwinding phase.[11]
In relation to staff projections of various indicators, I rely on the March 2024 exercise. The projections from the June 2024 exercise will be published after our 6 June monetary policy meeting.
See Bańbura, M., Bobeica, E., Bodnar, K., Fagandini, B., Healy, P. and Paredes, J. (2023), “Underlying inflation measures: an analytical guide for the euro area”, Economic Bulletin, Issue 5, ECB. On the importance of energy inflation and other supply shocks in explaining the rise and fall of inflation see also: Afrouzi, M., Bhattarai, S. and Wu, E. (2024) “Relative-Price Changes as Aggregate Supply Shocks Revisited: Theory and Evidence”, mimeo; Arce, Ó., Ciccarelli, M., Kornprobst, A., & Montes-Galdón, C. (2024). What caused the euro area post-pandemic inflation? ECB Occasional Paper, No. 343; Dao, M. C., Gourinchas, P.-O., Leigh, D. and Mishra, P. (2024) Understanding the international rise and fall of inflation since 2020, mimeo.
The medium-term services inflation rate that is consistent with sustainably meeting the target of two per cent for the headline inflation rate will depend on the structural factors driving the medium-term relative price trends across energy, food, goods and services.
Comment on LCI indicator.
See S. Holton, G.Koester (2024), Tracking euro area wages in exceptional times, The ECB Blog.
See P. Adrjan, R. Lydon (2022), Wage growth in Europe: evidence from job ads, Central Bank of Ireland Economic Letter 2022-07.
See Arce, Ó. and Sondermann, D. (2024), “Low for long? Reasons for the recent decline in productivity”, The ECB Blog, 6 May.
These patterns are charted in my recent speech Lane, P.R. (2024), “Disinflation in the euro area: an update”, speech at the University College Dublin Economics Society, 15 April.
See also C. Lagarde (2024), “Building confidence in the path ahead,” Speech at The ECB and its Watchers XXIV Conference, organised by the Institute for Monetary and Financial Stability, Goethe University.
See Chart 37 in Lane, P.R. (2024), “The analytics of the monetary policy tightening cycle”, speech at Stanford Graduate School of Business, 2 May.
For a more extensive discussion of the rate setting criteria, see Lane, P.R. (2024), “The analytics of the monetary policy tightening cycle”, speech at Stanford Graduate School of Business, 2 May.
European Central Bank
Directorate General Communications
- Sonnemannstrasse 20
- 60314 Frankfurt am Main, Germany
- +49 69 1344 7455
- media@ecb.europa.eu
Reproduction is permitted provided that the source is acknowledged.
Media contacts