





Published as part of the ECB Economic Bulletin, Issue 6/2026.
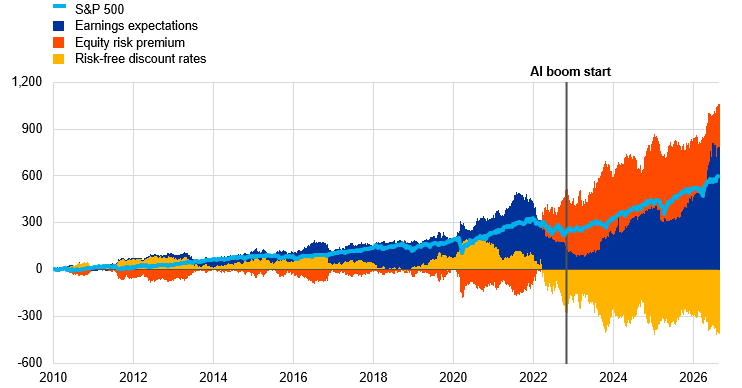
In recent years US equity valuations have been supported by strong realised and expected earnings linked to the artificial intelligence (AI) boom. The “AI boom” refers to the fast pace of innovation and growing use of AI technologies since the public release of ChatGPT in November 2022, leading to investment opportunities in many sectors across the economy and rapidly rising equity valuations. Seen through the lens of a dividend discount model, increasing equity valuations can be supported by three main factors: higher earnings expectations, lower discount rates and lower risk premia.[1] The earnings seasons earlier this year saw many US companies report strong results, with the overall earnings growth for S&P 500 firms again outperforming earlier expectations.[2] Strong earnings have fed into expectations of further increases in profits, supported by the continued expansion of AI-related investment and expectations of associated productivity gains. One way to gauge the role of earnings, interest rates and risk premia in equity returns is by applying a dividend discount model, which breaks down returns into these key components. The model decomposition shows that expectations of continued rising corporate profitability are the main factor fuelling risk asset prices in the United States (Chart A, panel a). As well as supporting valuations, high earnings expectations also dampened equity risk, as shown by a decomposition of market-based estimates of tail risks to equity prices using quantile regressions (Chart A, panel b).
Chart A
Drivers of US equity prices
a) Decomposition of S&P 500 returns
(cumulative changes and contributions since January 2010 in percentage points)
b) Decomposition of predicted 10th percentile of S&P 500 returns
(year-on-year percentage changes)

Sources: Bloomberg, Cboe Global Markets, LSEG, Haver analytics and ECB staff calculations.
Notes: Panel a): The decomposition is based on a dividend discount model. The model includes share buybacks, discounts future cash flows with interest rates of appropriate maturity and covers three expected dividend growth horizons. The residual from decomposing the returns into earnings expectations and discount factors, shown in red, can be interpreted as the contribution from the equity risk premium. A higher contribution means a lower equity risk premium. Positive contributions can be interpreted as risk-on sentiment, supporting equity prices beyond the contributions from earnings expectations and discount rates. “AI boom start” refers to end-October 2022. Panel b): The dots denote the expected 10th percentile of year-on-year S&P 500 returns for one-month and six-month horizons estimated with quantile regressions. The variables in the model are the term spread (10y-2y), implied equity volatility (Cboe Volatility Index (VIX)) and 12-month forward earnings per share growth. The latest observations are for 21 August 2026 (panel a, weekly data) and 31 August 2026 (panel b).
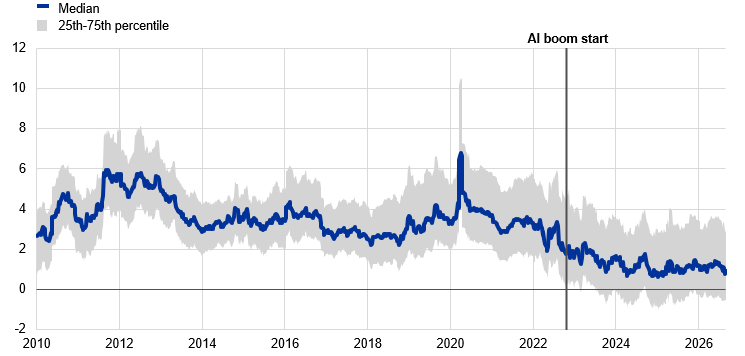
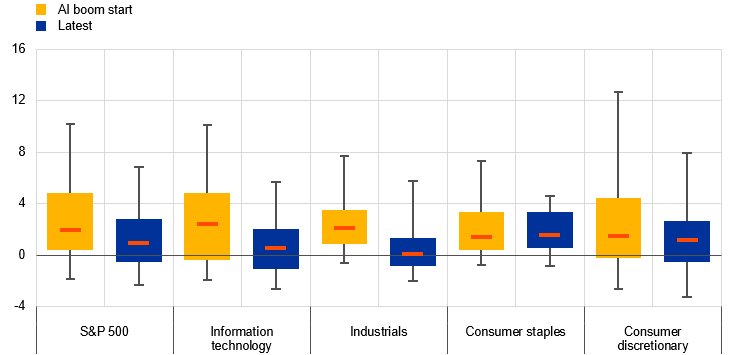
During the AI boom, risk appetite in US equity markets has been strong and the compensation investors expect to receive for equity risk has fallen to low levels. The equity risk premium is a common measure of the compensation demanded by investors for bearing equity risk, which can be interpreted as the excess return of equities over risk-free assets. It can be approximated as the difference between a company’s earnings yield, which is a measure of the earnings a company is expected to generate over the next 12 months relative to its stock price, and the 10-year US Treasury bond yield. From a historical perspective, the distribution of equity risk premia across individual S&P 500 stocks has become compressed, falling close to zero for the 25th percentile (Chart B, panel a). A closer look at intra-sectoral firm-level distributions reveals that risk pricing in the equity market has become subdued across several US sectors. The trend is particularly marked in the technology sector, where many AI-related companies are classified, but can also be observed in other sectors such as industrials (Chart B, panel b). This likely reflects investors’ heightened appetite for AI-related exposure, as well as broader optimism about the potential benefits to be gained from AI adoption. In addition, higher-risk stocks within sectors have benefited from more favourable risk pricing, as shown by the compression of the upper tails of the sectoral risk distributions, which is a sign of broader investor risk appetite across sectors.
Chart B
Equity risk pricing across S&P 500 companies
a) Distribution of S&P 500 equity risk premia
(percentage points)
b) Distribution of equity risk premia for S&P 500 sectors
(percentage points)
Sources: LSEG and ECB staff calculations.
Notes: The equity risk premium is proxied for each company in the S&P 500 index as the difference between the company’s earnings yield and the 10-year US Treasury bond yield. In panel a), “AI boom start” refers to end-October 2022. In panel b), the red horizontal lines depict the median, the whiskers represent the 5th and 95th percentiles and the yellow and blue bars cover the 25th to 75th percentile range. The latest observations are for 28 August 2026 (weekly data).
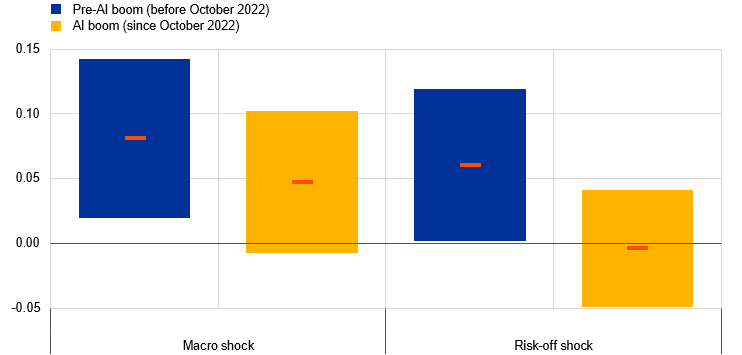
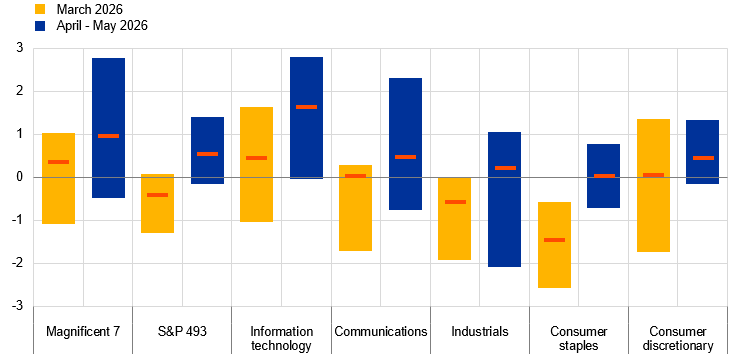
Strong earnings and ample investor risk appetite have helped US stock markets stay resilient to pressures related to higher longer-term US interest rates and geopolitical headwinds. The AI boom has kept US equity markets unusually insulated from large adverse shocks. This can be shown by comparing the reaction of the US equity risk premium to shocks before and after the start of the AI boom, using local projections and model-derived structural shocks. Since the start of the AI boom in autumn 2022, US equity risk premia have shown lower and insignificant reactions to adverse US macro shocks and to global risk-off shocks, contrasting sharply with the re-pricing patterns observed previously (Chart C, panel a). The high resilience of the US equity market to adverse geopolitical shocks was particularly evident during the initial weeks of the conflict in the Middle East. An event study analysis helps summarise the reactions of equity returns to sharply increasing geopolitical risk during the first three months of the conflict. The results show that during the initial phase of the conflict in March 2026, the AI-related segment of the US market (here proxied by the “Magnificent 7” group of firms) and the information technology sector more broadly remained largely insulated from the shock, while other sectors such as consumer staples experienced a fall in equity returns (Chart C, panel b).[3] In April and May the broader US equity market stayed resilient to geopolitical headwinds, led by the AI-related segments.
Chart C
Sensitivity of US equity risk pricing to adverse shocks
a) Response of US equity risk premia to adverse structural shocks before and since the start of the AI boom
(percentage points)
b) US equity returns around peaks in geopolitical risk – March to May 2026
(percentage points)
Sources: Bloomberg, LSEG, Haver analytics and ECB staff calculations.
Notes: Panel a) shows the sensitivity of the median equity risk premium across companies in the S&P 500 index to adverse US macro shocks and adverse global risk-off shocks, estimated using local projections. The shocks are identified in a two-country BVAR model as in Brandt et al. (2026) and are calibrated to a one-week decline in the equity price of 3% for the adverse macro shock and 2% for the risk-off shock. The blue and yellow bars represent the 95% confidence interval while the red line represents the mean response. Panel b) shows the range of equity returns across selected events causing high levels of geopolitical risk. Equity returns are computed for selected sectors two days around the events. The event days are selected based on the ten highest levels of the geopolitical risk index during the initial phase of the Middle East conflict in March 2026 and during the more recent period since the initial ceasefire announcement. The red horizontal lines depict the median. The latest observations are for 31 August 2026 (panel a, weekly data) and for 29 May 2026 (panel b).
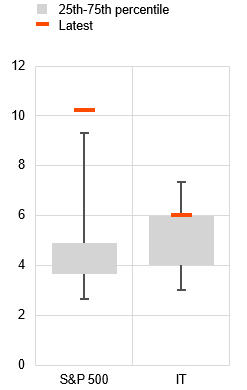
Despite favourable risk pricing, weakening sentiment towards the AI-driven rally and increasing price differentiation across technology firms are creating risks of broader adjustments in an increasingly concentrated market. A closer look at the distribution of equity risk premia across individual technology stocks illustrates that – while the median risk price has remained significantly compressed in recent months – the tails of the distribution have widened (Chart D, panel a). This indicates that some parts of the market, particularly the higher-risk stocks within the upper tail of the risk premium distribution, are vulnerable to fading investor risk appetite, with investors starting to demand higher risk compensation for their investments. Furthermore, a sell-off in a small number of such firms could cause broader market declines, given the highly concentrated nature of the equity market. The Herfindahl-Hirschman Index, a measure of market concentration, is above its historical 95th percentile for the broader S&P 500 and above its 75th percentile for the IT sector (Chart D, panel b). This concentration amplifies the risk that significant underperformance by a few mega-cap stocks – particularly those tied to substantial AI-related investments – could spill over to the broader market. That could also raise broader concerns about whether optimistic profit expectations can materialise simultaneously for firms and whether large-scale, debt-financed investments will remain sustainable amid rapidly evolving technology.
Chart D
Equity risk pricing and concentration in US technology sector and S&P 500
a) Equity risk premia | b) Concentration |
|---|---|
(percentages) | (index) |
 |  |
Sources: Bloomberg, LSEG and ECB staff calculations.
Notes: Panel a): The equity risk premium is computed for each company in the S&P 500 technology sector as the difference between the company’s earnings yield and the 10-year US Treasury bond yield. Panel b): Concentration is measured by an adjusted Herfindahl-Hirschman Index ranging from 1 to the number of companies considered. The whiskers represent the 5th and 95th percentiles of the distribution of the index computed since 1990. The latest observations are for 28 August 2026 (panel a, weekly data) and 29 August 2026 (panel b, weekly data).
References
Grothe, M., Manu, A. and Tomov, T. (2024), “What’s behind the resilience of US equity prices – market structure, earnings expectations or equity risk premia?”, Economic Bulletin, Issue 8, ECB.
Ferrari Minesso, M., Mendes, B., Stalla-Bourdillon, A. and Vidaházy, V. (2026), “How US financial markets react to geopolitical shocks hitting oil supply”, Economic Bulletin, Issue 4, ECB.
ECB (2026), Financial Stability Review.
Andersson, M., Breckenfelder, J., Corradin, S., Nikolov, K. and Viola, M. (2026), “The AI boom: rational enthusiasm or the next dot-com bubble?”, The ECB Blog, ECB, 17 August.
For a broader historical discussion of technology-driven boom and bust cycles in equity markets, see Andersson et al. (2026).
For related analyses of US equity market developments, strong earnings performance, growing market concentration and related risks, see Grothe et al. (2024) and the ECB’s Financial Stability Review (2026).
See also a related analysis of recent market reactions to geopolitical shocks in Ferrari Minesso et al. (2026).