
The ECB Survey of Professional Forecasters - Third quarter of 2022
Summary
In the ECB Survey of Professional Forecasters (SPF) for the third quarter of 2022, HICP inflation expectations were revised up across all horizons, standing at 7.3%, 3.6% and 2.1% for 2022, 2023 and 2024 respectively.[1] According to respondents, the upward revisions mainly reflect higher energy and food prices, but also the stronger than expected pass-through of input cost increases. Longer-term inflation expectations (for 2027) were revised up by another 0.1 percentage point to stand at 2.2% on average. Expectations for inflation excluding energy, food, alcohol and tobacco (HICPX) were also revised up across all horizons. According to respondents, these revisions mainly reflect stronger and broader indirect effects from higher energy and food prices, effects from supply chain disruptions and post-pandemic rebounds. Real GDP growth expectations were revised down for 2022 (from the second quarter onwards) and 2023 but remained unchanged for 2024. Longer-term growth expectations were revised up marginally. At the same time, the profile of the expected unemployment rate was revised down once again for all horizons by between 0.1 and 0.2 percentage points. The expected profile for the future unemployment rate is relatively flat, declining from 6.7% in 2022 to 6.4% by 2027, a record low.
Table 1
Results of the SPF in comparison with other expectations and projections
(annual percentage changes, unless otherwise indicated)
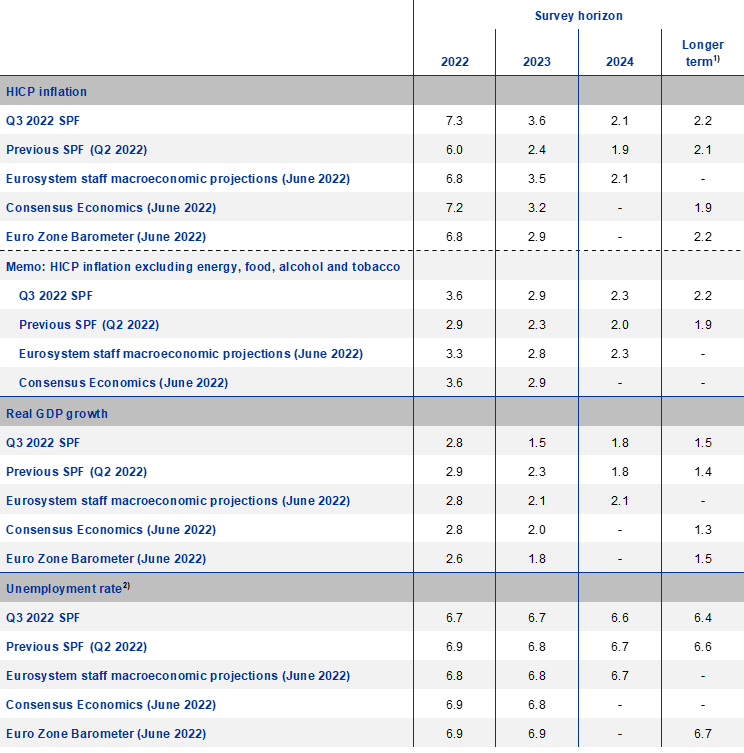
1) Longer-term expectations refer to 2027, except for the Euro Zone Barometer and the Q2 2022 SPF, which refer to 2026. Longer-term expectations from Consensus Economics and the Euro Zone Barometer are from the April 2022 surveys.
2) As a percentage of the labour force.
1 HICP inflation expectations revised up for 2022, 2023 and 2024
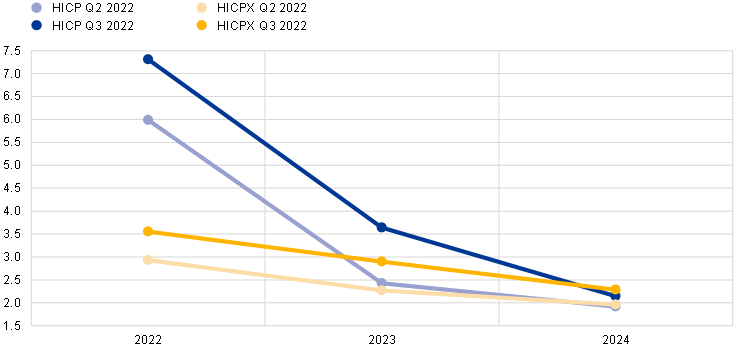
SPF respondents revised up their inflation expectations for 2022, 2023 and 2024. These stand at 7.3%, 3.6% and 2.1% respectively, 1.3, 1.2 and 0.2 percentage points higher compared with the previous survey round (see Chart 1). Compared with the June 2022 Eurosystem staff macroeconomic projections, inflation expectations in this SPF round were higher by 0.5 percentage points for 2022 and by 0.1 percentage point for 2023, but remained the same for 2024 (see Table 1).
Chart 1
Inflation expectations: overall HICP inflation and HICP inflation excluding energy, food, alcohol and tobacco
(annual percentage changes)
Regarding the near-term outlook, respondents cited energy and food prices as the main factors behind their upward revisions to the 2022 and 2023 inflation expectations. In addition to the direct impact on consumer prices of food and energy, with gas mentioned more often than oil, respondents also noted that indirect effects working through the production chain were behind the higher expectations for HICP inflation excluding food and energy. In the previous round, respondents generally did not consider underlying price pressures to have increased, as they had revised down their growth projections and only saw a limited impact of higher inflation on their wage expectations. In contrast, respondents in this round noted that (i) indirect effects were broader and more intense than expected, (ii) they considered domestic price pressures to have generally increased as price increases broadened across sectors and (iii) high inflation was likely to have an impact on wages. The weaker euro (particularly versus the dollar) and tight labour markets were also cited as upward factors for inflation expectations. At the same time, some respondents noted that some of the global value chain disruptions and the prices of some (primarily) non-energy, non-food commodities, such as metals and other industrial raw materials, were showing tentative signs of peaking or even easing.
Respondents were asked to elaborate on their recent inflation forecast errors and on when they thought HICP/HICPX inflation would peak.[2] Respondents cited the following as the main factors behind recent forecast errors: (i) energy price increases, (ii) food prices, which were linked to energy prices and to the Ukraine conflict, (iii) a broader and more intense pass-through of indirect effects from energy prices, (iv) supply side issues in global value chains, which was linked to the pandemic generally, China’s zero-coronavirus (COVID-19) policy and the war in Ukraine, and (v) rebounds in certain segments previously impacted by the pandemic, particularly services. Generally, they felt these factors would persist and perhaps intensify. On the possible timing of their forecasted “peak” in inflation, it should be (noted that every respondent expected inflation in 2023, 2024 and 2027 to be lower than in 2022). A majority (14 out of 19 for headline inflation and five out of seven for HICPX) felt that the peak was yet to come. The modal answer for both headline HICP inflation (10 out of 19 responses) and HICPX inflation (three out of seven responses) was September 2022 (see Chart 2).
Chart 2
Expected peak in HICP/HICPX inflation
(percentage of respondents)
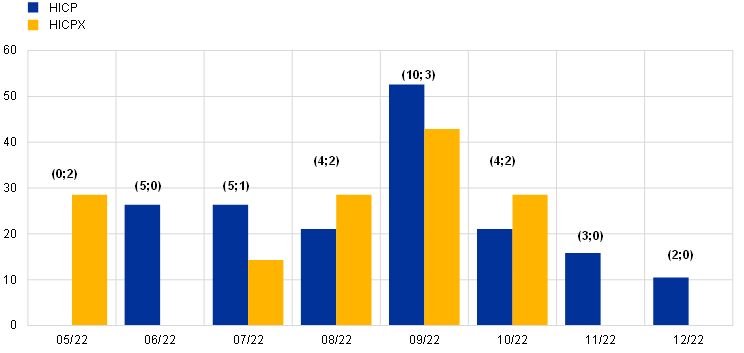
Notes: The label (x;y) indicates number of respondents for HICP and HICPX respectively. As some respondents specified a range of months, percentages may sum to more than 100%.
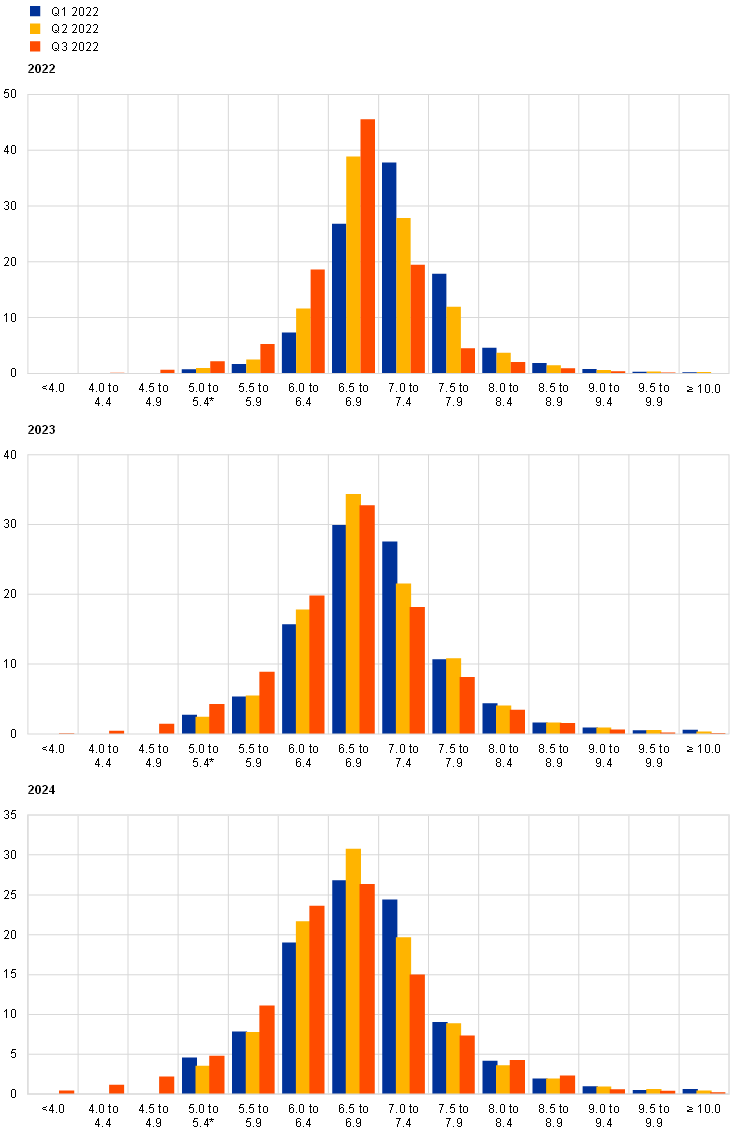
For the shorter and medium-term horizons, quantitative indicators of uncertainty surrounding the inflation outlook increased to record levels and the balance of risks was assessed to be clearly on the upside.[3] Quantitative indicators of uncertainty for inflation derived from the reported probability distributions increased to historically high levels. The high level of “aggregate uncertainty” is owing to elevated “disagreement” among forecasters about their point forecasts combined with a high average level of “individual uncertainty” reflected in the average width of the individual probability distributions. The aggregate probability distributions for the calendar years from 2022 to 2024 are presented in Chart 3. The quantitative balance of risk indicator (calculated as the estimated mean of the aggregate probability distribution minus the average reported point expectation) for shorter horizons was generally to the upside. In their qualitative remarks, respondents reported risks of further energy and food price increases as well as some pass-through that was even stronger than assumed. At the same time, some respondents cited downside risks in the form of an economic slowdown triggered either by the impact of high inflation on real disposable incomes or by the tightening of monetary policy.
SPF expectations for inflation excluding energy, food, alcohol and tobacco (HICPX) were also revised up for all horizons. HICPX expectations for 2022, 2023 and 2024 stood at 3.6%, 2.9% and 2.3% respectively, representing upward revisions of 0.7 percentage points for 2022, 0.6 percentage points for 2023 and 0.3 percentage points for 2024. Respondents indicated that the upward revisions reflect a more intense and broader pass-through of higher energy and food prices and of global supply chain disruptions. They also considered that the combination of higher inflation and tight labour market conditions would result in higher wage increases. A number of respondents noted that inflationary pressure was no longer just “external” and that domestic price pressures were also starting to rise. The SPF forecasts for HICPX in 2022 and 2023 were higher than those from the June 2022 Eurosystem staff macroeconomic projections by 0.3 and 0.1 percentage points respectively, but remained the same for 2024 (see Table 1).
Chart 3
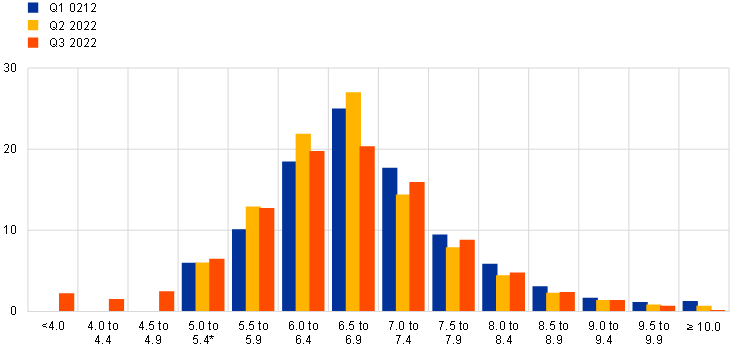
Aggregate probability distributions for expected inflation in 2022, 2023 and 2024
(x-axis: HICP inflation expectations, annual percentage changes; y-axis: probability, percentages)
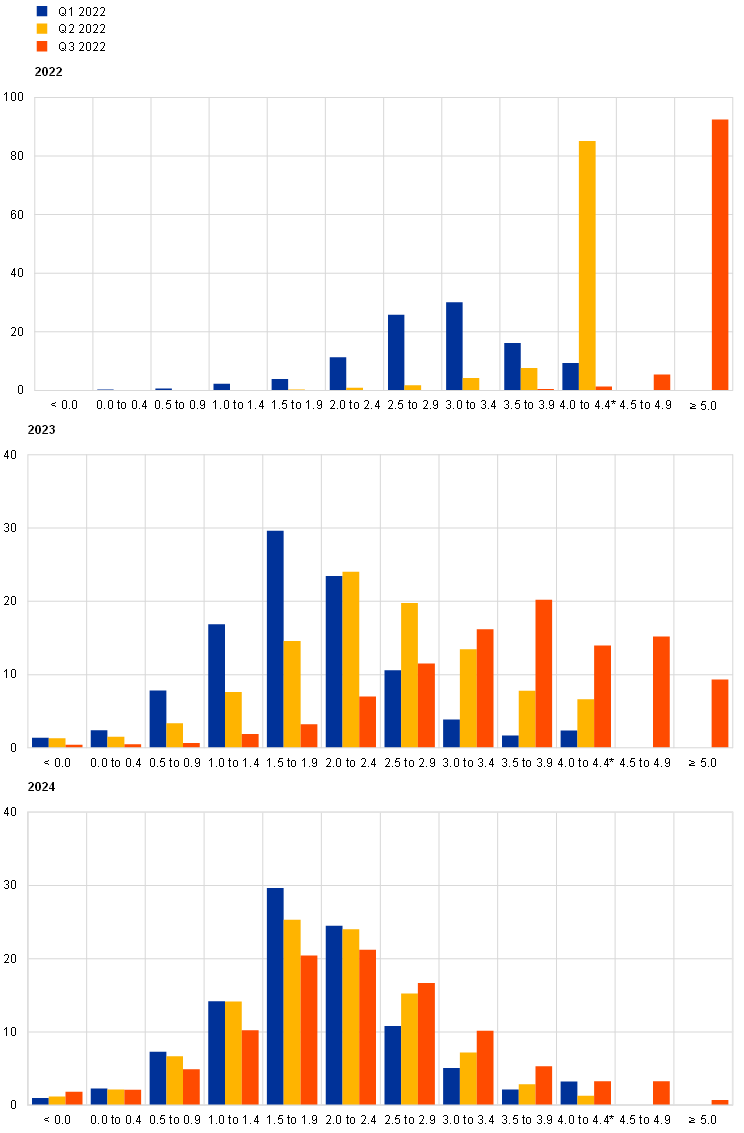
Notes: The SPF asks respondents to report their point forecasts and to separately assign probabilities to different ranges of outcomes. This Chart shows the average probabilities they assigned to different ranges of inflation outcomes in 2022, 2023 and 2024. To minimise the number of bins in the questionnaire, the upper bin for inflation outcomes was set to ≥ 5.0%. *The highest bin used in the first quarter of 2022 and the second quarter of 2022 rounds was ≥4.0%. The fact that this would lead to most probability being assigned to the upper bin for 2022 was flagged to respondents when sending out the questionnaire.
2 Longer-term inflation expectations revised up further
Longer-term inflation expectations further increased. Expectations for 2027 averaged 2.2%, a further upward revision from 2.1% in the previous round. With a trimmed mean, where the highest response and the two lowest responses are removed, the increase would be to 2.1% from 2.0%. The median point expectation was unchanged at 2.0%. The estimated mean of the aggregate probability distribution also increased to 2.1% from 2.0% (see Chart 4). Having remained in the narrow range (1.64%-1.69%) in the SPF rounds between the fourth quarter of 2019 and the second quarter of 2021, longer-term inflation expectations have moved up noticeably since the third quarter of 2021. In the most recent round (third quarter of 2022), considering a balanced panel of those who also replied in the second quarter of 2022 round, more respondents revised their longer-term inflation expectations upwards than downwards.[4] The distribution of individual point forecasts changed considerably in the previous four rounds, when compared with rounds from the first quarter of 2019 to the second quarter of 2021. However, in this round it remained broadly unchanged (see Chart 5). The mode of the distribution was again clearly at 2.0%. Similar to the previous round, there was a number of respondents who reported longer-term inflation expectations above 2.5% (8, or 17%, in the third quarter of 2022 compared with 5, or 11%, in the second quarter of 2022 round).
Chart 4
Longer-term inflation expectations
(annual percentage changes)
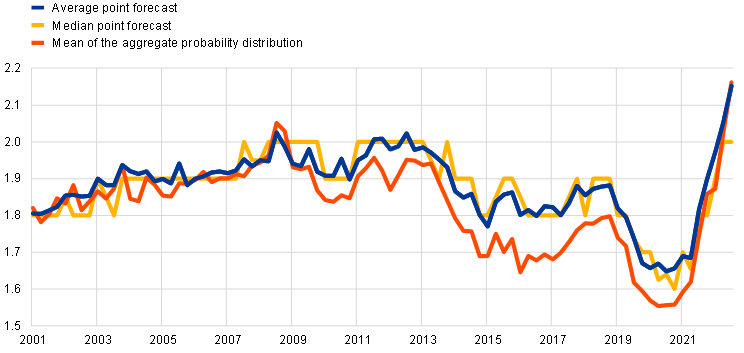
Chart 5
Distribution of point expectations for HICP inflation in the longer term
(x-axis: longer-term HICP inflation expectations, annual percentage changes; y-axis: percentages of respondents)

Notes: The SPF asks respondents to report their point forecasts and to separately assign probabilities to different ranges of outcomes. This Chart shows the spread of point forecast responses. Longer-term expectations refer to 2027 in the third quarter of 2022 round and to 2026 in the previous rounds shown.
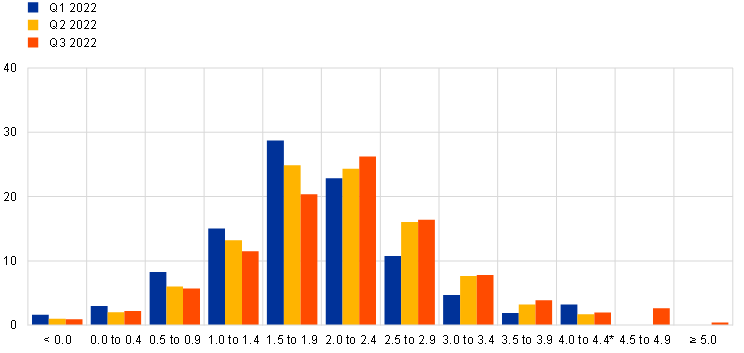
Uncertainty surrounding longer-term inflation expectations increased, and the balance of risks tilted to the upside for the first time since the global financial crisis. The sharp increase in “aggregate uncertainty” – the standard deviation of the aggregate probability distribution (see Chart 6) – was primarily due to increased “disagreement” resulting from a strong outlier, while “individual uncertainty”, as measured by the average width of the individual probability distributions, increased slightly further to a historically high level. The balance of risk indicator turned positive for the first time since 2009. The probability associated with longer-term inflation being in the range 1.5%-2.5% decreased slightly to 47% (from 49%), with a 33% (from 29%) probability above this range (i.e. >2.5%) and a 20% (from 22%) probability below this range (i.e. <1.5%).
Chart 6
Aggregate probability distribution for longer-term inflation expectations
(x-axis: HICP inflation expectations, annual percentage changes; y-axis: probability, percentages)
Notes: The SPF asks respondents to report their point forecasts and to separately assign probabilities to different ranges of outcomes. This Chart shows the average probabilities they assigned to different ranges of inflation outcomes in the longer term. *The highest bin used in the first quarter of 2022 and the second quarter of 2022 rounds was ≥4.0. Longer-term expectations refer to 2027 in the third quarter of 2022 round and to 2026 in the previous rounds shown.
The longer-term expectations for HICP inflation excluding energy, food, alcohol and tobacco (HICPX) increased to 2.2%, up from 1.9% in the previous round. While the scale of the increase is due to rounding and to a large outlier, excluding this outlier would still have resulted in an increase from 1.9% to 2.0%. There was thus an upward revision on average when compared with the previous round, as was the case with headline HICP expectations. The median longer-term point expectation for HICPX also increased to 2.0%, from 1.9%. Of the 24 respondents who provided longer-term HICPX expectations in both the third quarter of 2022 and second quarter of 2022 rounds, 11 revised them up, 11 kept them unchanged and two revised them down. The evolution of longer-term expectations for HICP and HICPX inflation has been broadly similar for the period of available data since the fourth quarter of 2016, with a level difference of around 0.1 percentage point on average, but this difference has disappeared in this round. This feature also holds when controlling for outliers.
3 Real GDP growth expectations revised down for the near term, but broadly stable otherwise
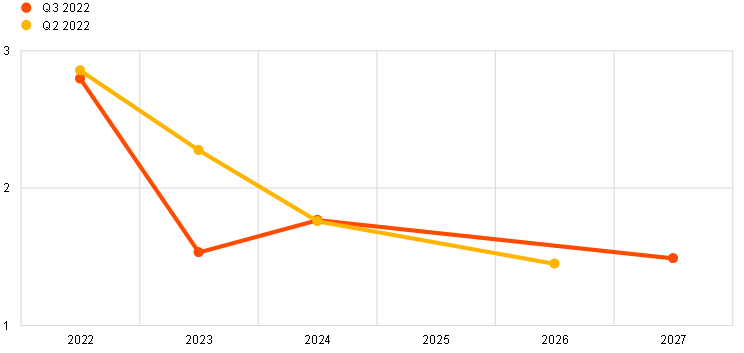
GDP growth expectations in the third quarter of 2022 survey round stood at 2.8% for 2022, 1.5% for 2023 and 1.8% for 2024 (see Chart 7). Compared with the previous round, these imply downward revisions of 0.1 percentage point for 2022 and 0.8 percentage points for 2023, and no change for 2024. For the 2022 annual growth rate expectation, respondents noted that the stronger than expected outturn in the first quarter largely offset the weaker dynamics expected for the other quarters, and these lower dynamics would then mainly show in carry-over to 2023. Respondents report that the main factors contributing to this bleaker growth outlook include intensifying energy price pressures, the tightening of monetary policy around the world and inflation harming households’ purchasing power, an effect which is compounded by the foreseen persistence and broadening of inflationary pressures. Respondents also noted that despite pandemic-related supply chain bottlenecks having eased somewhat, they are still acting as a drag on the global economy. By contrast, fiscal measures against rising energy prices have cushioned the energy price shock to some extent, and the effects of the reopening of the economy also played out positively. Downward risks remained broadly the same. In addition to risks relating to the duration and effects of the war in Ukraine, respondents highlighted concerns about a possible halting of energy supplies and the need to impose rationing on energy use during the winter. Additional factors that were referenced included fears of a new COVID-19 outbreak, faster monetary tightening and persistent supply chain disruptions. Respondents considered the perspective of a quick resolution to the war in Ukraine, something cited as a potential upside risk in the previous round, to now be fading, reducing possible upward risks. Longer-term growth expectations (which refer to 2027) were marginally higher at 1.5%, up by 0.1 percentage point.
Chart 7
Expectations for real GDP growth
(annual percentage changes)
Respondents were again asked to provide the profile of their short-term GDP outlook (from the second quarter of 2022 until the first quarter of 2023).[5] Actual quarter-on-quarter real GDP growth for the first quarter of 2022 was 0.6%, substantially more than the forecast of 0.2% in the previous SPF round. In this round, forecasters expected quarter-on-quarter growth between the second quarter of 2022 and the first quarter of 2023 to remain modest at around 0.2% on average (ranging from 0.1% to 0.3%). This is about 0.4 percentage points lower per quarter than forecast in the previous round for the second quarter of 2022 to the fourth quarter of 2022 (see Chart 8). Of the 44 forecasters who provided a forecasted quarterly growth profile, 19 (or 43.2%) see at least one quarter of negative growth between the second quarter of 2022 and the second quarter of 2023 (eight for the second quarter, four for the third quarter, 14 for the fourth quarter and ten for the first quarter of 2023). 11 (or 25%) forecast a “technical recession” – two consecutive quarters of negative growth– over the period. SPF forecasts for the second quarter of 2022 were broadly similar to those of the June 2022 Eurosystem staff Macroeconomic Projection Exercise, but were more pessimistic for the following three quarters (by about 0.3 percentage points per quarter).
Chart 8
Expected profile of quarter-on-quarter GDP growth
(quarter-on-quarter percentage changes)

Notes: Grey area indicates one standard deviation (of individual expectations) around average SPF expectation.
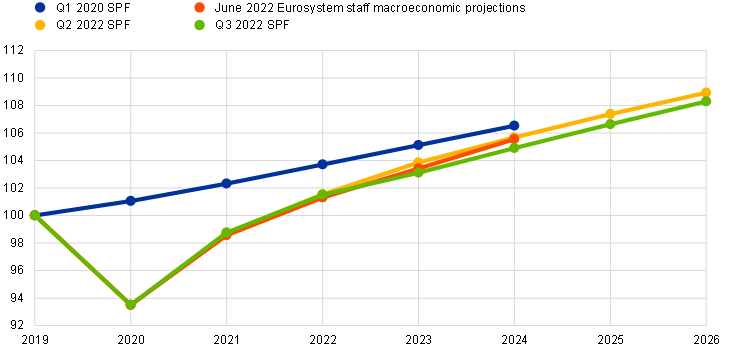
Although real GDP returned to above its pre-pandemic level in the fourth quarter of 2021, the downward revisions to expected growth in 2022 and 2023 have further delayed its expected return to the pre-pandemic profile (see Chart 9). Compared with the profile expected in the first quarter of 2022 round (conducted in early January, before Russia’s invasion of Ukraine), the level of GDP has been revised down by about 2%. Expected GDP levels after 2023 are also lower than forecast in the June 2022 Eurosystem staff macroeconomic projections (by about 0.6% in 2024).
Chart 9
Forecast profile of real GDP level
(2019 = 100)
Note: Growth expectations for years not surveyed have been interpolated linearly.
Quantitative measures of uncertainty inched up this round, while the two-year-ahead balance of risks deteriorated dramatically, close to its lowest historical levels (see Chart 10 and Chart 11). The only other occasions when the balance of risks around the two-year-ahead growth expectation has been lower was at the beginning of the pandemic in early 2020 and after the terrorist attacks of 11 September 2001. Aggregate uncertainty increased at the longer-term horizons, and risks were tilted even more to the upside this round. Although uncertainty was elevated by historical standards, it was still considerably lower than at its peak in the second and third quarters of 2020. The deterioration in the balance of risks was attributed in large part to fears of a halt in Russian gas supplies. Further deteriorations in sentiment as well as lower real incomes owing to persistent inflation are also among the fears registered.
Chart 10
Aggregate probability distributions for GDP growth expectations for 2022, 2023 and 2024
(x-axis: real GDP growth expectations, annual percentage changes; y-axis: probability, percentages)
Notes: The SPF asks respondents to report their point forecasts and to separately assign probabilities to different ranges of outcomes. This Chart shows the average probabilities they assigned to different ranges of real GDP growth outcomes in 2022, 2023 and 2024.
Chart 11
Aggregate probability distribution for longer-term GDP growth expectations
(x-axis: real GDP growth expectations, annual percentage changes; y-axis: probability, percentages)
Notes: The SPF asks respondents to report their point forecasts and to separately assign probabilities to different ranges of outcomes. This Chart shows the average probabilities they assigned to different ranges of real GDP growth outcomes in the longer term. Longer-term expectations refer to 2027 in third quarter of 2022 round and to 2026 in the previous rounds shown.
4 Unemployment rate expectations revised down again for all horizons
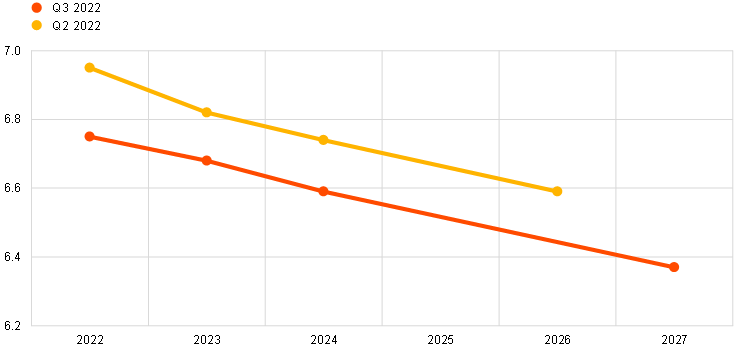
The average point forecasts for the unemployment rate in the third quarter of 2022 round were 6.7%, 6.7% and 6.6% for 2022, 2023 and 2024 respectively. The expectation for 2027 was 6.4%, the lowest rate ever recorded for long-term unemployment expectations. As in the previous round, the expected downward sloping trajectory of the unemployment rate remains, but is somewhat flatter, as it starts from a lower level in 2022 (see Chart 12). Respondents explained that the smaller downward revisions beyond 2022 were due to the impact of the lower expected levels of economic activity. High inflation, which is reducing real disposable incomes and consumption as well as feeding into wages, was mentioned as the main upward risk for unemployment. By contrast, robust labour markets, demographic factors and labour shortages in certain sectors were frequently mentioned as downward risks. Unlike the previous round, the war in Ukraine and migration were not explicitly mentioned as factors affecting the unemployment rate forecasts.
Chart 12
Expectations for the unemployment rate
(percentages of the labour force)
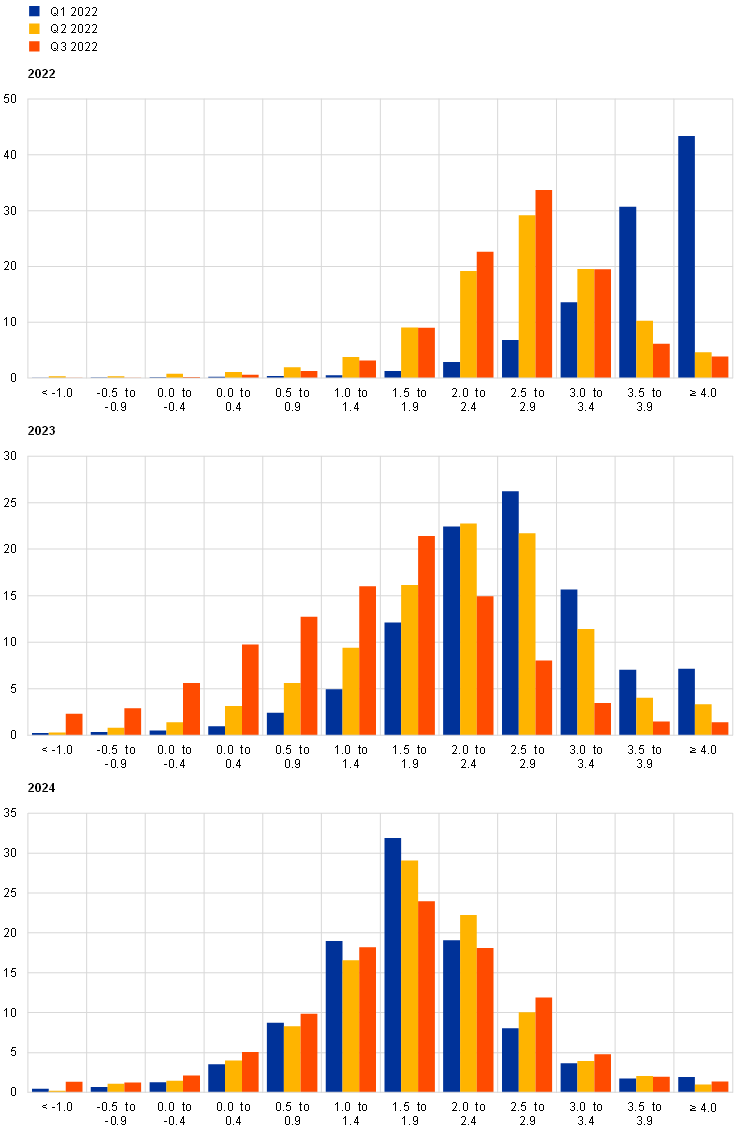
Uncertainty around expectations for the unemployment rate increased slightly for all horizons, remaining at relatively high levels, and the balance of risks is to the upside for all horizons. On balance, the distributions are losing the marginally positive skewness seen in previous rounds and are now showing a greater degree of symmetry for all horizons (see Chart 13 and Chart 14). The balance of risk indicator for longer-term expectations remained positive, as the mean of the aggregated probability distribution (at 6.6%) was slightly higher than the average point forecast (6.4%).
Chart 13
Aggregate probability distributions for the unemployment rate in 2022, 2023 and 2024
(x-axis: unemployment rate expectations, percentages of the labour force; y-axis: probability, percentages)
Notes: The SPF asks respondents to report their point forecasts and to separately assign probabilities to different ranges of outcomes. This Chart shows the average probabilities they assigned to different ranges of unemployment rate outcomes for 2022, 2023 and 2024. *The lowest bin used in the first quarter of 2022 and the second quarter of 2022 rounds was ≤5.0.
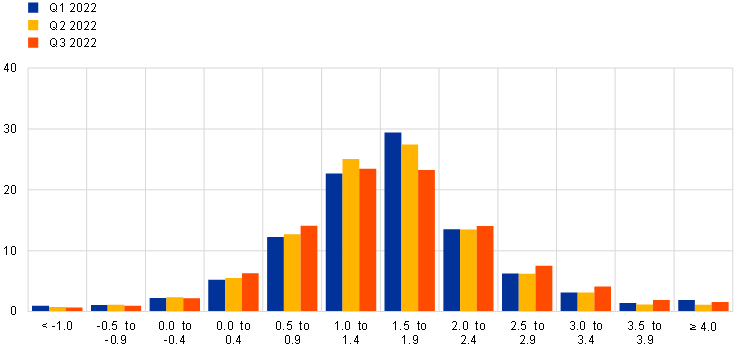
Chart 14
Aggregate probability distribution for the unemployment rate in the longer term
(x-axis: unemployment rate expectations, percentages of the labour force; y-axis: probability, percentages)
Notes: The SPF asks respondents to report their point forecasts and to separately assign probabilities to different ranges of outcomes. This Chart shows the average probabilities they assigned to different ranges of unemployment rate outcomes in the longer term. *The lowest bin used in the first quarter of 2022 and the second quarter of 2022 rounds was ≤5.0. Longer-term expectations refer to 2027 in the third quarter of 2022 round and to 2026 in previous rounds shown.
5 Expectations for other variables
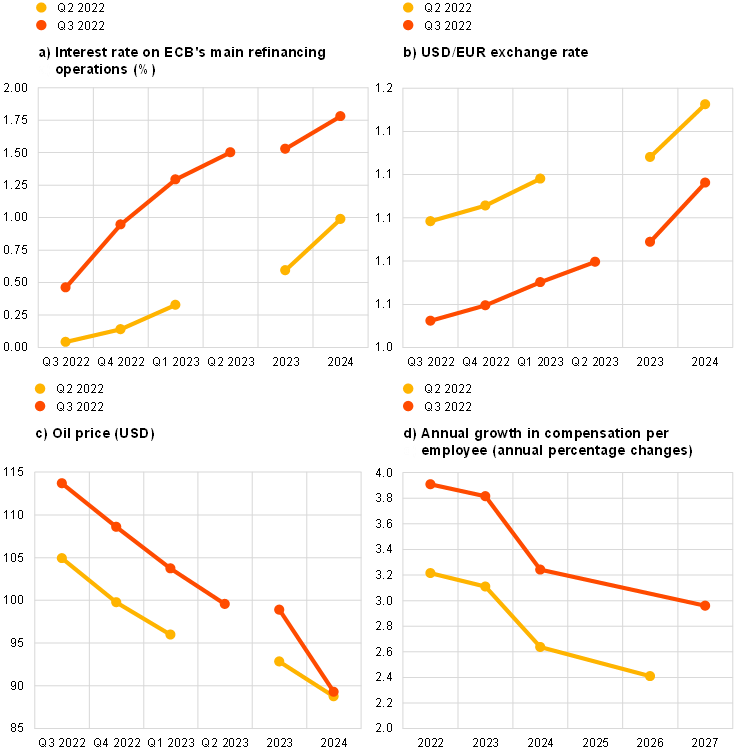
Forecasters expected: the ECB’s key main refinancing operations (MRO) interest rate to increase steadily from 0.5% in the third quarter of 2022 to 1.3% in the first quarter of 2023 and reach an average of 1.8% in 2024; the euro to marginally appreciate against the dollar from 1.06 in 2022 to 1.12 in 2024; oil prices to progressively decrease to levels around USD 89 per barrel until 2024; and nominal wage growth to increase at a rate higher than 3% until 2024 but to moderate to below 3% in the long-term.
The median (and majority) expectation was for the rate on the Eurosystem’s main refinancing operations to increase steadily from 0.5% in the third quarter 2022 to 1.3% the first quarter of 2023. Interest rates are expected to stand at an average level of 1.5% (up from 0.6%) in 2023 and reach 1.8% (up from 1.0%) by 2024 (see Chart 15a). Concerning the 2023 average, almost 90% of the replies reported values below 2%, and around 10% of respondents reported values above 2.5%. Similarly, 80% of respondents expected interest rates to be, on average, below 2% in 2024 and about 15% to be above 2.5%.
The expected average USD/EUR exchange rate was revised downward over all horizons and it is expected to stand at around 1.06 in 2022, to then marginally increase at a constant pace up to 1.12 by 2024 (see Chart 15b).
Compared with the previous round, the level of US dollar-denominated oil prices (per barrel) was revised upwards. The revisions were about USD 9 and USD 6 per barrel for 2022 and 2023, respectively. This resulted in a steeper downward trajectory from about USD 113 per barrel in the second quarter of 2022 to around USD 89 per barrel in 2024 (see Chart 15c). Given the expected USD/EUR exchange rate, the implied revisions to the profile for the oil price in euro terms are somehow higher than those in US dollar terms – EUR 12 in 2022 and EUR 9 in 2023.
Expectations for the annual growth in compensation per employee were revised up by 0.6-0.7 percentage points over all horizons (see Chart 15d). Although expectations for 2027 were recorded to stand at about 3.0%, this figure decreases to an annual growth rate of 2.6% when removing a strong outlier.
Chart 15
Expectations for other variables
6 Annex (Chart data)
Excel data for all charts can be downloaded here.
© European Central Bank, 2022
Postal address 60640 Frankfurt am Main, Germany
Telephone +49 69 1344 0
Website www.ecb.europa.eu
All rights reserved. Reproduction for educational and non-commercial purposes is permitted provided that the source is acknowledged.
For specific terminology please refer to the ECB glossary (available in English only).
PDF ISSN 2363-3670, QB-BR-22-003-EN-N
HTML ISSN 2363-3670, QB-BR-22-003-EN-Q
The survey was conducted between 1 and 5 July 2022, with 56 responses received – this is slightly above the historical average response rate for the third quarter (July) round. Participants were provided with a common set of the latest available data for annual HICP inflation (June 2022 flash estimates: overall inflation, 8.6%; underlying inflation, 3.7%), annual GDP growth (first quarter of 2022, 5.4%) and unemployment (May 2022, 6.6%). This report was drafted on the basis of data available 11 July 2022.
In addition to their general assessment regarding their inflation expectations, respondents were asked, “Could you please elaborate on the elements behind any inflation forecast errors since the previous (2022Q2) round and what this implied for revisions to your inflation profile? In this context, could we ask you in what month(s) you expect HICP and HICPX inflation to peak and whether this peak has shifted?”
The width of the reported probability distributions indicates the perceived degree of overall uncertainty, whereas the asymmetry of the distributions indicates whether that uncertainty is more concentrated on higher or lower outturns, i.e. it measures the perceived balance of risks. Regarding uncertainty, it can be shown that the width (or standard deviation) of the aggregated probability distribution (i.e. “aggregate uncertainty”) is a function of the average width (or standard deviations) of the individual probability distribution (i.e. “individual uncertainty”) and standard deviation of the individual point forecasts (i.e. “disagreement”).
Of the 38 respondents providing longer-term inflation expectations in both rounds, 17 revised them up, seven revised them down and 14 kept them unchanged.
44 respondents provided this profile.
-
22 July 2022