
The ECB Survey of Professional Forecasters (SPF) – First quarter of 2020
Summary
Expectations for euro area inflation, growth and unemployment were largely unchanged in the latest (Q1 2020) ECB Survey of Professional Forecasters (SPF). HICP inflation expectations stand at 1.2%, 1.4% and 1.5% for 2020, 2021 and 2022, respectively.[1] These figures for 2020 and 2021 are the same as they were in the previous (Q4 2019) survey round. (2022 was not surveyed in the previous round.) Longer-term inflation expectations (for 2024) remained at 1.7%. Real GDP growth expectations were also broadly unchanged, standing at 1.1%, 1.2%, and 1.4% for 2020, 2021 and 2022, respectively. Longer-term growth expectations (for 2024) remained unchanged at 1.4%. Unemployment rate expectations were unchanged for 2020 and 2021, and point to a longer-term rate of 7.3%, which is 0.1 percentage points lower than in the previous round. Respondents considered the balance of risks to inflation and GDP growth to remain on the downside.
Table 1
Results of the SPF in comparison with other expectations and projections
(annual percentage changes, unless otherwise indicated)
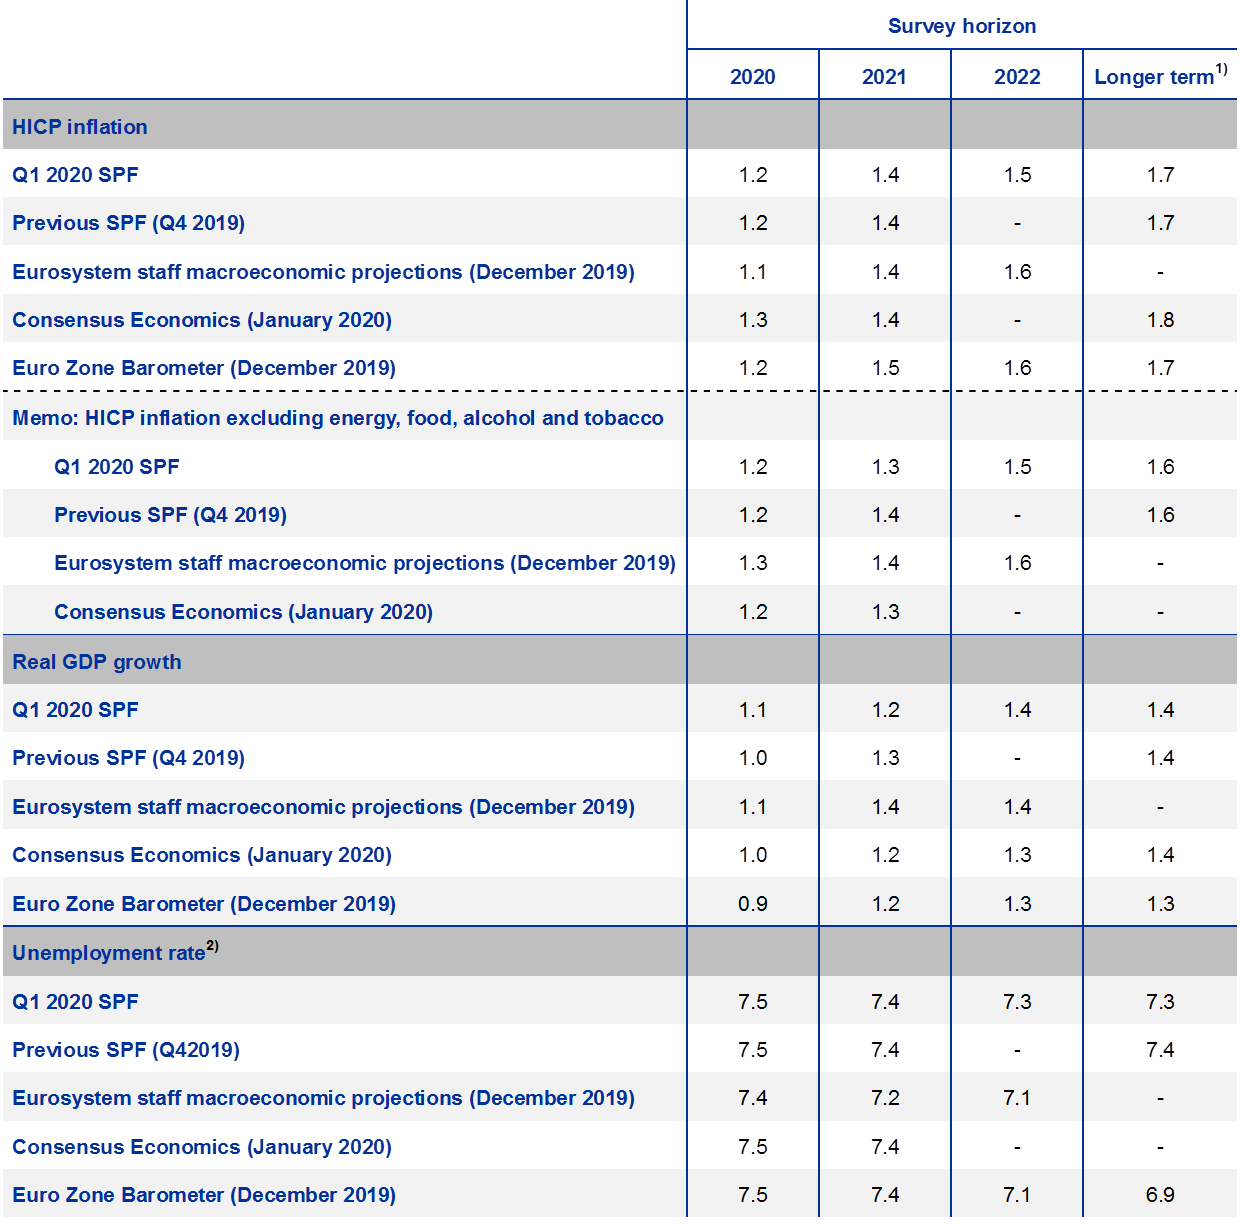
1) Longer-term expectations refer to 2024 in the SPF and Consensus Economics and to 2023 in the Euro Zone Barometer. Euro Zone Barometer longer-term expectations are from the October 2019 survey.
2) As a percentage of the labour force.
1 Inflation expectations largely unchanged for 2020-21
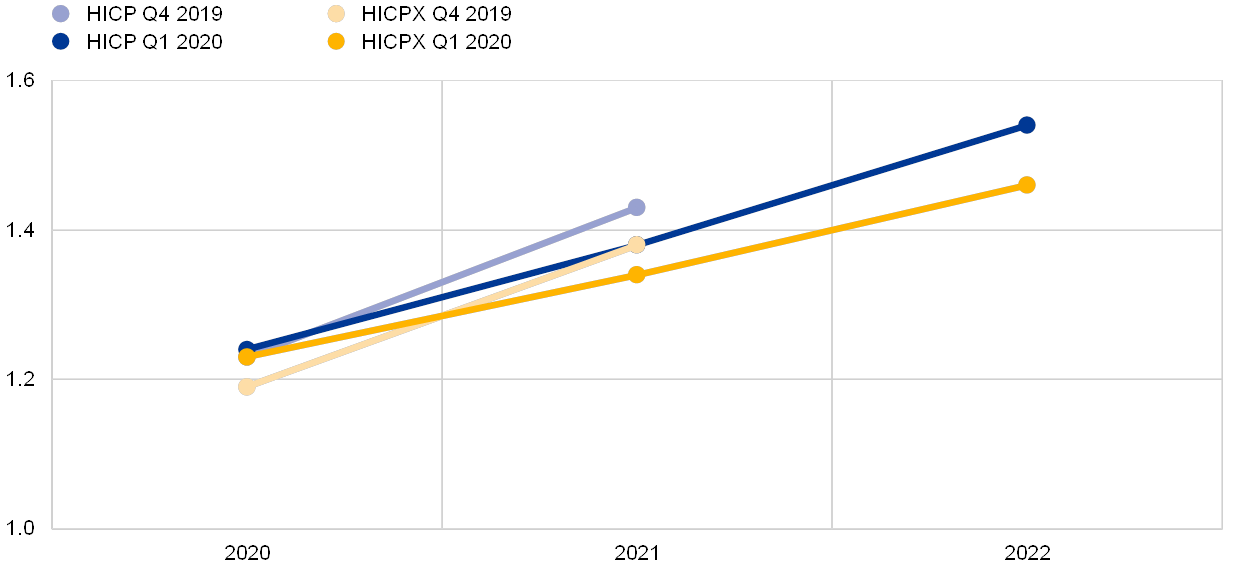
SPF respondents did not materially change their inflation expectations compared with the previous round for the period 2020-21. Averages of SPF respondents’ point forecasts for annual HICP inflation stand at 1.2%, 1.4% and 1.5%, for 2020, 2021 and 2022, respectively (see Chart 1). This essentially unchanged profile followed four successive rounds of downward revisions (between the Q4 2018 and Q4 2019 rounds). Although respondents slightly increased their oil price assumptions (owing to recent geopolitical developments in the Middle East), they reported that the main factors underlying their forecasts remain the same as in the previous survey round. More specifically, they continue to expect a pickup in underlying inflation reflecting higher labour costs. However, this pickup will be gradual in part owing to the modest nature of expected economic growth but also due to more structural forces such as competition and technological developments. The upward profile of expected inflation, although slightly flatter, is similar to forecasts published in previous surveys (see Table 1).
Expectations for inflation excluding energy, food, alcohol and tobacco (HICPX) were also largely unchanged for 2020 and 2021, and continue to imply a gradual upward movement (see Chart 1). A number of SPF respondents considered the recent increase in actual HICPX outcomes to be supportive of the expectation that underlying inflation would rise but, as with overall HICP inflation, that it would only do so very gradually. Many attributed the expected increase in HICPX inflation to wage growth but noted that wage developments were still relatively modest and wage pressures may have eased back, reflecting slower economic growth dynamics in 2019.
Chart 1
Inflation expectations: overall HICP and HICP excluding energy, food, alcohol and tobacco
(annual percentage changes)
Respondents reported perceptions of reduced overall uncertainty, but considered that the balance of risks remains to the downside. In their responses to a special topical question on the issue[2], SPF respondents indicated that overall uncertainty has decreased mainly reflecting developments in the United Kingdom and in US-China trade discussions. For the latter, the phase one deal was seen as defusing tensions somewhat and halting, for now, a further escalation of measures. For the former, many respondents noted that while the immediate risk of a disorderly Brexit had been avoided, considerable uncertainty remains about the nature of any agreement on the future EU-UK relationship. One area where respondents perceived increased uncertainty is the geopolitical situation in the Middle East. Generally, however, respondents’ baseline scenarios do not anticipate further material escalations in the conflict between the United States and Iran. These qualitative assessments are confirmed by quantitative indicators of uncertainty derived from the reported probability distributions, the standard deviations of which decreased in the Q1 2020 round (see Chart 2).
Chart 2
Aggregate expected probability distributions for inflation in 2020, 2021 and 2022
(x-axis: HICP inflation expectations, annual percentage changes; y-axis: probability, percentages)
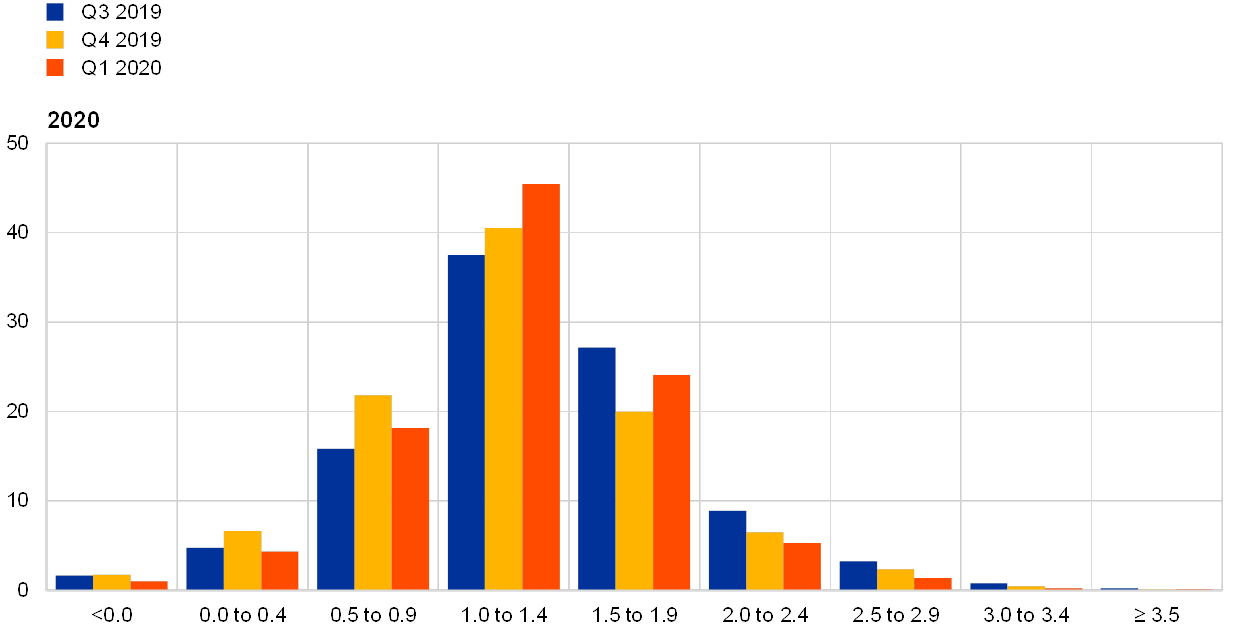
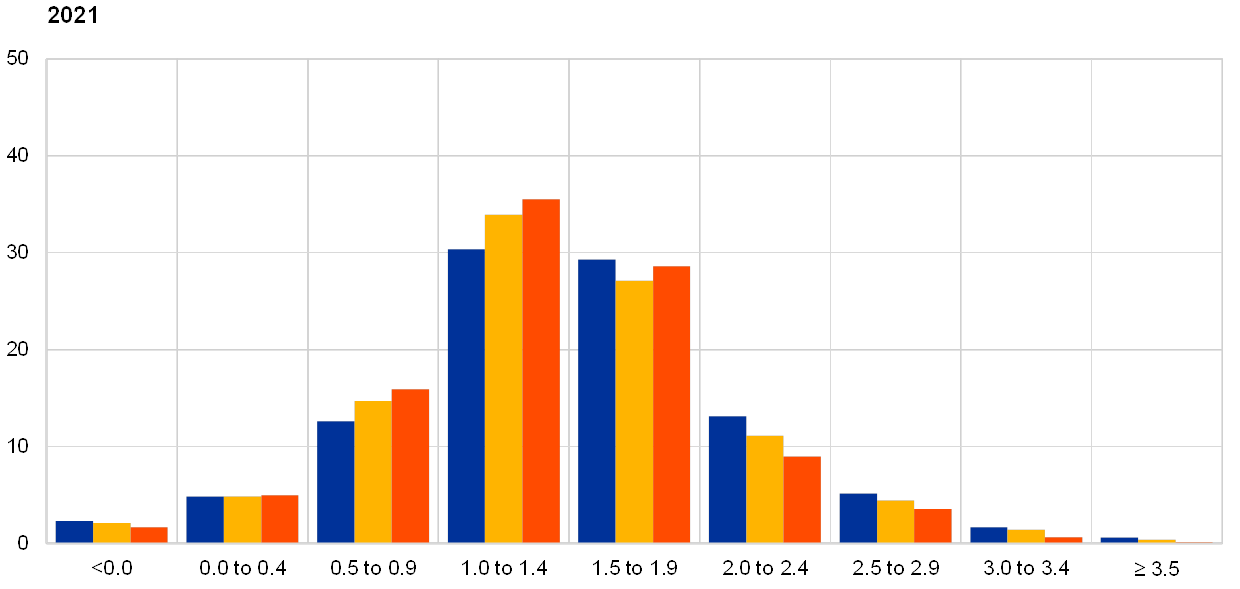
Note: The SPF asks respondents to report their point forecasts and to separately assign probabilities to different ranges of outcomes. This chart shows the average probabilities they assigned to different ranges of inflation outcomes in 2020, 2021 and 2022.
2 Longer-term inflation expectations unchanged at 1.7%
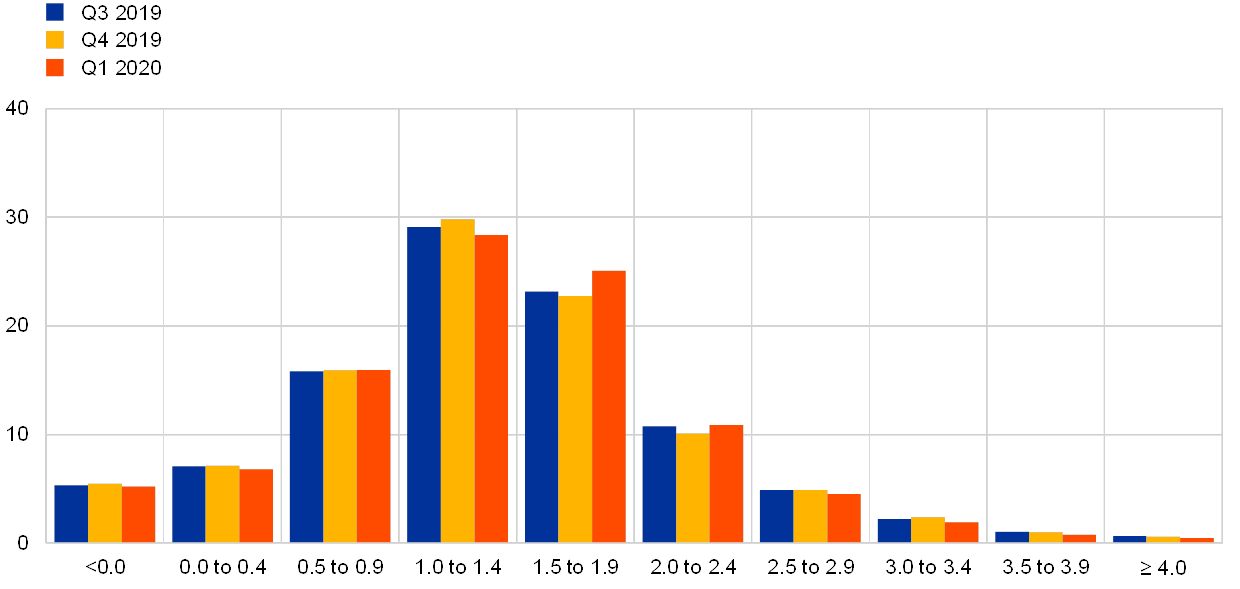
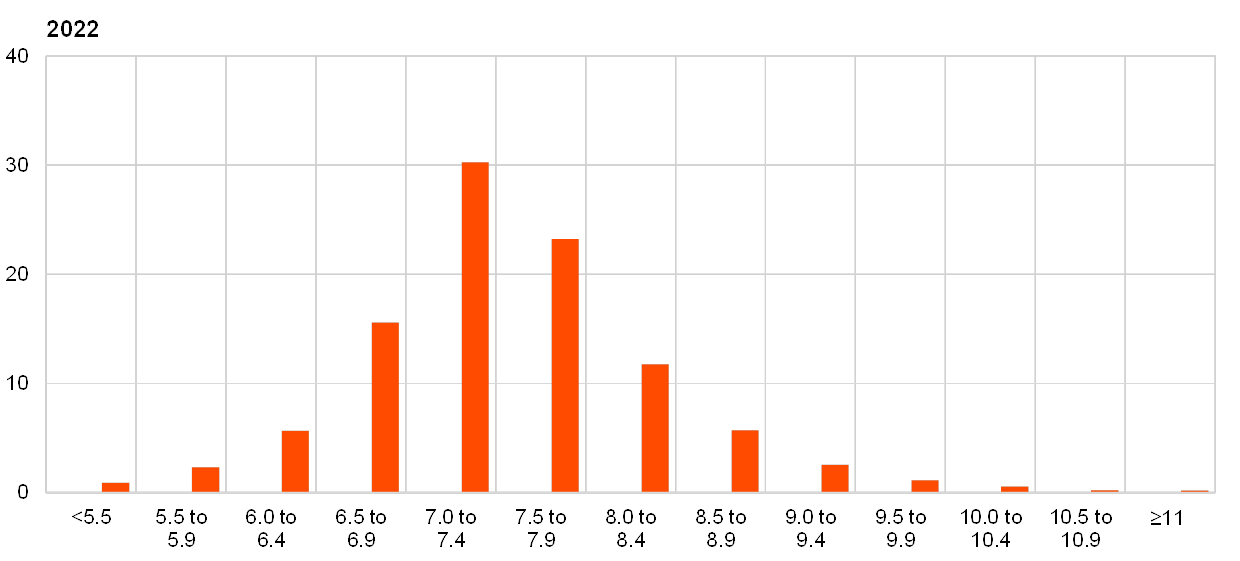
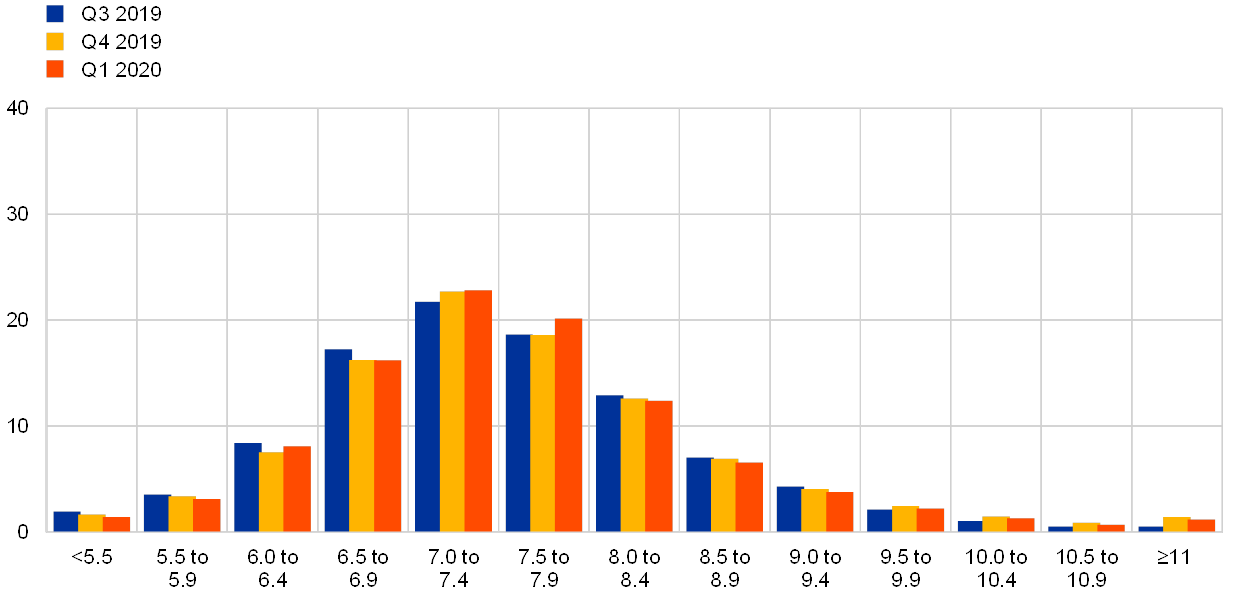
The average point forecast for inflation in the longer-term (2024) remained largely unchanged at 1.7%. Other summary statistics – namely the median point forecast and the mean of the aggregate probability distribution – were also unchanged, standing at 1.7% and 1.6%, respectively (see Chart 3). The distribution of individual point forecasts was largely unchanged from that observed in the previous round (see Chart 4). Thus, compared with the historically observed pattern, a relatively large portion of respondents again reported longer-term inflation expectations of 1.5% and 1.6%. There was a drop in the number of respondents reporting 1.9% or 1.8%. Of the 39 respondents who reported longer-term inflation expectations in the Q1 2020 and Q4 2019 SPF rounds, 25 reported unchanged expectations, seven revised their expectations up and seven revised their expectations down. The longer-term expectations for HICP inflation excluding energy, food, alcohol and tobacco (HICPX) also remained largely unchanged and, in aggregate, continued to stand at 1.6%.
Chart 3
Longer-term inflation expectations
(annual percentage changes)
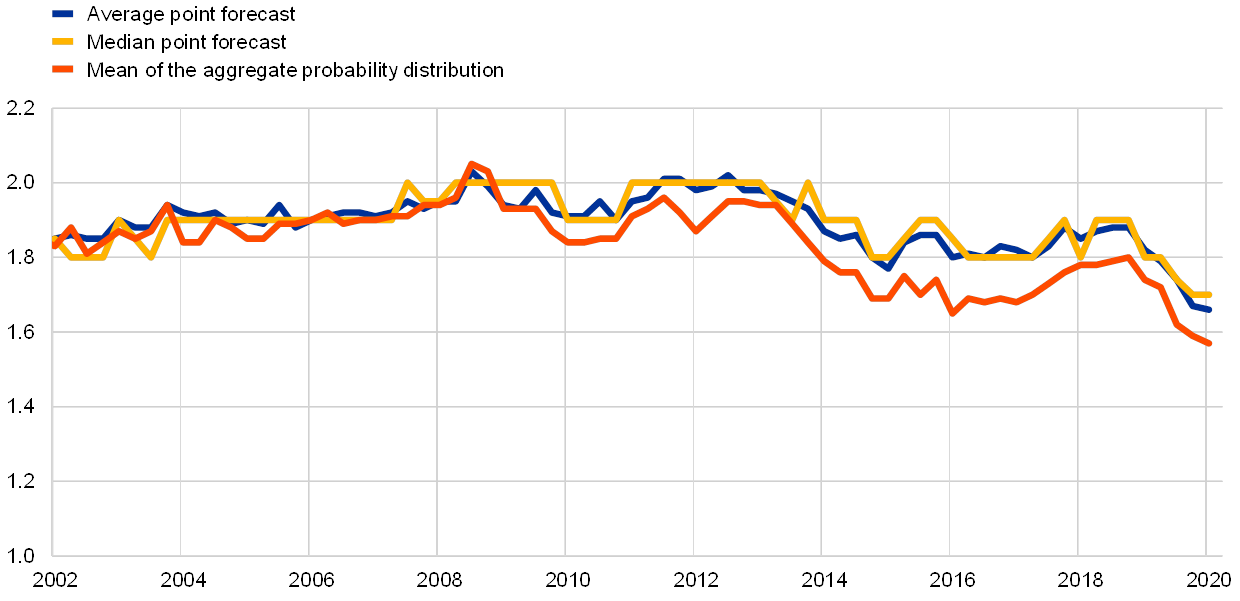
Chart 4
Distribution of point expectations for HICP inflation in the longer term
(x-axis: HICP longer-term inflation expectations, annual percentage changes; y-axis: percentages of respondents)
Notes: The SPF asks respondents to report their point forecasts and to separately assign probabilities to different ranges of outcomes. This chart shows the spread of point forecast responses.
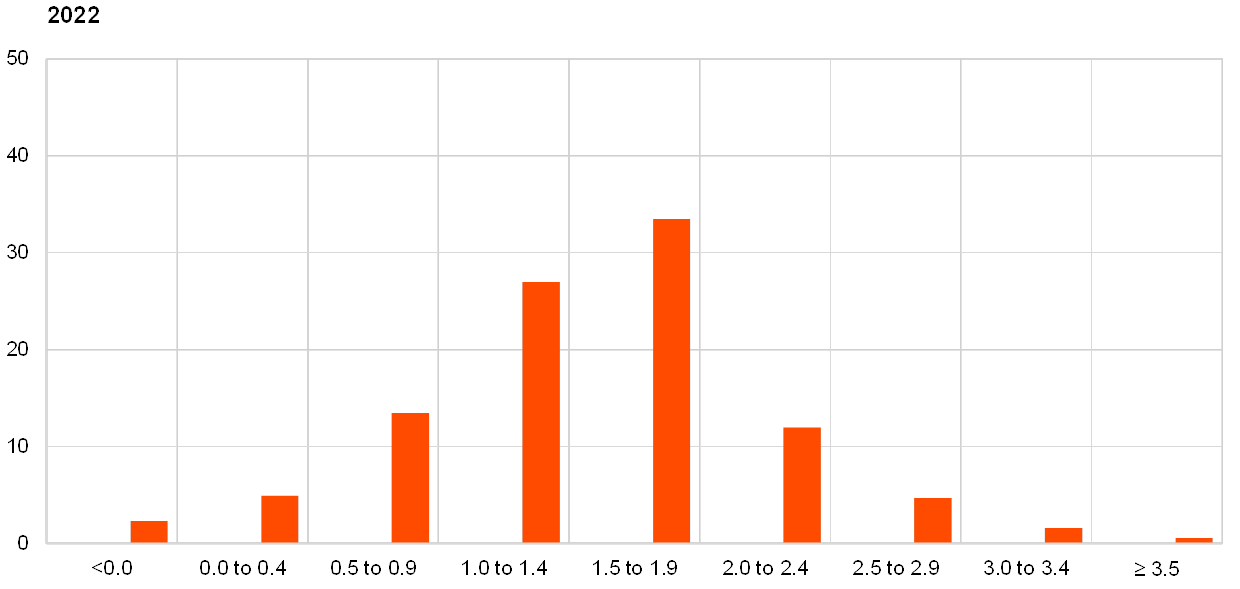
Perceptions of overall uncertainty surrounding longer-term expectations moved down slightly, but the balance of risks remains to the downside. In line with their overall assessment that near-term uncertainty has decreased, the width of forecasters’ probability distributions for inflation in the longer term also moved down slightly from the elevated levels they had reached in Q4 2019. The balance of risks remained to the downside, as has been the case since the global financial crisis; this measure has, however, recovered somewhat from the lows seen over the 2016-2017 period. The probability associated with longer-term inflation being negative (i.e. <0.0%) eased back slightly (to 2.6% from 2.9% – see Chart 5) but remained above its historical average of 1.0%.
Chart 5
Aggregate probability distribution of longer-term inflation expectations
(x-axis: HICP inflation expectations, annual percentage changes; y-axis: probability, percentages)
Notes: The SPF asks respondents to report their point forecasts and to separately assign probabilities to different ranges of outcomes. This chart shows the average probabilities they assigned to different ranges of inflation outcomes in the longer term.
3 GDP growth expectations broadly unrevised across all horizons
SPF GDP growth expectations remained broadly unchanged standing at 1.1% for 2020, 1.2% for 2021 and at 1.4% for 2022 (see Chart 6). These expectations imply a small upward revision of 0.1 percentage points for 2020 and a downward revision of 0.1 percentage points for 2021. Longer-term growth expectations (which refer to 2024) remained stable at 1.4%. The respondents who revised up their growth forecasts for 2020 largely explained their revisions with reference to the recent reduction, but not removal, of trade uncertainty following the passing of the UK withdrawal agreement and the signing of the US-China phase one deal, and recent improvement in economic indicators, in particular leading ones. Most respondents are interpreting this as a sign of a bottoming out of the recent slowdown. On the other hand, among those who revised down, the weakness of the manufacturing sector and the possibility of spillover to the services sector was mentioned. Looking ahead, most SPF respondents’ baseline scenarios broadly expect that the euro area will return to moderate growth rates over the medium term, supported by monetary and fiscal policy and driven by positive private consumption and positive – albeit slowing – business investment. While trade uncertainty has been somewhat reduced, net trade is expected to, at best, have a neutral effect on growth. For 2020, the latest SPF results are more optimistic than those published in the Consensus Economics and Euro Zone Barometer surveys (see Table 1).
Chart 6
Expectations for real GDP growth
(annual percentage changes)
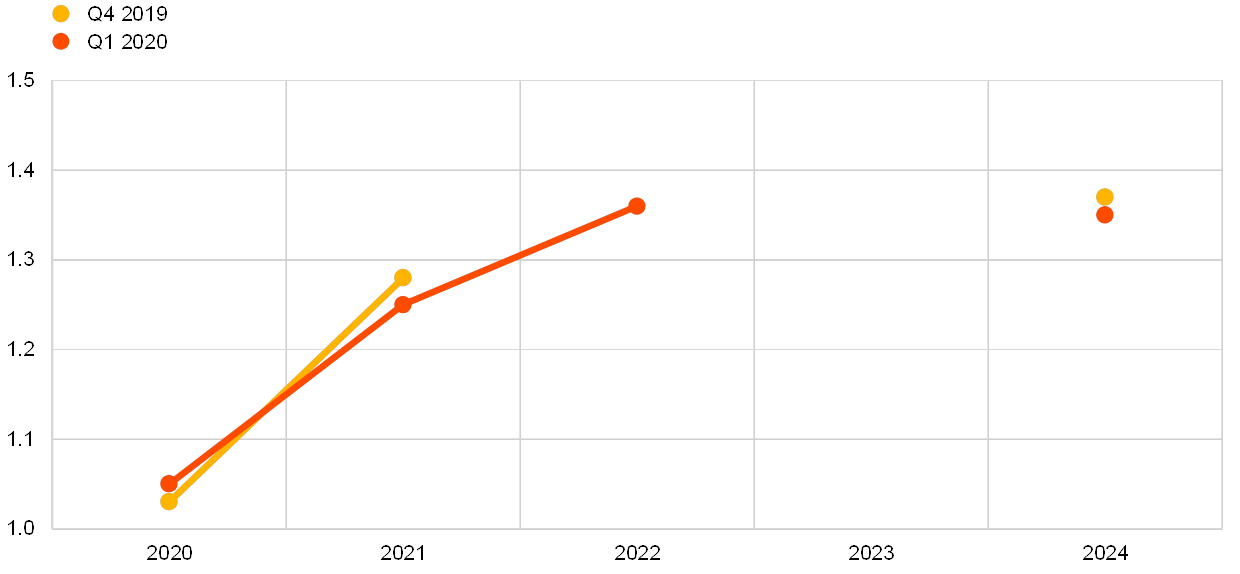
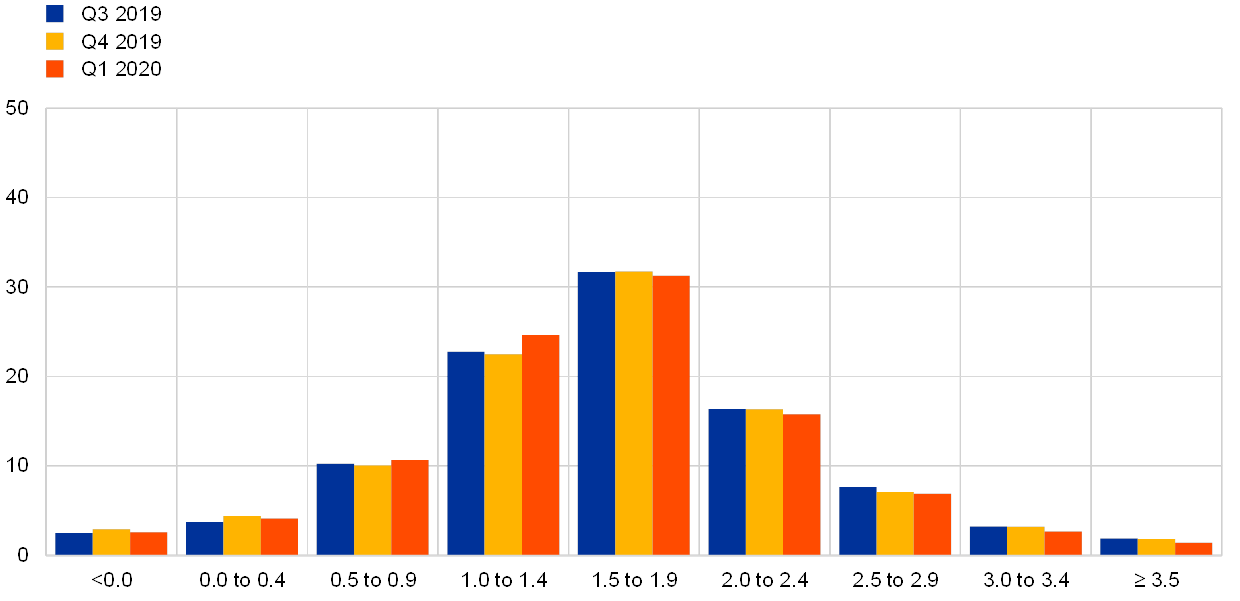
Chart 7
Aggregate probability distributions for GDP growth expectations for 2020, 2021 and 2022
(x-axis: real GDP growth expectations, annual percentage changes; y-axis: probability, percentages)
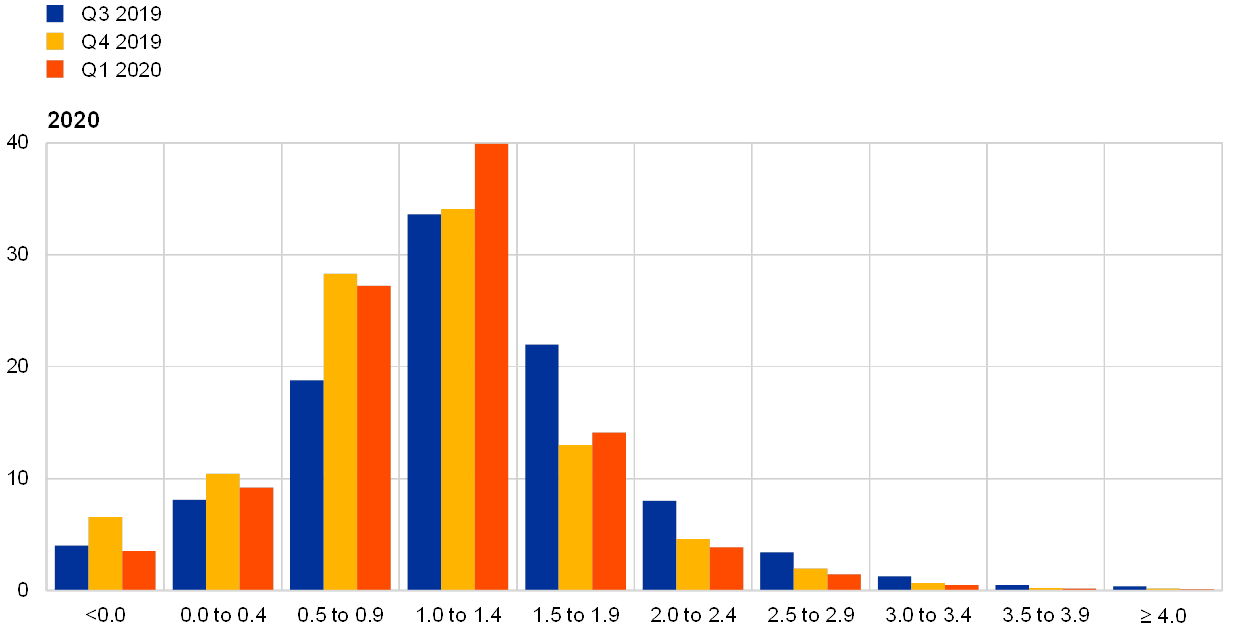
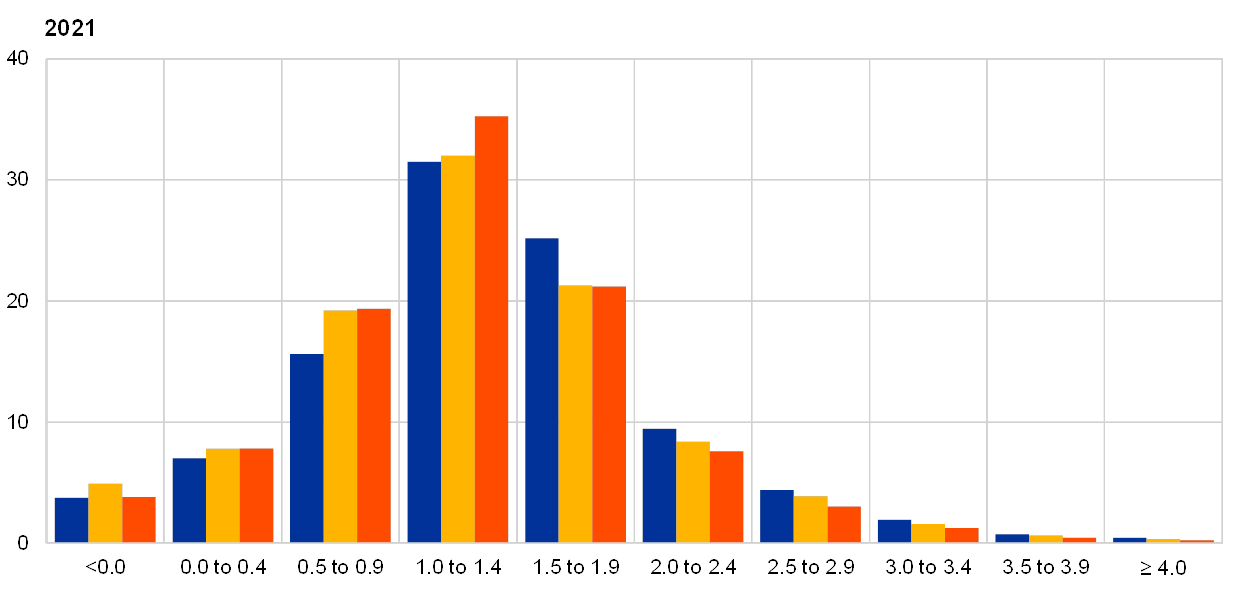
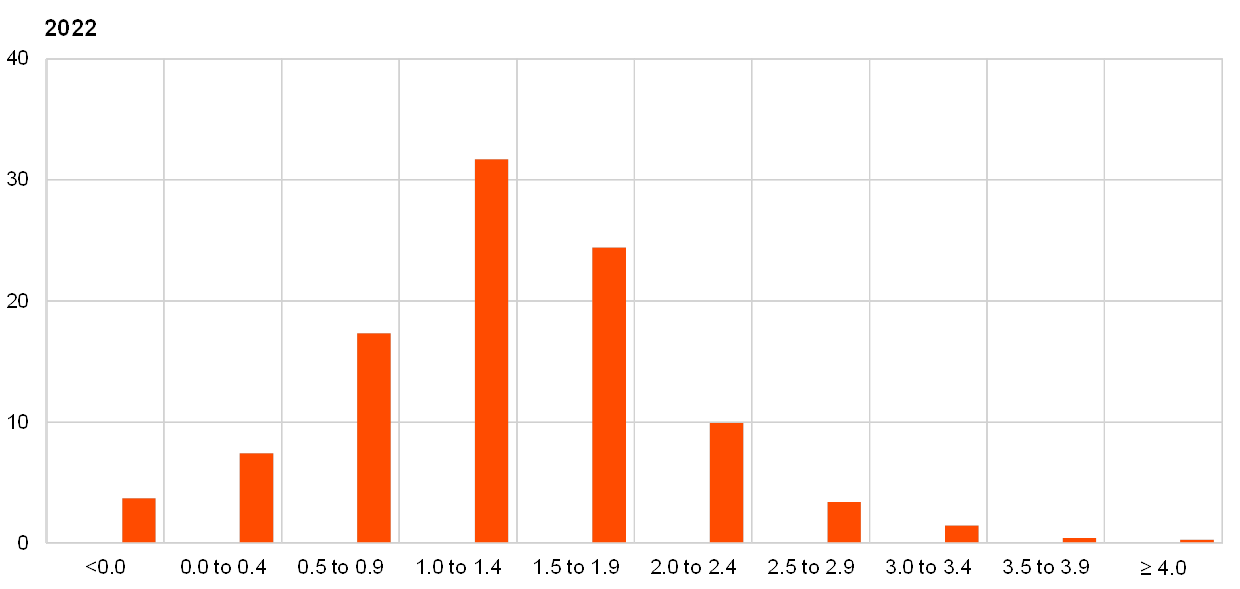
Notes: The SPF asks respondents to report their point forecasts and to separately assign probabilities to different ranges of outcomes. This chart shows the average probabilities they assigned to different ranges of real GDP growth outcomes in 2020, 2021 and 2022.
Perceived uncertainty has declined but respondents’ risk assessments – based on their qualitative comments – remained, on balance, to the downside. Many of the cited risks stem from external factors. Despite the perceived reduction in uncertainty regarding global trade and Brexit, the impacts of a further escalation of the trade conflict between the United States and China, alongside a possible increase of tariffs on car imports from the EU, continue to be the most cited downside risk. As the second-most mentioned downside risk, many respondents continued to reference a disorderly Brexit, noting that while this risk had been averted for now, it could yet occur at a later stage. Following the recent tensions between the United States and Iran, a number of forecasters are concerned about a further escalation and the possible effects that this might have on the price of oil. A few forecasters mentioned upside risks, which reflected early resolution of the trade conflicts. On the domestic side, some respondents saw a risk in the continued weakness of the automotive industry, suggesting that the current weakness in the European manufacturing sector spills over to domestic demand. On the upside, some forecasters mentioned higher activity due to a larger-than-expected fiscal stimulus in the euro area. Considering the reported aggregate probability distributions in more detail (see Chart 7 and Chart 8), respondents continued to assign the highest likelihood to outcomes between 1.0% and 1.4% for all horizons. For 2020 and 2021, there was a narrowing of the probability distributions, with increases of the probability in the range 1.0-1.4%, while the probabilities for outcomes toward the tails of the distributions (both to the downside and upside) decreased slightly. Probabilities of low growth (for example, less than 1.0%), while decreasing slightly, still stand at relatively elevated levels for both horizons. For the longer-term forecast, a slightly higher probability than in the previous survey was assigned to outcomes of 1.5% or higher (44% compared to 42%).
Chart 8
Aggregate probability distribution for longer-term GDP growth expectations
(x-axis: real GDP growth expectations, annual percentage changes; y-axis: probability, percentages)
Note: The SPF asks respondents to report their point forecasts and to separately assign probabilities to different ranges of outcomes. This chart shows the average probabilities they assigned to different ranges of real GDP growth outcomes in the longer term.
4 Unemployment rate expectations largely unchanged
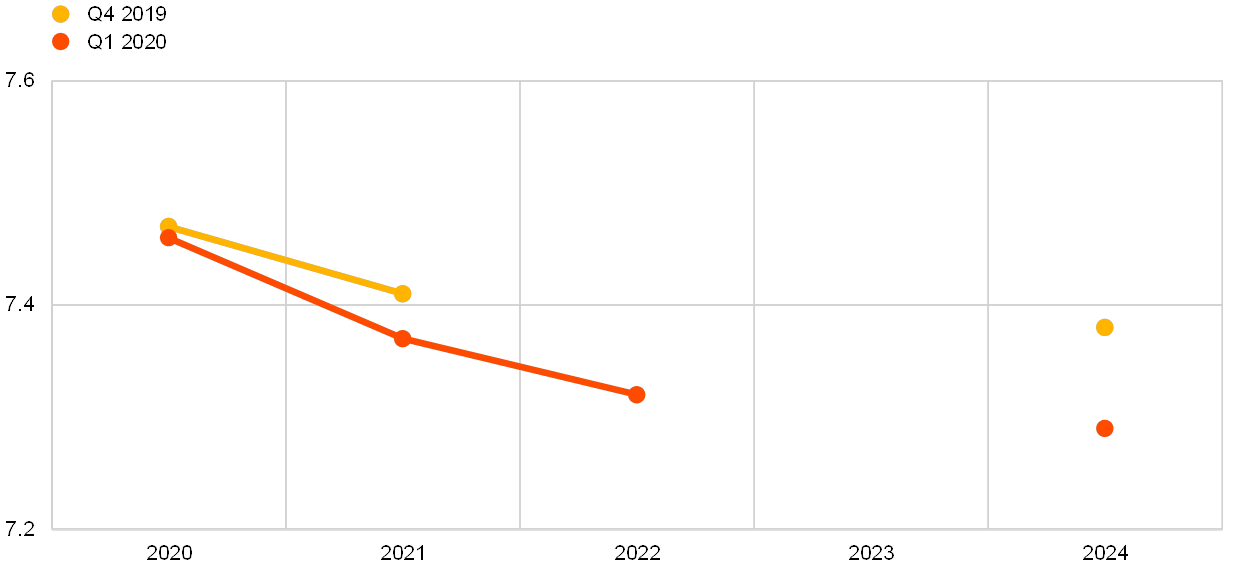
Respondents continue to expect a slight decline in the unemployment rate (see Chart 9). The euro area unemployment rate is forecast to decline gradually from 7.5% in 2020 to 7.3% by 2022. The average longer-term forecast (for 2024) was revised down by 0.1 percentage points to just below 7.3%. SPF respondents noted that the pace of decline in the euro area unemployment rate has levelled off in 2019, reflecting the slowdown in growth dynamics and employment creation. Nonetheless they expect that, as economic growth picks up, the euro area unemployment rate will resume a downward movement.
Chart 9
Expectations for the unemployment rate
(percentages of the labour force)
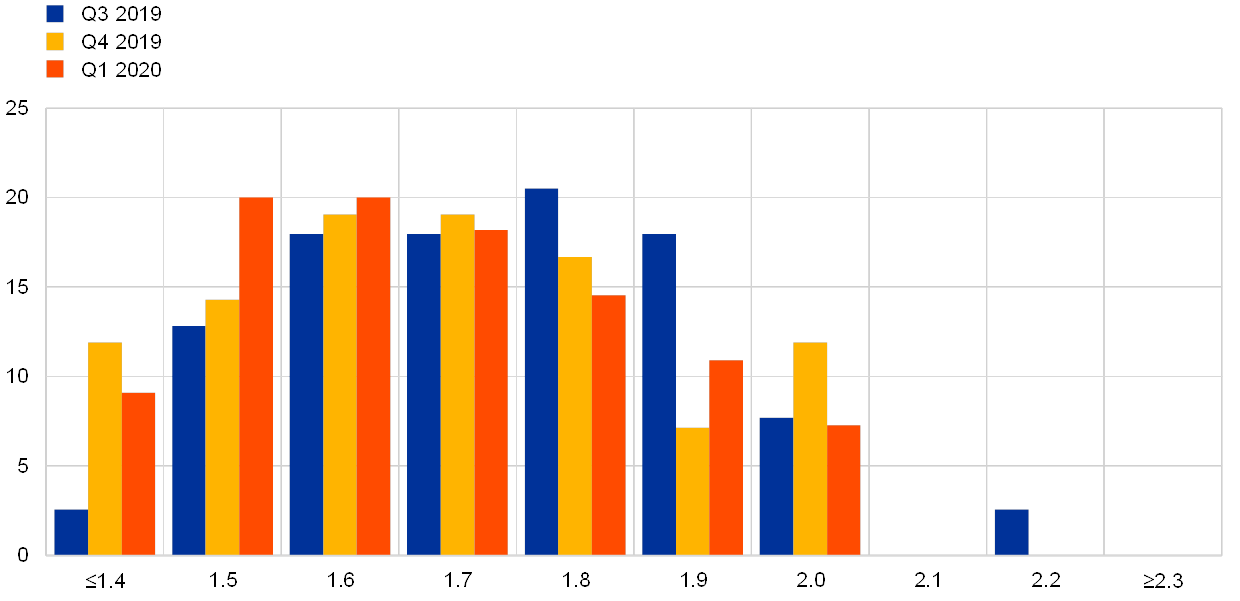
Uncertainty surrounding unemployment rate expectations eased back. Having reached historical highs in the previous (Q4 2019) SPF round, forecasters’ uncertainty about the unemployment rate in the future (as measured by the average width or standard deviations of the reported probability distributions) declined across all horizons. Nonetheless, across all horizons, the probability distributions remained skewed toward higher unemployment rate outcomes, indicating that the perceived balance of risks is to the upside (see Chart 10 and Chart 11).
Chart 10
Aggregate probability distributions for the unemployment rate in 2020, 2021 and 2022
(x-axis: unemployment rate expectations, percentages of the labour force; y-axis: probability, percentages)
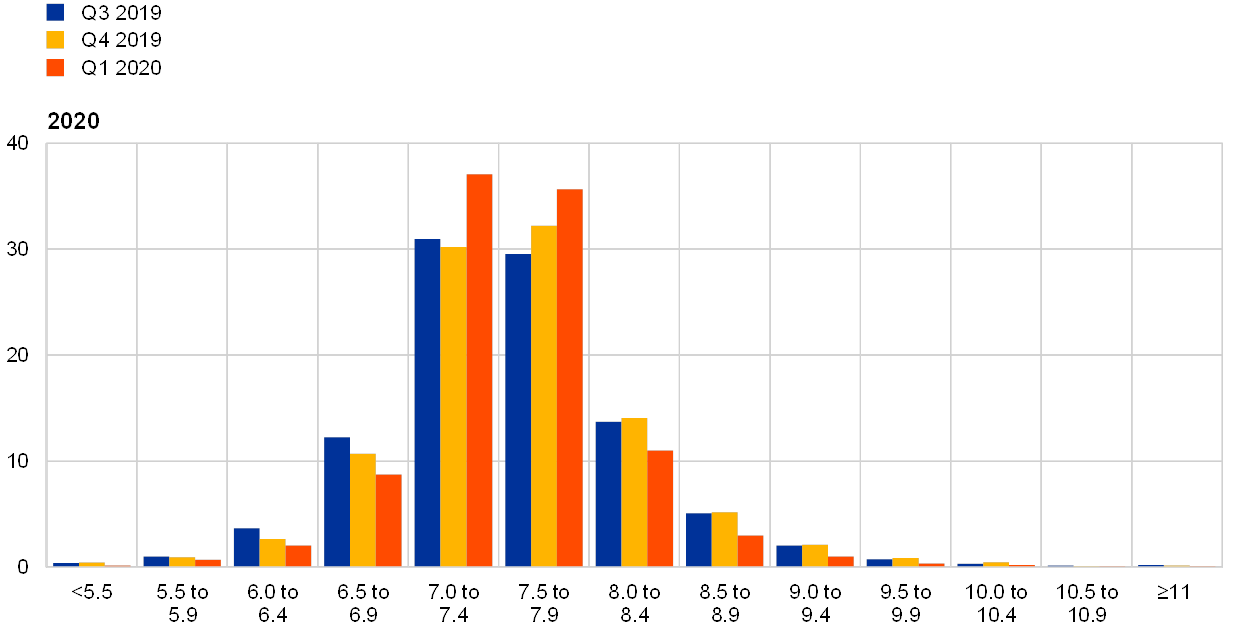
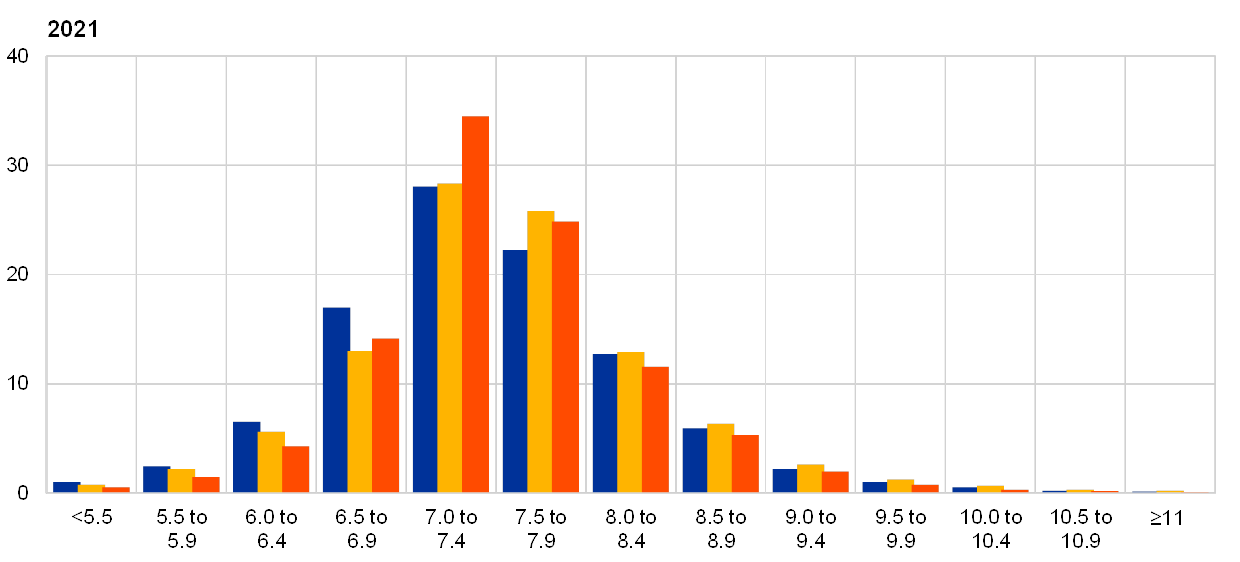
Notes: The SPF asks respondents to report their point forecasts and to separately assign probabilities to different ranges of outcomes. This chart shows the average probabilities they assigned to different ranges of unemployment rate outcomes for 2020, 2021 and 2022.
Chart 11
Aggregate probability distribution for the unemployment rate in the longer term
(x-axis: unemployment rate expectations, percentages of the labour force; y-axis: probability, percentages)
Notes: The SPF asks respondents to report their point forecasts and to separately assign probabilities to different ranges of outcomes. This chart shows the average probabilities they assigned to different ranges of unemployment rate outcomes in the longer term.
5 Expectations for other variables
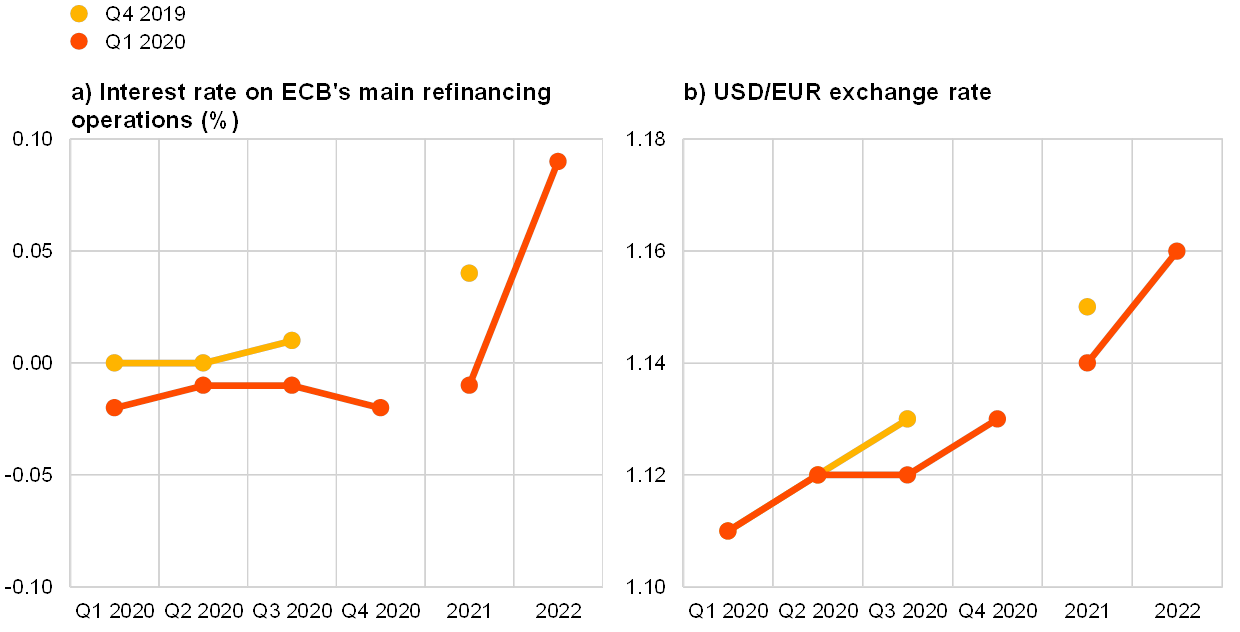
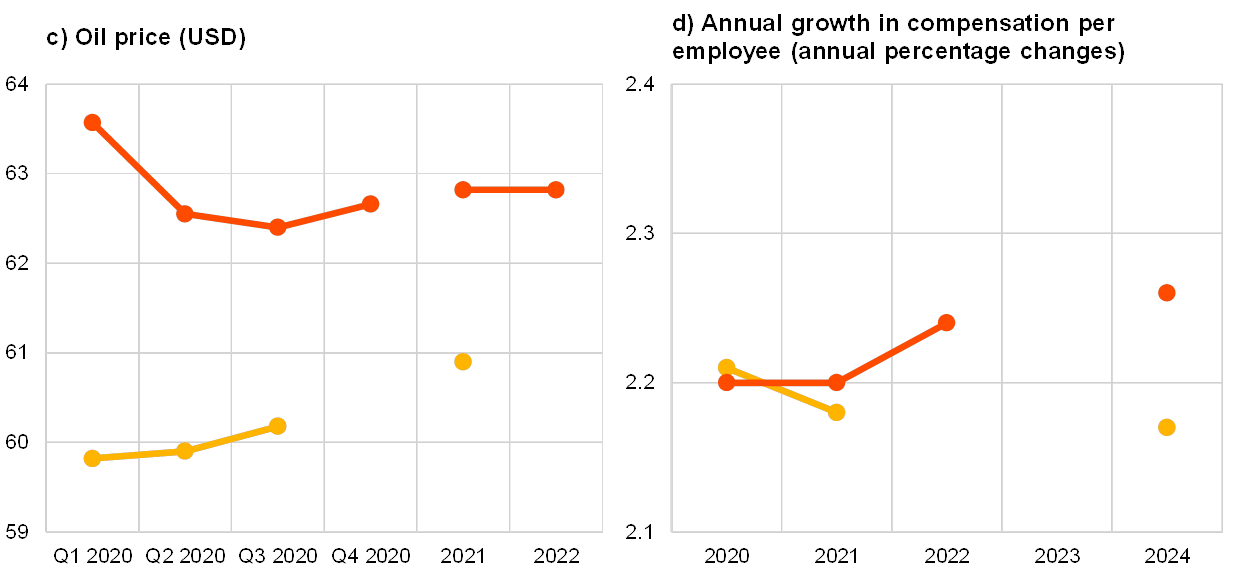
Respondents’ average expectations were for: USD oil prices to remain broadly unchanged at around USD 63 per barrel until 2022; the euro to appreciate slowly against the dollar until 2022; the ECB’s main refinancing rate to start lifting slightly off the zero lower bound only in 2022; and wage growth to be in the range 2.2-2.3% over the entire forecast horizon.
The mean expectation for the rate on the ECB’s main refinancing operations was for it to remain around 0% in 2020 and 2021 before increasing marginally in 2022. This implies a later pickup than forecast in the previous round (see panel (a) of Chart 12).
The average expected USD/EUR exchange rate was largely unchanged from the previous round and it is expected to appreciate marginally from around 1.12 in 2020, to 1.14 in 2021 and further to 1.15 in 2022 (see panel (b) in Chart 12).
US dollar-denominated oil prices (per barrel) remain broadly stable at around USD 63 over the period 2020-2022. This implies that forecasters now expect prices to be around 5% higher on average than expected in the Q4 2019 survey (see panel (c) of Chart 12). Given the largely unchanged forecasts for the USD/EUR exchange rate, these results imply a profile for the oil price in euro that is also around 5% higher relative to the previous survey.
On average, expected annual growth in compensation per employee was in the range 2.2-2.3% over the period 2020-22, largely unchanged when compared with the Q4 2019 survey (see panel (d) of Chart 12).
Chart 12
Expectations for other variables
6 Annex (chart data)
Excel data for all charts can be downloaded here.
© European Central Bank, 2020
Postal address 60640 Frankfurt am Main, Germany
Telephone +49 69 1344 0
Website www.ecb.europa.eu
All rights reserved. Reproduction for educational and non-commercial purposes is permitted provided that the source is acknowledged.
For specific terminology please refer to the ECB glossary (available in English only).
PDF ISSN 2363-3670, QB-BR-20-001-EN-N
HTML ISSN 2363-3670, QB-BR-20-001-EN-Q
- The survey was conducted between 7 and 13 of January 2020; 72 responses were received. Participants were provided with a common set of the latest available data for annual HICP inflation (December 2019 flash estimates: all items, 1.3%; excluding energy, food, alcohol and tobacco, 1.3%), annual GDP growth (Q3 2019, 1.2%) and the unemployment rate (November 2019, 7.5%).
- Respondents were asked “Please elaborate on how you think economic uncertainty (e.g. related to Brexit post UK election, trade tensions/agreements or geopolitical risks) has evolved recently and what impact this has on your outlook for real GDP growth and inflation. Do you incorporate such impacts in your baseline forecasts, the probability distributions around such baselines, or both?”