
The ECB Survey of Professional Forecasters (SPF) – Third quarter of 2018
Summary
The results of the ECB Survey of Professional Forecasters (SPF) for the third quarter of 2018 show average inflation expectations of 1.7% for each of 2018, 2019 and 2020.[1] Compared with the previous survey, this represents upward revisions to 2018 and 2019, attributable to oil price developments. Average longer-term inflation expectations (which refer to 2023) remained stable at 1.9%. Expectations for real GDP growth were revised down a little in the near term to stand at 2.2%, 1.9% and 1.6% for 2018, 2019 and 2020, respectively. Expectations for real GDP growth in the longer term remained at 1.6%. Unemployment rate expectations were unchanged for 2018 and 2019, but revised upwards slightly further out.
Table 1
Results of the SPF in comparison with other expectations and projections
(annual percentage changes, unless otherwise indicated)

1) Longer-term expectations refer to 2023 for the Q3 2018 SPF and Consensus Economics and to 2022 for the Q2 2018 SPF and the Euro Zone Barometer.
2) As a percentage of the labour force.
1 Expectations for HICP inflation revised upwards on account of oil; underlying inflation expectations unchanged
The results of the survey for the third quarter of 2018 show average inflation expectations of 1.7% for each of 2018, 2019 and 2020 (see Chart 1). Compared with the previous survey, this represents upward revisions of 0.2 percentage points (p.p.) for 2018 and 0.1 p.p. for 2019, while expectations for 2020 were unchanged. In their qualitative comments, respondents typically attributed their upward revisions to the higher oil price, which had, to an extent, already been reflected in the most recent HICP data. The latest SPF results for inflation over the period 2018-2020 are comparable with the expectations reported in other surveys (see Table 1).
Average expectations for inflation excluding energy and food were unchanged at 1.2%, 1.5% and 1.7% for 2018, 2019 and 2020, respectively. This pick-up in core inflation remained underpinned by a pick-up in annual growth in compensation per employee, which was expected to increase to 2.3% by 2020. Consensus Economics introduced core inflation to their survey (for 2018 and 2019) in June, and the results of this SPF are comparable with those reported there.
Chart 1
Inflation expectations: overall HICP and HICP excluding food and energy
(annual percentage changes)

The probability distributions for inflation at the different horizons tilted to the right, as probabilities were revised downwards for lower inflation outcomes and upwards for higher inflation outcomes. The changes in reported probabilities were most pronounced for the two probability ranges either side of the central range: there was a decrease in the probability assigned to inflation outcomes in the 1.0%-1.4% range for each of 2018, 2019 and 2020, compared with an increase for outcomes in the 2.0%-2.4% range in those years (see Chart 2). In contrast, there was little change in the probabilities assigned to more extreme inflation outcomes, captured in the upper and lower tails of the distributions. Less than 1% probability was assigned to deflation outcomes in 2018, 2019 and 2020.
Chart 2
Aggregate probability distribution for inflation expectations for 2018, 2019 and 2020


Note: The SPF asks respondents to report their point forecasts and to separately assign probabilities to different ranges of outcomes. This chart shows the average probabilities they assigned to inflation outcomes in 2018, 2019 and 2020.
2 Longer-term inflation expectations stable at 1.9%
The average point forecast for longer-term inflation expectations remained unchanged at 1.9%. The proportion of forecasters reporting a longer-term expectation of 1.9% increased, such that this became the most-frequently reported value (see Chart 3). The proportion of respondents reporting 2.0% also increased, as did the proportion reporting 1.6% and 1.7%, albeit to a lesser extent. Thus the average of all responses was little changed from the previous survey. The median point forecast remained at 1.9%, and the mean of the aggregate probability distribution was unchanged at 1.8% (see Chart 4). Overall, these three measures indicate that longer-term inflation expectations have recovered somewhat from the low rates recorded in 2016, but have not yet fully returned to their pre-crisis rates.
Chart 3
Distribution of point expectations for HICP inflation in the longer term
(percentages of respondents)

Note: The SPF asks respondents to report their point forecasts and to separately assign probabilities to different ranges of outcomes. This chart shows the spread of point forecast responses.
Chart 4
Longer-term inflation expectations
(annual percentage changes)

The probability assigned to low inflation outcomes decreased further. The probability assigned to inflation outcomes below 1.5% decreased, while that for inflation in the range 1.5% to 1.9% increased (see Chart 5).
Chart 5
Aggregate probability distribution of longer-term inflation expectations

Note: The SPF asks respondents to report their point forecasts and to separately assign probabilities to different ranges of outcomes. This chart shows the average probabilities they assigned to inflation outcomes in the longer term.
The perceived balance of risks to expected inflation in the longer term remained to the downside. The asymmetry of a forecast distribution is indicative of the balance of risks that the forecast embodies. In the context of the SPF, where probabilities are reported for discrete intervals, there are a number of alternative ways of measuring asymmetry. Furthermore, because the point forecast is reported separately from the distribution, these two pieces of information can be combined to derive a further indicator of the balance of risks, calculated as the mean of the aggregate probability distribution minus the average point forecast. These different measures all continued to point to a balance of risks that is to the downside.[2]
3 Real GDP growth expectations revised down for 2018 and 2019
Expectations for real GDP growth stood at 2.2%, 1.9% and 1.6% for 2018, 2019 and 2020, respectively. Compared with the previous survey round, this implies downward revisions of 0.2 p.p. for 2018 and 0.1 p.p. for 2019. Respondents’ qualitative comments mainly referred to mechanical effects on their 2018 forecasts, stemming from the weaker-than-expected data releases for real GDP in the first quarter of 2018 together with other indicators released subsequently. Looking beyond 2018, a few respondents mentioned higher oil prices and an increase in global uncertainty since the previous survey round as factors behind their downward revisions.
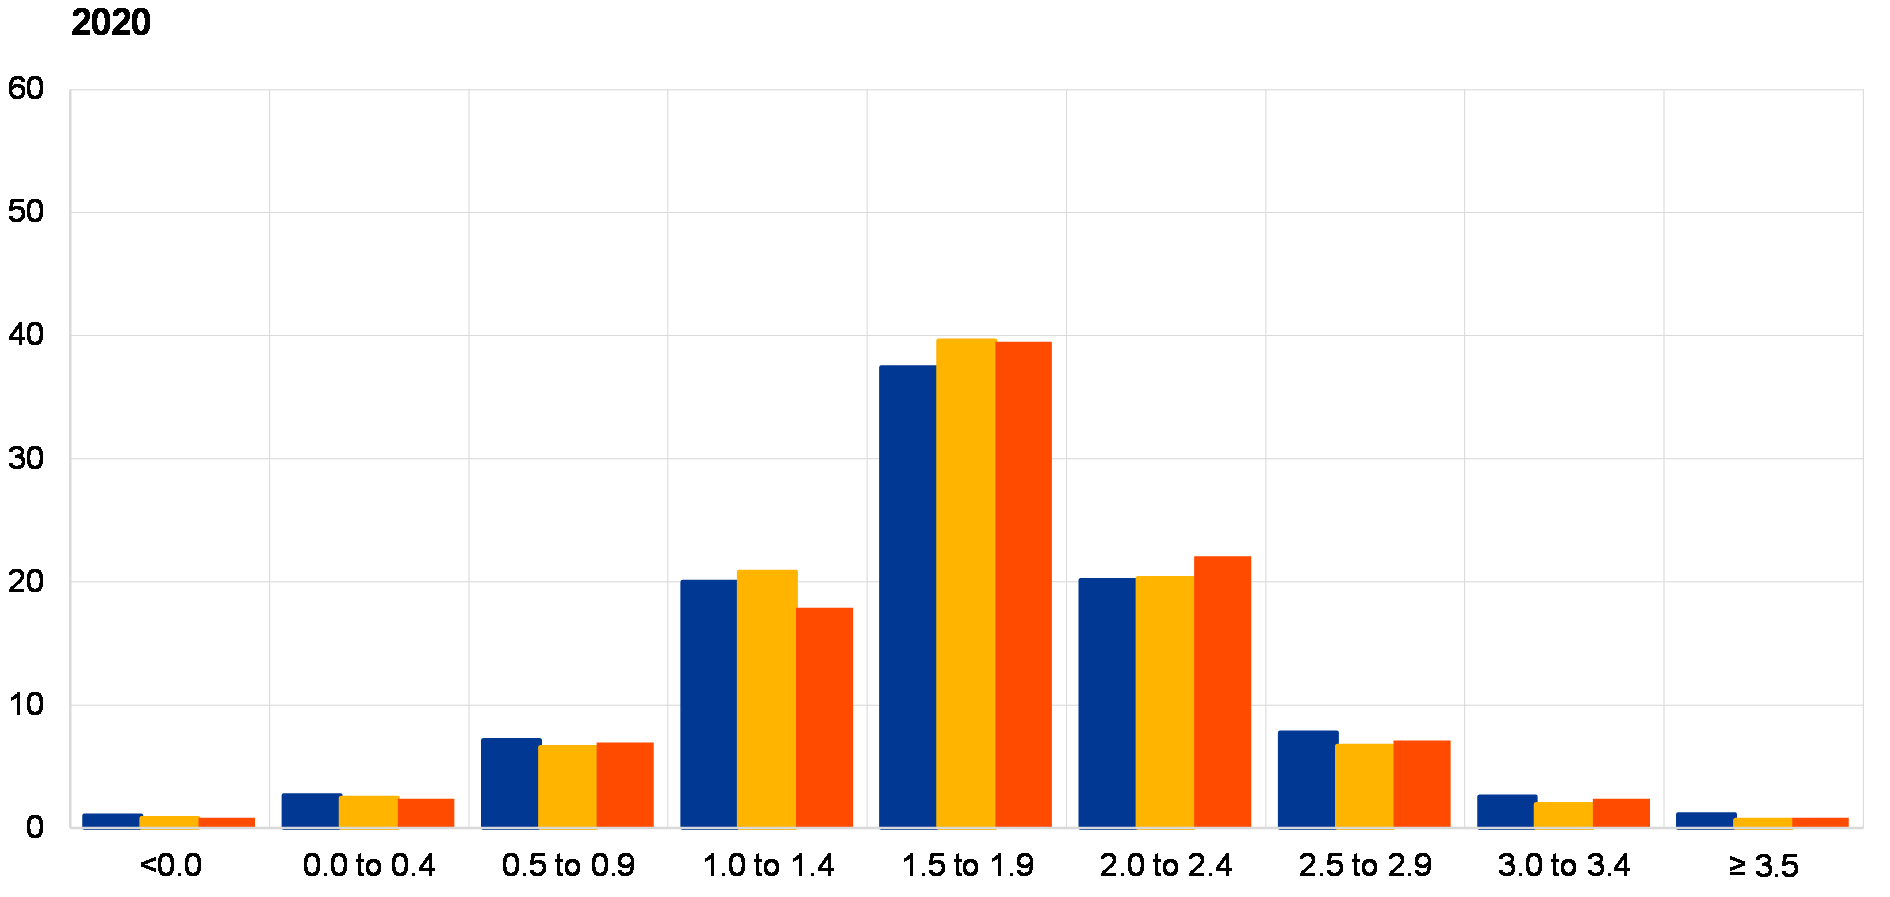
Movements in the reported probability distributions echoed those in point forecasts. Consistent with the pattern of revisions to point forecasts, the probability distributions for 2018, 2019 and 2020 moved towards lower GDP growth outcomes, with such revisions being larger the nearer the forecast horizon (see Chart 6).
Chart 6
Aggregate probability distribution for GDP growth expectations for 2018, 2019 and 2020


Note: The SPF asks respondents to report their point forecasts and to separately assign probabilities to different ranges of outcomes. This chart shows the average probabilities they assigned to real GDP growth outcomes in 2018, 2019 and 2020.
Longer-term growth expectations continued to stand at 1.6%. At this horizon, there was little change in the probability assigned to the central range (which spans real GDP growth outcomes of between 1.5% and 1.9%), while the probability assigned to outcomes below this increased from 37% to 40% and the probability assigned to outcomes above this decreased from 32% to 29% (see Chart 7).
Risks to real GDP growth were seen as being to the downside across all horizons. The share of respondents who cited downside risks in their qualitative comments increased relative to the previous survey round, whereas only a few respondents explicitly stated that they saw risks as balanced or to the upside. Quantitative measures of the asymmetry of the probability distributions also indicate that the balance of risks around GDP growth expectations was skewed to the downside across the horizons. The main downside risk reported related to the possibility of a further escalation of the trade conflict between the US and China, and its global implications.
Chart 7
Aggregate probability distribution for longer-term GDP growth expectations

Note: The SPF asks respondents to report their point forecasts and to separately assign probabilities to different ranges of outcomes. This chart shows the average probabilities they assigned to real GDP growth outcomes in the longer term.
4 Unemployment rate expectations little changed
The average point forecasts for the unemployment rate were 8.3%, 7.9% and 7.6% for 2018, 2019 and 2020, respectively. The results for 2018 and 2019 were unchanged from those reported in the previous survey, whereas for 2020 this represented an upward revision of 0.1 p.p. To two decimal places, though, the 2020 expectation was little changed. However, the reported probability distributions for 2018 and 2019 moved slightly towards higher unemployment rates, consistent with the movement in the probability distributions for GDP growth towards lower growth rates (see Chart 8). Many respondents explained in their qualitative comments that they expected the pace of decline to slow over the period 2018-2020 as the unemployment rate neared historical lows and an increasing skills mismatch became more of a limiting factor. Other reasons cited for a slowing in pace of the decline in the unemployment rate were increasing labour supply growth and a possible dampening effect on labour demand if wage increases were in excess of productivity gains. SPF unemployment rate expectations for the period 2018-2020 are broadly in line with those reported in other surveys.
Chart 8
Aggregate probability distribution for the unemployment rate in 2018, 2019 and 2020

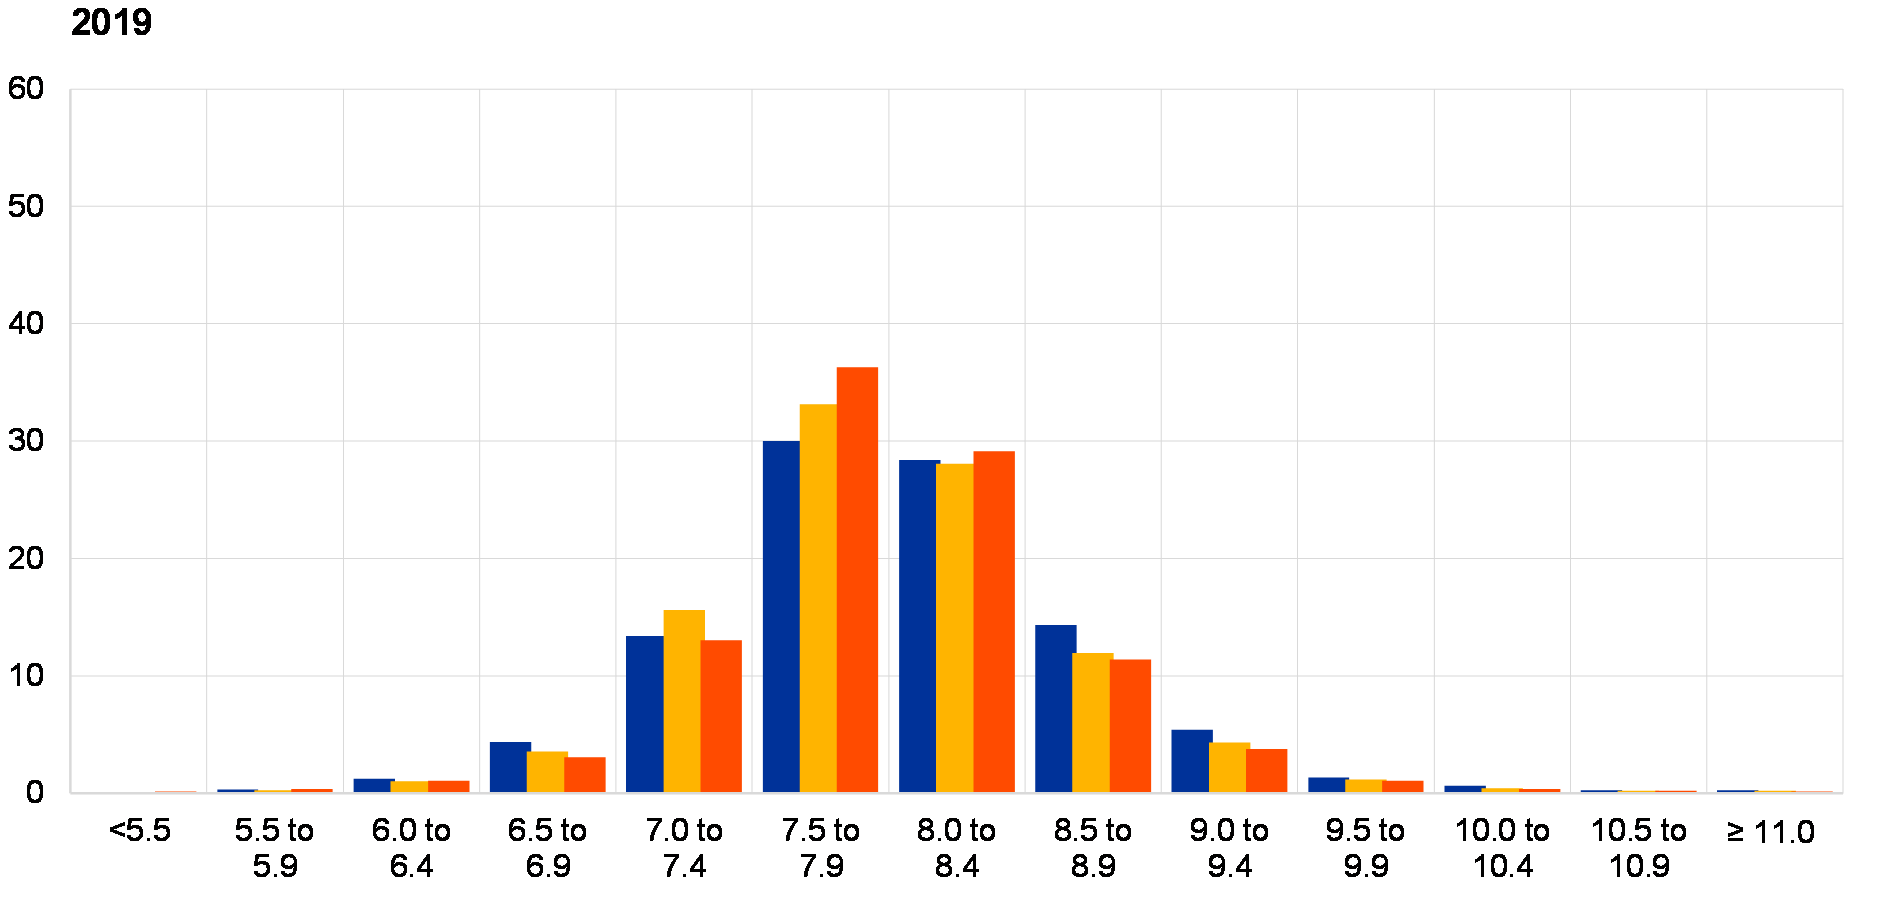

Note: The SPF asks respondents to report their point forecasts and to separately assign probabilities to different ranges of outcomes. This chart shows the average probabilities they assigned to unemployment rate outcomes for 2018, 2019 and 2020.
Longer-term unemployment rate expectations were revised up by 0.1 p.p. to 7.5%. As with the 2020 expectation, to two decimal places this result was little changed. At 7.2%, the longer-term unemployment rate reported in the June Euro Zone Barometer survey was lower than that reported in the SPF. The balance of risks to the longer-term unemployment rate remained skewed towards higher unemployment rate outcomes. Indeed, the probability assigned to outcomes greater than 8.0% increased, with some respondents explicitly stating that this change mirrored the downward revision in the balance of risks to growth (see Chart 9).
Chart 9
Aggregate probability distribution for the unemployment rate in the longer term

Note: The SPF asks respondents to report their point forecasts and to separately assign probabilities to different ranges of outcomes. This chart shows the average probabilities they assigned to unemployment rate outcomes in the longer term.
5 Expectations for other variables
Respondents’ average expectations were for: USD oil prices to keep decreasing until 2020; the euro to continue appreciating against the dollar until 2020; the ECB’s main refinancing rate to stay at zero until the first half of 2019; and labour cost growth to increase until 2020 and then decrease slightly.
The mean expectation for the rate on the ECB’s main refinancing operations was for it to remain around 0% in the near term, increasing a little to 0.14% in 2019 and then to 0.53% in 2020 (see panel (a) of Chart 10). The aggregate expectation for the near-term, quarterly profile was unchanged from the previous survey round, whereas the expected policy rate for both 2019 and 2020 was revised down.
The average expected USD/EUR exchange rate fell at all horizons, but more so in the nearer term. Thus the expected pace of future appreciation increased relative to that lower starting point (see panel (b) in Chart 10).
US dollar-denominated oil prices were expected to average $74 in the second half of 2018, $72 in 2019 and $71 in 2020. This implies that forecasters now expect prices to be between 7.2% and 12.8% higher across the horizons than they did in the previous survey (see panel (c) of Chart 10). When combined with expectations of a weaker USD/EUR exchange rate, especially in the near term, these results imply a profile for the oil price in euro that is around 11.8% higher than in the previous survey.
On average, annual growth in compensation per employee was expected to total 2.0% in 2018, 2.2% in 2019 and 2.2% in both 2020 and 2023, largely unchanged from the previous survey (see panel (d) of Chart 10).
Chart 10
Underlying assumptions


© European Central Bank, 2018
Postal address 60640 Frankfurt am Main, Germany
Telephone +49 69 1344 0
Website www.ecb.europa.eu
All rights reserved. Reproduction for educational and non-commercial purposes is permitted, provided that the source is acknowledged.
PDF ISSN 2363-3670 QB-BR-18-003-EN-N
- The survey was conducted between 2 and 6 July 2018. The total number of responses was 56. The survey requested information on expectations for the euro area HICP inflation rate (overall and excluding food and energy), the real GDP growth rate and the unemployment rate for 2018, 2019, 2020 and 2023, as well as for each of these variables one and two years ahead, with respect to the latest available data point. Participants were provided with a common set of the latest available data for annual HICP inflation (June 2018 flash estimates: overall inflation, 2.0%; excluding food and energy, 1.0%), annual GDP growth (Q1 2018, 2.5%) and unemployment (May 2018, 8.4%).
- For further information, see the box entitled “How do professional forecasters assess the risks to inflation?”, Economic Bulletin, Issue 5, ECB, 2017.