
Survey on the Access to Finance of Enterprises in the euro area - October 2022 to March 2023
1 Overview of the results
This report presents the main results of the 28th round of the Survey on the Access to Finance of Enterprises (SAFE) in the euro area, which was conducted between 6 March and 14 April 2023. The survey covered the period from October 2022 to March 2023. The sample comprised 10,983 enterprises in the euro area, of which 10,085 (92%) had fewer than 250 employees.[1]
According to the survey results, euro area firms reported a continued increase in turnover and expectations of a further recovery. A net[2] 33% reported increased turnover (see Chart 3 in Section 2), with the rebound still stronger for large firms than for small and medium-sized enterprises (SMEs).
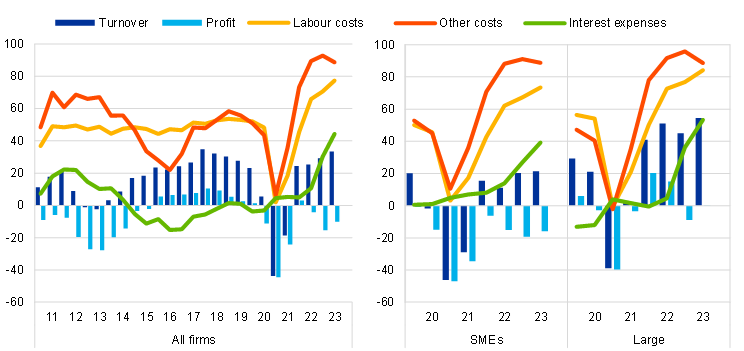
However, firms saw a further deterioration in profits, with a record number reporting rising labour costs, although the net percentage of firms reporting an increase in other costs fell slightly (see Chart 3 in Section 2). In this survey round, 16% of SMEs reported a deterioration in profits in net terms, while large firms signalled no change in profits. The deterioration in profitability reflects a rise in the cost of labour, with the net percentage of firms reporting an increase in labour costs (77%) standing at a new historical peak in the survey. The net percentage of firms indicating a rise in costs for materials and energy (89%) remained high, although it was slightly below the figure reported in the previous survey round. This reflected an easing in supply bottlenecks, together with falling energy prices.
Increasing interest expenses represent a further drag on profitability, with the net percentage of firms reporting higher interest expenses reaching a historical peak in the survey (44%). Large firms (53%) were more widely affected by the increase in interest expenses than SMEs (39%).
Altogether, the share of financially vulnerable firms remained broadly unchanged (see Chart 5 in Section 2). The financial vulnerability indicator, a comprehensive indicator of firms’ financial situation[3], suggests that 5.8% of euro area enterprises encountered major difficulties in running their businesses and servicing their debts over the past six months.
According to new quantitative ad hoc questions on euro area firms’ expectations about their selling prices and wages, firms reported on average that they expect their selling prices to increase by 6.1% and their employees’ wages to rise by 5.4% over the next 12 months (see Box 1 in Section 2).[4] This survey round provides quantitative information about euro area firms’ expectations regarding their selling prices and wages over the next 12 months.[5] Firms’ replies show considerable heterogeneity across sizes classes. SMEs expect their selling prices to increase by 6.6% over the next year on average, while the corresponding figure for large companies is 5.2%. Expected average wage increases are 5.7% and 4.9% for SMEs and large firms respectively. Labour and non-labour input costs, demand conditions and inflation expectations were reported to be the most important factors for firms’ price-setting behaviour.
Enterprises of all sizes reported that the lack of skilled labour and rising input costs were the major concerns for their business activity, while access to finance remained among the least-reported major concerns (see Chart 6 in Section 2). Over the past six months, the availability of skilled labour, signalled by 68% of firms, and higher production costs, signalled by 64% of firms, were their major concerns. A relatively low share of firms reported access to finance to be a major concern for their business (26% of firms).
Firms’ replies on external financing needs and availability continued to reflect the recent monetary policy tightening. In net terms, fewer euro area firms reported increased demand for external financing across instruments (see Table 1, columns 1-4 in this section and Chart 7 in Section 3.1). A net 4% of companies reported higher demand for bank loans (down from 9% in the previous survey round), while 13% reported higher demand for credit lines (down from 16%). This development is consistent with the slowdown of bank lending to firms recorded between the last quarter of 2022 and March 2023 and in line with the trend observed in the bank lending survey (BLS). [6] It is also related to the lower percentage of firms having used external finance for inventories as supply constraints eased. The reduced increase in the demand for external financing was also reported for trade credit, leasing and equity and, in general, was signalled more often by large firms than by SMEs.
In addition, euro area firms reported that the availability of external financing had deteriorated slightly (see Table 1, columns 5-8 in this section and Chart 9 in Section 3.2). Specifically, firms reported (in net terms) a decline in the availability of bank loans (-5%) and credit lines (-2%), approximately as in the previous round.
As a consequence of the interaction between financing needs and the availability of external finance, the financing gap across all financial instruments (bank loans, credit lines, trade credit, and equity and debt securities issuance) increased slightly across firms (see Table 1, columns 9-10 in this section and Chart 10 in Section 3.2). The net percentage of firms reporting a widening of the financing gap in external funds went down to 6% from 9%. This was mainly because of a reduction in the net percentage of large firms reporting a widening of the financing gap (to a net 6%, down from 11% in the previous round).
Table 1
Latest developments in SAFE country results for euro area firms
(net percentages of respondents)
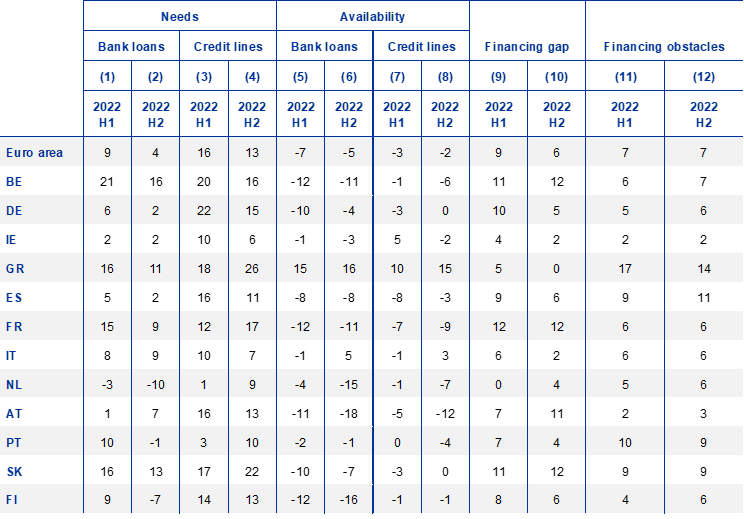
Notes: For the “financing gap”, see the notes to Chart 10; for “financing obstacles”, see the notes to Chart 13. “2022 H1” refers to round 27 (April 2022-September 2022) and “2022 H2” refers to round 28 (October 2022-March 2023).
The general economic outlook as a factor explaining the availability of external financing was broadly perceived as deteriorating, but less than in the previous survey round (see Chart 11 in Section 4). A net 35% of firms reported a deterioration in the general economic outlook, down from the peak of 48% in the last survey round. Similarly, the firm-specific outlook has also worsened, with a net 3% of firms reporting a deterioration, down from a net 16% in the last survey round.
Firms’ perceptions on banks’ willingness to lend, which reflect banks’ risk aversion, were broadly unchanged overall (see Chart 11 in Section 4). On balance, 3% of firms reported an improvement in the willingness of banks to provide credit, up from 0% in the previous survey round. While SMEs reported that banks’ willingness to lend was broadly unchanged (-1%), a net 9% of large firms signalled a more benign attitude among banks.
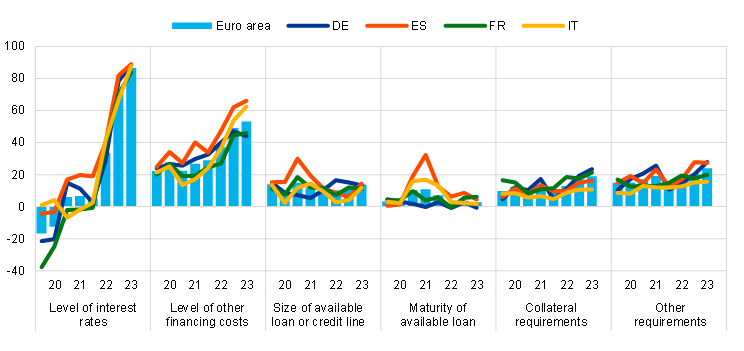
In this survey round, most enterprises reported increases in bank interest rates and a considerable deterioration in other costs of financing, with net percentages at the highest levels observed since the survey began in 2009 (see Chart 14 in Section 4). In particular, a net 87% of firms reported rises in bank interest rates (up from 71%), reflecting the transmission of the monetary policy tightening to the cost of borrowing for corporations. This is in line with the latest available results of the BLS showing a widening of the margins applied to bank loans for the fourth quarter of 2022 and the first quarter of 2023.
Changes in financing conditions and the attitude of lenders normally have an impact on investment in fixed assets (see Chart 1 in this section). From a historical perspective, regression analysis shows that an increase in the level of interest rates as recorded in the SAFE and a deterioration in banks’ willingness to lend is associated with weaker fixed investment by firms. The impact of an increase in interest rates is found to be negative and statistically significant for all firms, in particular large ones, as well as for those in the industry and trade sectors. Banks’ willingness to lend, as measured by firms’ perceptions of the overall attitude of banks towards providing them with credit, has a stronger negative impact on fixed investment compared with the impact of interest rates.
Chart 1
Relationship between fixed investment and banks’ interest rates and willingness to lend
(net percentages of respondents and percentage points)
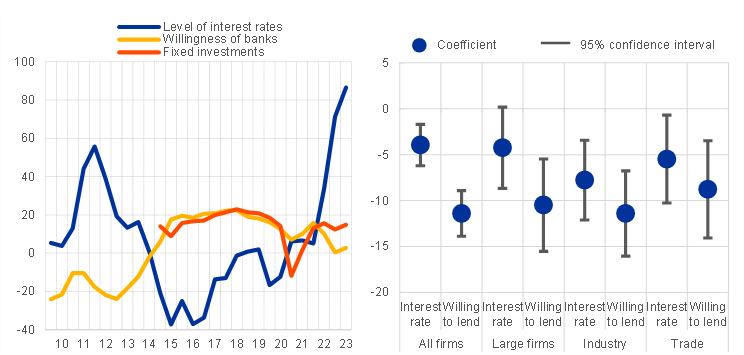
Notes: The left panel shows net percentages of changes in fixed investment, interest rates and willingness of banks to provide credit. The right panel plots regression coefficients showing the impact of an increase in the level of interest rates and a deterioration in banks’ willingness to lend on the increase in the purpose of using financing for fixed investment (investments in property, plant or equipment). Regressions contain firm fixed effects, and depending on the sample used, country, time, firm size and industry fixed effects. The whiskers represent 95% confidence intervals.
Few firms reported obstacles to obtaining a bank loan. Despite the tighter financing conditions, the overall indicator[7] of financing obstacles remained unchanged at 7%, with net percentages of 5% for large firms and 9% for SMEs (see Table 1, columns 11 and 12 in this section). In addition, even though the percentage of firms applying for bank loans remained unchanged (29%), an increasing number of firms were successful in obtaining the full amount requested, whether they were SMEs (68%) or large companies (85%).
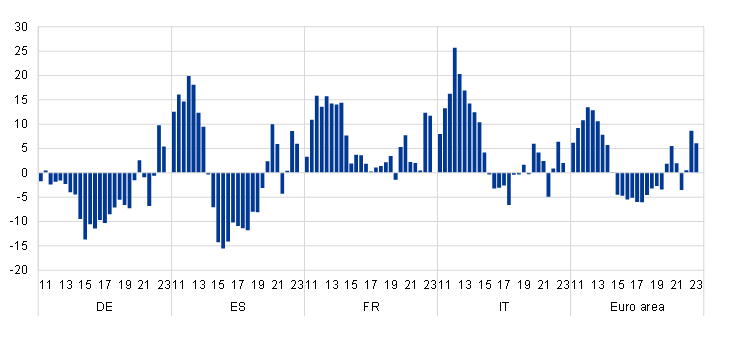
An overall indicator of financing conditions showed the highest deterioration since the start of the survey (see Chart 2 in this section). A comprehensive indicator capturing changes in bank interest rates and other costs of bank financing (charges, fees and commissions) shows that the recent deterioration (denoted by positive indicator values) is reported by a net 47% of firms.[8] This recent deterioration in financing conditions is more pronounced in Spain and Italy than in other countries but is similar across firm size classes.
Chart 2
Change in overall financing conditions as perceived by euro area firms in selected countries
(over the preceding six months; net percentage of respondents)
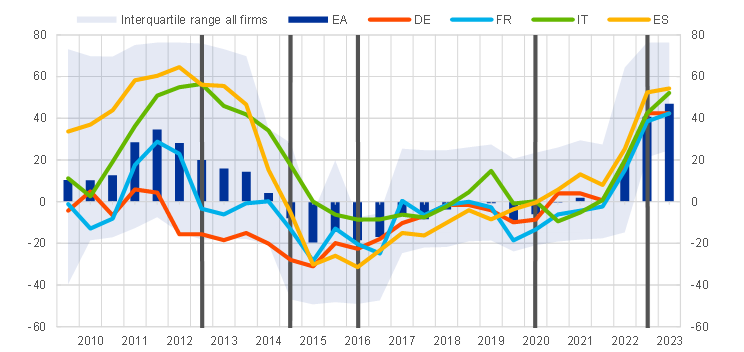
Base: All enterprises in all survey rounds.
Notes: Indicator obtained by factor analysis. Positive values indicate a deterioration in firms’ financing conditions. The individual scores are weighted by size class, economic activity and country to reflect the economic structure of the underlying population of firms. The individual scores are standardised, so they have a range of between -1 and 1 and are multiplied by 100 to obtain weighted balances in percentages. The first vertical grey line denotes the announcement of the Outright Monetary Transactions; the second vertical grey line denotes the start of the first series of targeted longer-term refinancing operations (TLTRO I) and the negative interest rate policy; the third vertical grey line denotes the start of TLTRO II and the corporate sector purchase programme; the fourth denotes the start of the pandemic emergency purchase programme and TLTRO III; the last vertical grey vertical line denotes the raising of the three key ECB interest rates by 50 basis points and the approval of the Transmission Protection Instrument (TPI) in July 2022. Latest observation: October 2022 to March 2023.
Looking ahead, firms expect a decline in the availability of bank loans and credit lines (see Chart 15 and Chart 16 in Section 5). Regarding external financing, firms are particularly pessimistic about access to bank loans and credit lines, with a net 17% and 12% of firms respectively expecting a deterioration over the next six months. In line with a higher net percentage of firms expecting an increase in turnover over the next six months, firms expect an improvement in the availability of internal funds.
2 The economic situation of euro area firms
2.1 Business activity continues to improve, with higher costs weighing on profitability
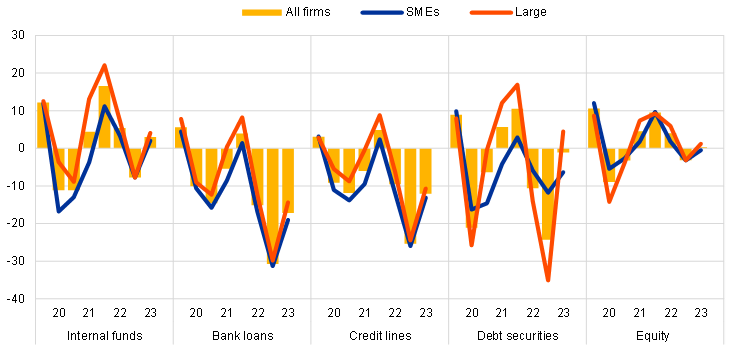
Euro area enterprises reported an increase in turnover over the last six months (see Chart 3). The net percentage of euro area firms that reported an increase in turnover over the last six months rose to 33% (up from 29% in the previous wave). Across firm sizes, the rebound continues to be stronger for large firms (54%) than for SMEs (21%).
Chart 3
Changes in the income situation of euro area enterprises
(net percentages of respondents)
Base: All enterprises. The figures refer to rounds 3-28 of the survey (March 2010-September 2010 to October 2022-March 2023) for all firms and to rounds 21-28 (April 2019-September 2019 to October 2022-March 2023) for SMEs and large firms.
Notes: Net percentages are the difference between the percentage of enterprises reporting an increase for a given factor and the percentage reporting a decrease. The data included in the chart refer to Question 2 of the survey.
Despite the positive developments in turnover, euro area firms continued to report a deterioration in their profits, although to a lesser extent than in the previous survey round. The net percentage of euro area corporations that signalled a decline in their profits was slightly below the net percentage reported in the previous survey round (-10% compared with -16% in the previous wave). For SMEs, the respective percentages were -16% and -19%, whereas large firms signalled no changes in profits in this round (0% following -9% in the previous survey round). Firms in industry, construction and trade reported a decline in profits more often than firms in services.
The deterioration in profitability continues to reflect a significant rise in labour and other costs related to materials and energy, with the net percentage of firms reporting an increase in labour costs standing at a new historical peak in the survey. A net 77% of firms reported higher labour costs (up from 71%). The net percentage of firms indicating rising costs for materials and energy, while remaining high, stood slightly below the values reported in the previous survey round (89%, after 93%), reflecting an easing in supply bottlenecks and falling energy prices.
Increasing interest expenses represent a further drag on profitability. The net percentage of firms reporting rising interest expenses was the highest since the beginning of the survey. A net 44% of firms reported higher interest expenses (up from 30%), with large firms (53%) more widely signalling that they were affected by the increase in interest expenses than SMEs (39%).
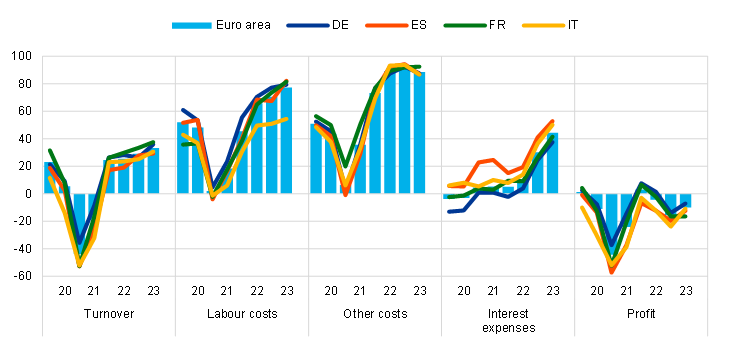
Across countries, trends in firms’ business activity followed similar patterns in the past six months (see Chart 18 in Annex 1). The net shares of firms reporting an expansion in turnover and a decline in profits respectively were fairly similar across the largest euro area countries. Changes in labour costs were similar across the large countries, except in the case of Italy, where increases were less frequently reported (net 55% compared with 77% for all euro area firms). As in recent waves, increases in interest expenses were reported more frequently by Spanish and Italian firms (53% and 50% respectively) than by French and German firms (42% and 38% respectively).
Chart 4
Changes in the debt situation and real decisions of euro area enterprises
(net percentages of respondents)

Base: All enterprises. The figures refer to rounds 11-28 of the survey (March 2014-September 2014 to October 2022-March 2023) for all firms and to rounds 21-28 (April 2019-September 2019 to October 2022-March 2023) for SMEs and large firms.
Notes: See the notes to Chart 3. The data included in the chart refer to Question 2 of the survey.
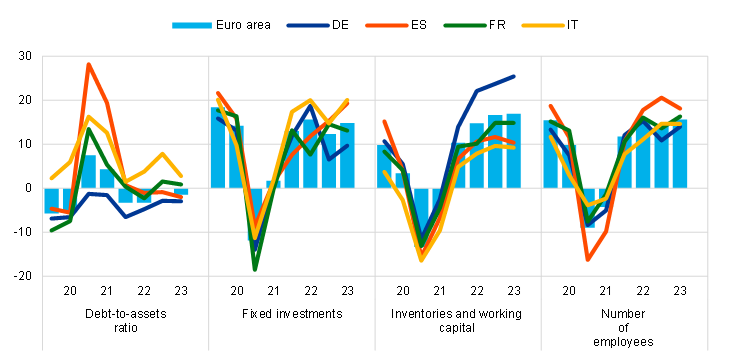
Euro area firms reported on balance that debt-to-assets ratios were broadly unchanged in this survey round, although patterns diverged to some extent across euro area countries (Chart 4 above and Chart 19 in Annex 1). In this survey round, euro area firms indicated on balance that there had been a 1% decrease in their indebtedness (compared with no change on net in the previous round). However, German and Spanish firms continued to report slight decreases in debt-to-assets ratios, while French and, in particular, Italian firms signalled increases (although less so than in the previous round).
Firms’ investment and employment growth has broadly held up, but with some heterogeneity. A net percentage of euro area enterprises reported increases in fixed investment (15%, up from 12%), inventories and working capital (17%, as in the previous round) and number of employees (16%, up from 14%). The growth in fixed investment, inventories and employment was more widely reported among large firms than among SMEs.
Growth in inventories and working capital was widespread across countries. In this survey round, German firms continued to report increases in inventories (25%) more broadly than firms in the other large countries (ranging from 9% to15%). At the same time, increases in fixed investment were signalled more often by Spanish and Italian firms (19% and 20% respectively) than by German and French firms (10% and 13% respectively).
The financial vulnerability of euro area enterprises remained broadly unchanged for both SMEs and large firms (see Chart 5). The financial vulnerability indicator, a comprehensive indicator of firms’ financial situation, suggests that 5.8% of euro area enterprises encountered major difficulties in running their businesses and servicing their debts over the past six months (compared with 5.5% in the previous round).[9] The increase in this survey round is more marked for SMEs, with the percentage reaching 6.4% (up from 5.9%), well above the average levels before the outbreak of COVID-19 pandemic. At the other end of the spectrum, the percentage of financially strong firms (i.e. those that are more likely to be resilient to adverse shocks) remained broadly unchanged at 4.4% overall (3.9% previously), reflecting the better economic performance of large firms.
Chart 5
Vulnerable and strong enterprises in the euro area
(percentages of respondents)
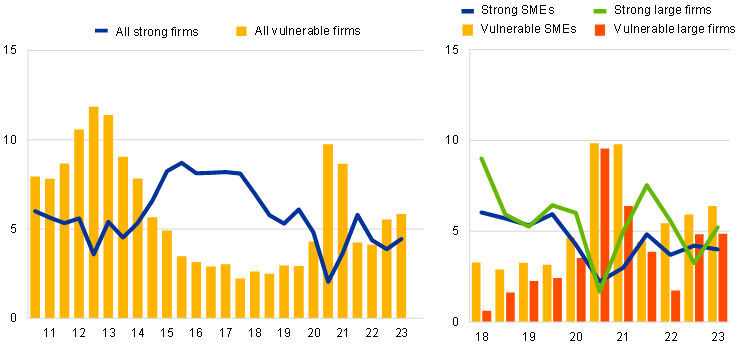
Base: All enterprises. The figures refer to rounds 3-28 of the survey (March 2010-September 2010 to October 2022-March 2023) for all firms and to rounds 18-28 (October 2017-March 2018 to October 2022-March 2023) for SMEs and large firms.
Notes: For a definition of “vulnerable firms” and “strong firms”, see footnote 9. The data included in the chart refer to Question 2 of the survey.
The financial vulnerability indicator increased for Spanish firms in particular (see Chart 20 in Annex 1). The percentage of vulnerable companies remained roughly constant in Germany (5%), Italy (5%) and France (4%), while it increased markedly in Spain (9%, up from 7%). By contrast, the share of strong enterprises increased slightly across the four largest economies in this survey round.
Box 1
Ad hoc questions – Firms’ expectations about selling prices and wages
The latest survey round provides quantitative information on euro area firms’ expectations about their selling prices and wages over the next 12 months. The survey included two ad hoc questions on firms’ subjective expectations about the change in (i) their selling prices and (ii) the wages of their current employees over the next 12 months. Firms’ expectations about their future selling prices reported here cannot be compared with commonly used measures of consumer price inflation expectations, as the firms’ responses mainly reflect producer prices.
On average, euro area firms expect their selling prices to increase by 6.1% and their employees’ wages to rise by 5.4% over the next 12 months, with considerable heterogeneity across firms (Chart A).[10] SMEs expect their selling prices to increase by 6.6% over the next year on average, while the corresponding figure for large companies is 5.2%. In the case of expected average wage increases, the numbers are 5.7% and 4.9% for SMEs and large firms respectively. Dispersion is also higher among SMEs: 50% of SMEs expect wage increases of between 3% and 8% over the next 12 months, while the respective percentages for large firms are 3% and 6%. Compared with March 2022, fewer companies expect increases in their selling prices in the next 12 months (68% of all firms compared with 76% in 2022).
Chart A
Average expected price and wage changes
(percentages)

Base: All enterprises. The figures refer to round 28 of the survey (October 2022-March 2023).
Notes: Average expectations about selling prices and wages of current employees for the next 12 months as reported by euro area firms, along with interquartile ranges, using survey weights. The statistics are computed after trimming the data at the country-specific 1st and 99th percentiles.
In the current environment, labour and non-labour input costs, demand conditions and inflation expectations are reported as the most important factors for firms’ price-setting behaviour over the next 12 months (Chart B). As many as 95% of firms reported expected labour costs to be a (moderately or very) important driver of selling prices over the next 12 months. Turning to raw material and other expected input costs, and to demand conditions, around 90% of firms reported both factors to be important. In addition, 92% of firms reported that expected inflation dynamics are an important factor for their price setting. This percentage is slightly higher than in the survey round one year ago when the same ad hoc question was last asked.
Chart B
Factors reported to influence selling prices
(percentages of respondents)
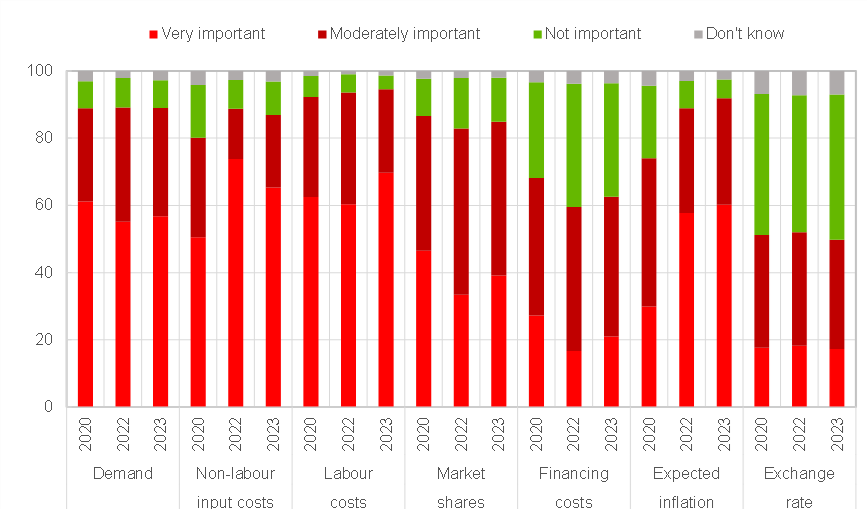
Base: All enterprises. The figures refer to survey rounds 22 (October 2019-March 2020), 26 (October 2021-March 2022) and 28 (October 2022-March 2023).
Notes: Importance of factors for selling prices over the next 12 months as reported by euro area firms. The most recent survey was conducted between 6 March and 14 April 2023. The chart also shows the responses from previous survey rounds to the same question.
Regression analysis suggests that demand, input costs and inflation expectations are positively related to firms’ expected selling prices over the next 12 months (Chart C). Accounting for firm size, sector and country fixed effects, and based on bivariate regressions, expected price changes are 1.5-2.5 percentage points higher for firms which report that non-labour input costs, labour costs, demand conditions or inflation expectations are important for their price setting compared with firms that do not consider these drivers important. In addition, expected price changes are 0.6 percentage points higher for firms reporting financing costs to be an important factor for price setting. These findings are similar across SMEs and large firms, and indicate that the developments in demand, energy prices and other input costs, wage developments and overall inflation expectations are important determinants of firms’ selling prices.
Chart C
Effects of the different factors on expectations of selling prices
(percentage points)

Base: All enterprises. The figures refer to round 28 of the survey (October 2022-March 2023).
Notes: Differences in expected selling price changes for firms that report the respective factor as (moderately or very) important relative to firms not reporting the respective factor as important resulting from univariate weighted regressions with firm size, sector and country fixed effects. The whiskers represent 90% confidence intervals based on two-way clustered standard errors by country and sector.
2.2 Euro area enterprises remain more concerned about staff availability and costs than about access to finance
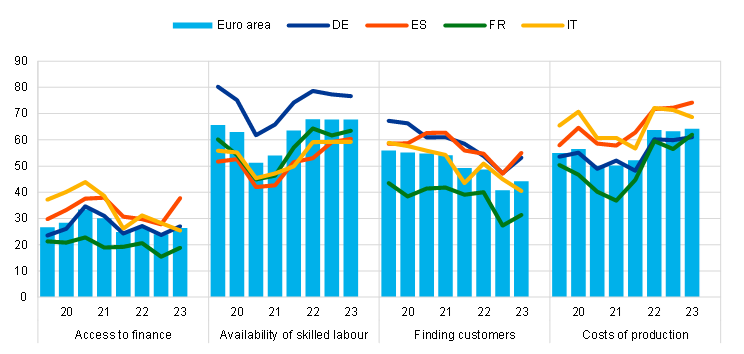
The availability of skilled labour and the rise in production costs continued to be the major concerns limiting production (see Chart 6). Over the past six months, the availability of skilled labour remained the most widely reported major concern (defined as a score of at least seven on a scale of one to ten) among euro area firms (signalled by 68% of firms), in line with the recent signals of a robust labour market, with labour shortages seen as limiting production. High production costs also remained a major concern (indicated by 64% of firms). This percentage was almost unchanged from the previous survey round, most likely related to the recent declines in energy prices. Across size classes, these two concerns are reported more often by large companies than by SMEs.
A relatively low share of firms reported access to finance as a major concern for their business (see Chart 6). Around 26% of firms reported access to finance as a major concern for their business. Across size classes, a similar share of firms reported access to finance as a major problem (27% for larger firms and 26% for SMEs).
Chart 6
Major problems faced by euro area enterprises
(over the preceding six months; percentages of respondents)
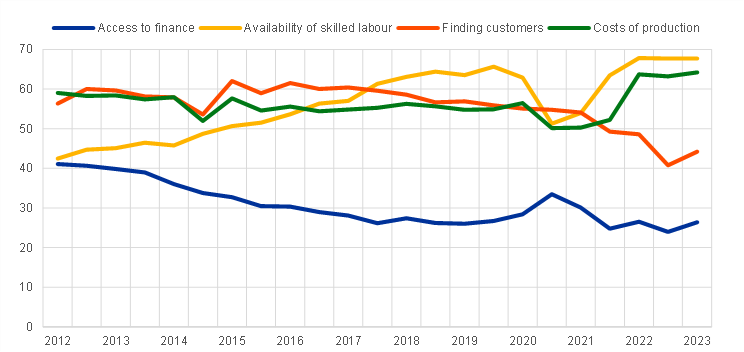
Base: All enterprises. The figures refer to rounds 6-28 of the survey (October 2011-March 2012 to October 2022-March 2023).
Notes: A “major problem” is defined as a problem scoring at least 7 on a scale of 1 to 10. The data included in the chart refer to Question 0b of the survey.
3 Demand for and availability of external financing
3.1 Increased demand for external financing across instruments
Euro area firms reported increased demand for external financing, although fewer firms reported higher demand than in the last survey round (see Chart 7). A net 4% of companies reported higher demand for bank loans[11] (down from 9% in the previous survey round), while 13% reported increased demand for credit lines (down from 16%). Among the largest euro area countries, a higher net share of French and Italian firms (both 9%) reported an increase in the need for bank loans (see also Chart 25 in Annex 1). The overall deceleration in financing needs is consistent with the slowdown in bank lending to corporates observed between the fourth quarter of 2022 and March 2023. It is also in line with the trend observed in the BLS for the fourth quarter of 2022 and first quarter of 2023. In net terms, firms also reported a deceleration in demand for trade credit, leasing or hire-purchase, and equity. The deceleration in demand for external financing was more pronounced for large firms than SMEs for most instruments.
Chart 7
Changes in external financing needs of euro area enterprises
(net percentages of respondents)

Base: Enterprises for which the instrument in question is relevant. The figures refer to rounds 21-28 of the survey (April 2019-September 2019 to October 2022-March 2023).
Notes: See the notes to Chart 3. The data included in the chart refer to Question 5 of the survey.
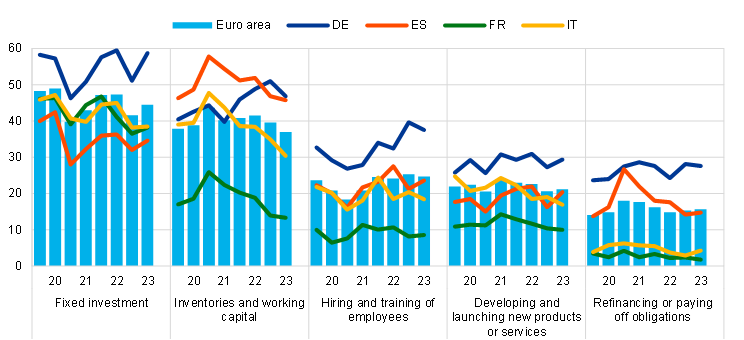
3.2 Firms used financing primarily for fixed investment and for inventories and working capital
Financing from external and internal sources continued to be used mainly for fixed investment and for inventories and working capital (see Chart 8). Fixed investment was still reported as the most common purpose of financing (45% of firms), with the percentage being slightly higher than in the last survey round (42%). The second most common purpose of financing was reported to be inventories and capital (37%), although the percentage declined for the second consecutive wave. In particular, fewer large companies reported inventories and capital to be a purpose of their financing (down to 45% from 51% in the last round), and the decline was widespread across euro area countries (see Chart 23 in Annex 1). The decline in the share of firms obtaining financing for inventories and capital was in line with the easing in supply bottlenecks.
Chart 8
Purpose of financing as reported by euro area enterprises
(percentages of respondents)

Base: All enterprises. The figures refer to rounds 21-28 of the survey (April 2019-September 2019 to October 2022-March 2023).
Note: The data included in the chart refer to Question 6A.
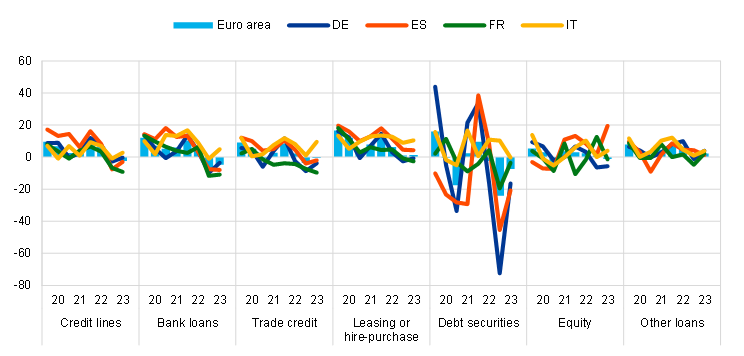
3.3 Declining availability of external financing contributed to a further widening of the financing gap
Firms reported a further slight deterioration in the availability of bank loans, credit lines and debt securities, although the decline was slower than in the previous round (see Chart 9).[12] The net percentages of firms reporting a deterioration in the availability of bank loans and credit lines were 5% and 2% respectively. This was the second survey round in a row in which firms reported declining availability of bank loans and credit lines, following several rounds in which firms reported an increase in these financing sources, with the decline in the latest round being smaller than in the previous one. Across size classes, SMEs reported the availability of bank loans and credit lines to have deteriorated more broadly (net -8% and -5% respectively) than large firms (both roughly unchanged). On balance, firms also reported a further decline in the availability of debt securities (-7% compared with -24% in the previous round), with a stronger effect on large firms (-9%) than on SMEs (-5%). For the remaining sources of external finance, availability was reported to be roughly unchanged across size classes.
Chart 9
Changes in the availability of external financing for euro area enterprises
(net percentages of respondents)
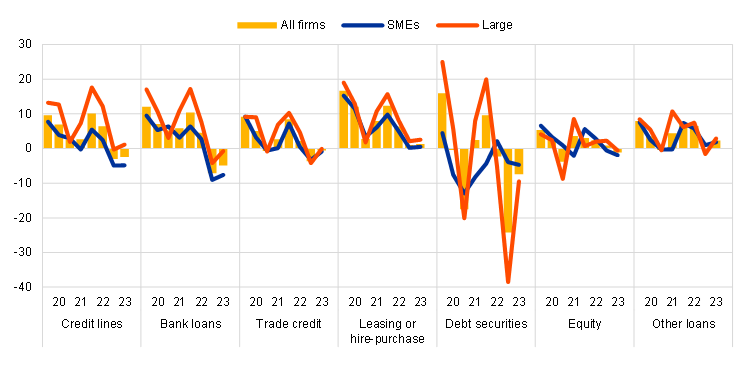
Base: Enterprises for which the instrument in question is relevant. The figures refer to rounds 21-28 of the survey (April 2019-September 2019 to October 2022-March 2023).
Notes: See the notes to Chart 3. The data included in the chart refer to Question 9 of the survey.
Firms’ increased needs for external finance combined with lower availability resulted in a widening of the financing gap (see Chart 10). In the euro area, the external financing gap – the difference between the change in demand for and the change in the supply of external financing – was reported to be 6% (down from 9% in the previous round). Apart from the previous survey wave, this was the largest increase in the financing gap since 2013. While the increase in the financing gap was similar across company size, the financing gap widened most broadly (12%) for French companies and least broadly (2%) among Italian firms (see also Chart 25 in Annex 1).
Chart 10
Changes in the external financing gaps reported by euro area enterprises
(weighted net balances)

Base: Enterprises for which the instrument in question is relevant (i.e. they have used it or considered using it). Respondents replying “not applicable” or “don’t know” are excluded. The figures refer to rounds 3-28 of the survey (March 2010-September 2010 to October 2022-March 2023).
Notes: The financing gap indicator combines both financing needs and the availability of bank loans, credit lines, trade credit, and equity and debt securities issuance at firm level. For each of the five financing instruments, the indicator of the perceived change in the financing gap takes a value of 1 (-1) if the need increases (decreases) and availability decreases (increases). If enterprises perceive only a one-sided increase (decrease) in the financing gap, the variable is assigned a value of 0.5 (-0.5). The composite indicator is a weighted average of the financing gaps for the five instruments. A positive value for the indicator points to an increase in the financing gap. Values are multiplied by 100 to obtain weighted net balances in percentages. The data included in the chart refer to Question 5 and Question 9.
3.4 Euro area enterprises perceived the general economic outlook as negatively affecting the availability of external finance
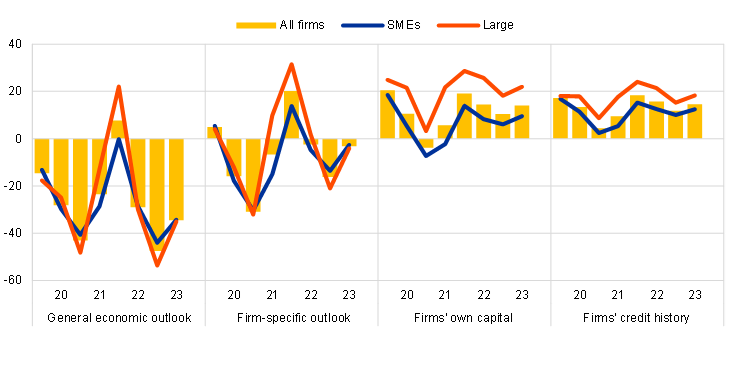
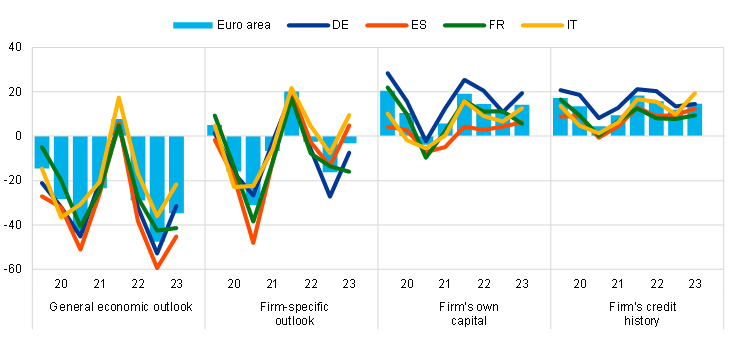
The general economic outlook was broadly perceived as hampering the availability of external financing, but less than in the previous survey round (see Chart 11). Among the factors determining the availability of external financing, a net 35% of firms reported that the general economic outlook had deteriorated. This was down from the peak of a net 48% of firms in the last survey round. Likewise, the firm-specific outlook also worsened, with a net 3% of firms reporting a deterioration, compared with a net 16% in the last survey round. The pessimistic perceptions regarding the general economic and firm-specific outlook receded across size classes. By contrast, firms reported an improvement in their own capital position (net 14%, up from 10%) and creditworthiness (net 15%, up from 12%), thus continuing to have a positive impact on access to finance. For both large firms and SMEs, a larger net percentage of firms indicated an improvement in firms’ own capital and credit history, compared with the previous survey round. This may reflect the ongoing efforts of companies to restore their equity capital buffers and thus become more resilient to economic shocks.
Chart 11
Changes in factors that have an impact on the availability of external financing to euro area enterprises
(net percentages of respondents)
Base: All enterprises. The figures refer to rounds 21-28 of the survey (April 2019-September 2019 to October 2022-March 2023).
Notes: See the notes to Chart 3. The data included in the chart refer to Question 11 of the survey.
Among the largest euro area countries, the most pessimistic perceptions on the general economic environment came from Spanish and French companies. In net terms, 45% of Spanish and 41% of French companies reported a negative impact from the general economic outlook on the availability of external financing. French firms were also the most pessimistic about their own outlook, while firms in Spain and Italy indicated that the firm-specific outlook had a positive impact on the availability of external financing (see Chart 26 in Annex 1).
Firms’ perceptions of banks’ willingness to lend, which reflect banks’ risk appetite, were overall broadly unchanged (see Chart 12). A net 3% of firms reported an improvement in banks’ willingness to lend, up from 0% in the previous survey round. While SMEs reported that banks’ willingness to lend was roughly unchanged on balance, a net 9% of large firms signalled an increase. Across countries, Italian and German firms reported improvements in banks’ willingness to provide credit, while French firms reported broadly no change, and Spanish firms indicated a deterioration in net terms (see Chart 27 in Annex 1).
Enterprises continued to report that public financial support had a decreasing impact on the availability of finance (see Chart 12). Reflecting the phasing-out of several support measures across the euro area, firms reported quite broadly that the role of public financial support was decreasing, with a net 11% decline (compared with a net 15% decline in the previous survey round). SMEs were more pessimistic on this than large firms. This holds across all large countries, but the perception is most widespread among Spanish firms (see Chart 27 in Annex 1).
Chart 12
Changes in factors that have an impact on the availability of external financing to euro area enterprises
(net percentages of respondents)

Base: All enterprises; for the category “willingness of banks to lend”, enterprises for which at least one bank financing instrument (credit line, bank overdraft, credit card overdraft, bank loan or subsidised bank loan) is relevant. The figures refer to rounds 21-28 of the survey (April 2019-September 2019 to October 2022-March 2023).
Notes: See the notes to Chart 3. The data included in the chart refer to Question 11.
4 Obstacles to obtaining a bank loan and financing conditions
4.1 Few firms reported obstacles to obtaining a bank loan
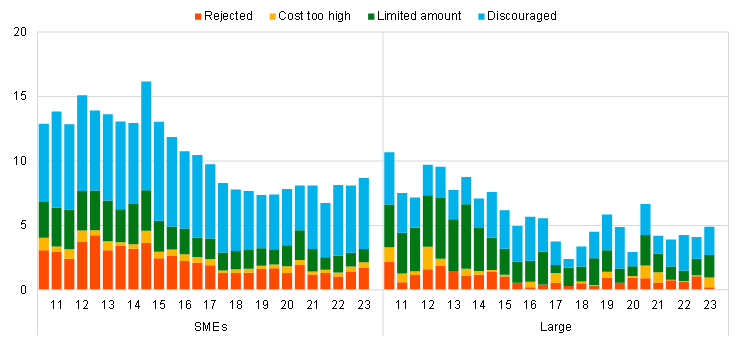
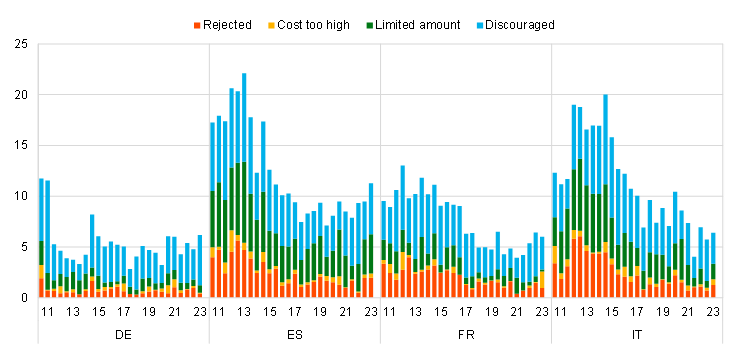
Despite the decline in the availability of credit, few firms reported obstacles to obtaining a bank loan, with percentages broadly similar to those of the previous survey rounds (see Chart 13, panel a). Among enterprises that judged bank loans to be relevant for their funding, 7% faced obstacles when seeking to obtain a loan, with net percentages of 5% for large firms and 9% for SMEs (see Chart 13, panel b). Across countries, looking at the different components of financing obstacles, the most notable changes were reported in France, where firms rejected banks’ offers more often because the costs of financing related to bank loans were considered too high, and in Germany and Spain, where the share of discouraged borrowers increased (see Chart 28 in Annex 1).
Chart 13
Obstacles to obtaining a bank loan
(percentages of respondents)
Panel a: Euro area enterprises

Panel b: Euro area SMEs and large enterprises
Base: Enterprises for which bank loans (including subsidised bank loans) are relevant. The figures refer to rounds 3-28 of the survey (March 2010-September 2010 to October 2022-March 2023).
Note: Financing obstacles are defined here as the total of the percentages of enterprises reporting (i) loan applications that were rejected, (ii) loan applications for which only a limited amount was granted, (iii) loan applications that resulted in an offer that was declined by the enterprise because the borrowing costs were too high, and (iv) a decision not to apply for a loan for fear of rejection (discouraged borrowers).
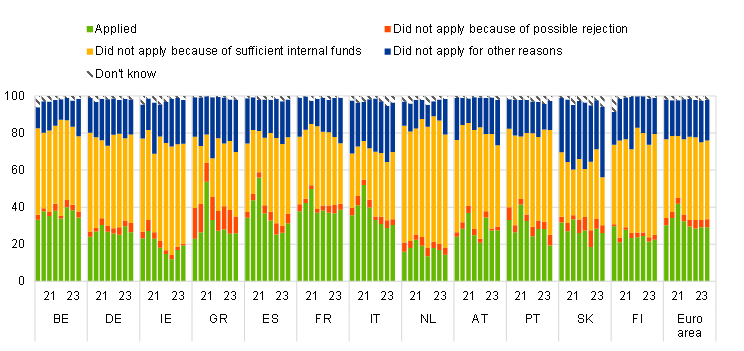
The percentage of firms applying for bank loans remained unchanged, with the role of internal funds declining slightly. According to figures based only on enterprises that deemed bank loans to be relevant for their business, 29% of firms reported having applied for a loan (unchanged) (see Chart 29 in Annex 1). Only 22% of SMEs applied, with 44% reporting that they did not apply because they had sufficient internal funds available. By contrast, a higher percentage of large companies applied for bank loans (41%, up from 37%) in response to a depletion of internal funds. Most of the firms that applied were successful in obtaining the full amount requested, whether they were SMEs (62%) or large companies (73%) (see Chart 30 in Annex 1).
4.2 Significant tightening in financing conditions, with more stringent price terms and conditions for bank loans
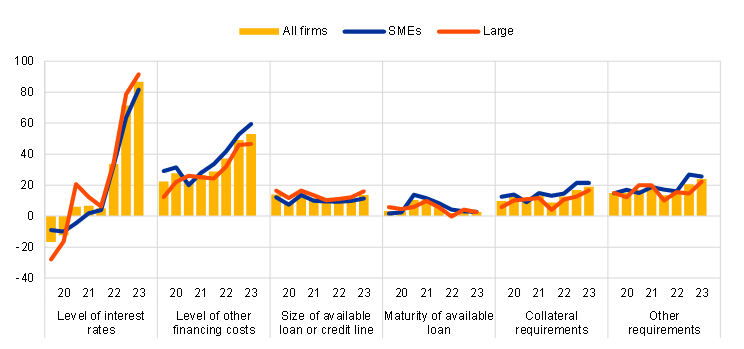
Firms reported very broadly that there had been a rise in bank interest rates alongside a considerable increase in other costs of financing, with net percentages at the highest observed levels since the survey began in 2009 (see Chart 14). The net percentage of firms reporting an increase in interest rates rose further in the current survey round to 87% (up from 71%), reflecting the transmission of the monetary policy tightening to the cost of borrowing for corporations. This is also in line with the latest available results of the BLS showing a widening of margins for bank loans for the fourth quarter of 2022 and the first quarter of 2023. At the same time, a net 53% (up from 49%) of firms reported an increase in other costs of financing (i.e. charges, fees and commissions). As in the previous survey round, the figure represented a historical high. The rise in bank interest rates was reported more broadly by large firms, whereas the increase in other costs of bank loans was signalled more often by SMEs. Firms also reported stricter collateral requirements and increases in the maturity and size of loans.
The net percentage of firms reporting an increase in interest rates is similar across the largest euro area countries (see Chart 31 in Annex 1). The increase in interest rates was reported to be widespread across the largest euro area countries, with the figures ranging from a net 84% increase in France to a net 89% increase in Spain. Meanwhile the reported net increase in non-interest cost ranged between 44% in Germany and 66% in Spain.
Chart 14
Changes in the terms and conditions of bank financing for euro area enterprises
(net percentages of respondents)
Base: Enterprises that had applied for bank loans (including subsidised bank loans), credit lines, or bank or credit card overdrafts. The figures refer to rounds 21-28 of the survey (April 2019-September 2019 to October 2022-March 2023).
Notes: See the notes to Chart 3. The data included in the chart refer to Question 10.
5 Expectations regarding access to finance and turnover
5.1 Firms expect a further deterioration in their access to bank loans and credit lines
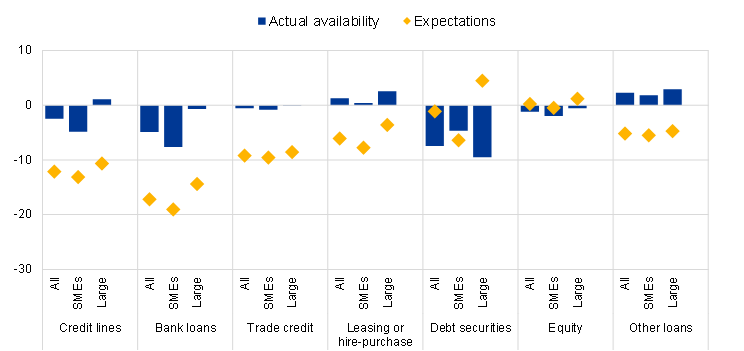
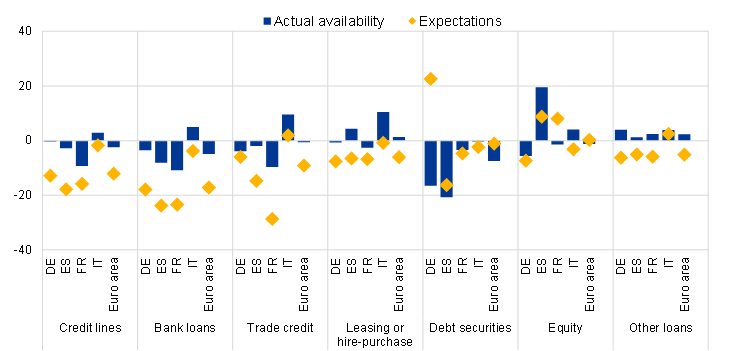
Looking ahead, firms expect a decline in the availability of bank loans and credit lines (see Chart 15). Reflecting the ongoing tightening in bank lending conditions, a net 17% of firms expect a deterioration in access to bank loans, while a net 12% expect a worsening in access to credit lines over the next six months. Compared with large firms, SMEs expect a slightly larger deterioration both for bank loans and credit lines. Across countries, the expected deterioration in the availability of bank loans and credit lines is more pronounced in Germany, Spain and France (see Chart 32 in Annex 1). Firms indicated no change in the expected availability of debt securities for the next six months, while large firms even expect an improvement.
Chart 15
Actual and expected availability of external financing for euro area enterprises
(past six-month period and next six-month period; net percentages of respondents)
Base: Enterprises for which the instrument in question is relevant. The figures refer to round 28 of the survey (October 2022-March 2023).
Notes: See the notes to Chart 3. The data included in the chart refer to Question 9 and Question 23 of the survey.
Firms were optimistic about the availability of internal funds for the next six months (see Chart 16 and Chart 33 in Annex 1). Across size classes, a net 2% of SMEs and a net 4% of large firms expect internal funds as a source of financing to improve over the next six months.
Chart 16
Changes in euro area enterprises’ expectations regarding the availability of financing
(next six-month period; net percentages of respondents)
Base: Enterprises for which the instrument in question is relevant. The figures refer to rounds 21-28 of the survey (April 2019-September 2019 to October 2022-March 2023).
Notes: See the notes to Chart 3. The data included in the chart refer to Question 23 of the survey.
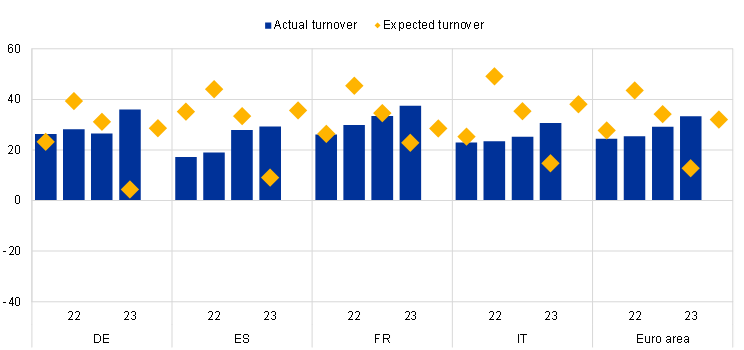
Firms expect a further increase in turnover over the next six months (see Chart 17). A net 32% of euro area firms (up from 13% in the previous survey round) expect an increase in turnover over the next six months, with both SMEs (28%, up from 6%) and large firms (39%, up from 25%) becoming more optimistic. Among the four largest euro area economies, Italian and Spanish firms were the most optimistic (see Chart 34 in Annex 1).
Chart 17
Actual and expected turnover among euro area enterprises
(past six-month period and next six-month period; net percentages of respondents)
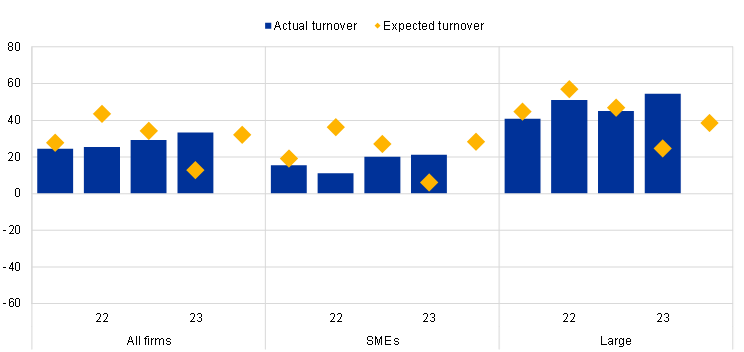
Base: All enterprises. The figures refer to round 25-28 of the survey (April 2021-September 2021 to October 2022-March 2023).
Notes: See the notes to Chart 3. The data included in the chart refer to Question 2 and Question 26 of the survey.
Annexes
Annex 1
Overview of survey replies – country results
Chart 18
Changes in the income situation
(net percentages of respondents)
Base: All enterprises. The figures refer to rounds 21-28 of the survey (April 2019-September 2019 to October 2022-March 2023).
Notes: See the notes to Chart 3. The data included in the chart refer to Question 2 of the survey.
Chart 19
Changes in the debt situation and real decisions
(net percentages of respondents)
Base: All enterprises. The figures refer to rounds 21-28 of the survey (April 2019-September 2019 to October 2022-March 2023).
Notes: See the notes to Chart 3. The data included in the chart refer to Question 2 of the survey.
Chart 20
Vulnerable and strong euro area enterprises
(percentages of respondents)

Base: All enterprises. The figures refer to rounds 3-28 of the survey (March 2010-September 2010 to October 2022-March 2023).
Notes: For a definition of “vulnerable firms” and “strong firms”, see footnote 3. The data included in the chart refer to Question 2 of the survey.
Chart 21
Major problems faced by euro area enterprises
(over the preceding six months; percentages of respondents)
Base: All enterprises. The figures refer to rounds 21-28 of the survey (April 2019-September 2019 to October 2022-March 2023).
Notes: A “major problem” is defined as a problem scoring at least 7 on a scale of 1 to 10. The data included in the chart refer to Question 0b of the survey.
Chart 22
Changes in external financing needs
(net percentages of respondents)

Base: Enterprises for which the instrument in question is relevant. The figures refer to rounds 21-28 of the survey (April 2019-September 2019 to October 2022-March 2023).
Notes: See the notes to Chart 3. The data included in the chart refer to Question 5 of the survey.
Chart 23
(percentages of respondents)
Base: All enterprises. The figures refer to rounds 21-28 of the survey (April 2019-September 2019 to October 2022-March 2023).
Note: The data included in the chart refer to Question 6A of the survey.
Chart 24
Changes in the availability of external financing
(net percentages of respondents)
Base: Enterprises for which the instrument in question is relevant. The figures refer to rounds 21-28 of the survey (April 2019-September 2019 to October 2022-March 2023).
Notes: See the notes to Chart 3. The data included in the chart refer to Question 9 of the survey.
Chart 25
Changes in the external financing gaps
(weighted net balances)
Base: Enterprises for which the instrument in question is relevant. Respondents replying “not applicable” or “don’t know” are excluded. The figures refer to rounds 3-28 of the survey (March 2010-September 2010 to October 2022-March 2023).
Notes: The financing gap indicator combines both financing needs and the availability of bank loans, credit lines, trade credit, and equity and debt securities issuance at firm level. For each of the five financing instruments, the indicator of the perceived change in the financing gap takes a value of 1 (-1) if the need increases (decreases) and availability decreases (increases). If enterprises perceive only a one-sided increase (decrease) in the financing gap, the variable is assigned a value of 0.5 (-0.5). The composite indicator is a weighted average of the financing gaps for the five instruments. A positive value for the indicator points to an increase in the financing gap. Values are multiplied by 100 to obtain weighted net balances in percentages. The data included in the chart refer to Question 5 and Question 9.
Chart 26
Changes in factors that have an impact on the availability of external financing
(net percentages of respondents)
Base: All enterprises. The figures refer to rounds 21-28 of the survey (April 2019-September 2019 to October 2022-March 2023).
Notes: See the notes to Chart 3. The data included in the chart refer to Question 11 of the survey.
Chart 27
Changes in factors that have an impact on the availability of external financing
(net percentages of respondents)

Base: All enterprises; for the category “willingness of banks to lend”, enterprises for which at least one bank financing instrument (credit line, bank overdraft, credit card overdraft, bank loan or subsidised bank loan) is relevant. The figures refer to rounds 21-28 of the survey (April 2019-September 2019 to October 2022-March 2023).
Notes: See the notes to Chart 3. The data included in the chart refer to Question 11.
Chart 28
Obstacles to obtaining a bank loan
(percentages of respondents)
Base: Enterprises for which bank loans (including subsidised bank loans) are relevant for rounds 3-28 of the survey (March 2010-September 2010 to October 2022-March 2023).
Notes: Financing obstacles are defined here as the total of the percentages of enterprises reporting (i) loan applications that were rejected, (ii) loan applications for which only a limited amount was granted, (iii) loan applications that resulted in an offer that was declined by the enterprise because the borrowing costs were too high, and (iv) a decision not to apply for a loan for fear of rejection (discouraged borrowers). The calculation of the indicator starts in 2010, when the question on applications for credit lines was first included in the questionnaire. The components of the financing obstacles indicator were affected by the amendments to the questionnaire in round 11 (filtering based on the relevance of the financing instrument and addition of the new category “my application is still pending”), and past data have been revised accordingly. These figures include the categories “my application is still pending” and “don’t know”.
Chart 29
(percentages of respondents)
Base: Enterprises for which bank loans (including subsidised bank loans) are relevant. The figures refer rounds 21-28 of the survey (April 2019-September 2019 to October 2022-March 2023).
Note: The data included in the chart refer to Question 7A of the survey.
Chart 30
Outcome of applications for bank loans
(percentages of respondents)
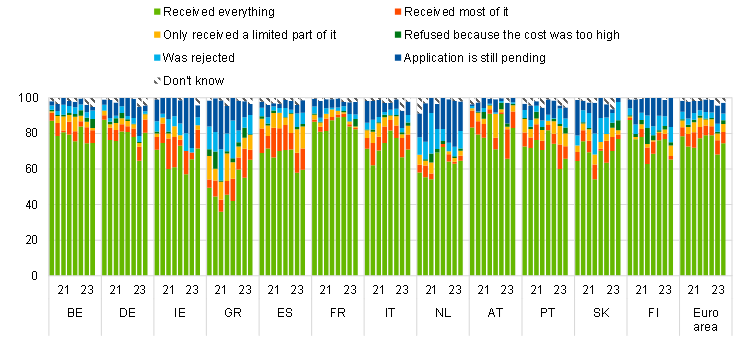
Base: Enterprises that had applied for bank loans (including subsidised bank loans). The figures refer to rounds 21-28 of the survey (April 2019-September 2019 to October 2022-March 2023).
Notes The data included in the chart refer to Question 7B of the survey.
Chart 31
Changes in the terms and conditions of bank financing
(net percentages of respondents)
Base: Enterprises that had applied for bank loans (including subsidised bank loans), credit lines, or bank or credit card overdrafts. The figures refer to rounds 21-28 of the survey (April 2019-September 2019 to October 2022-March 2023).
Notes: See the notes to Chart 3. The data included in the chart refer to Question 10 of the survey.
Chart 32
Actual and expected availability of external financing
(past six-month period and next six-month period; net percentages of respondents)
Base: Enterprises for which the instrument in question is relevant. The figures refer to round 28 of the survey (October 2022-March 2023).
Notes: See the notes to Chart 3. The data included in the chart refer to Question 9 and Question 23.
Chart 33
Changes in expectations regarding the availability of financing
(next six-month period; net percentages of respondents)

Base: Enterprises for which the instrument in question is relevant. The figures refer to rounds 21-28 of the survey (April 2019-September 2019 to October 2022-March 2023).
Notes: See the notes to Chart 3. The data included in the chart refer to Question 23 of the survey.
Chart 34
(past six-month period and next six-month period; net percentages of respondents)
Base: All enterprises. The figures refer rounds 25-28 of the survey (April 2021-September 2021 to October 2022-March 2023).
Note: The data included in the chart refer to Question 2 and Question 26 of the survey.
Annex 2
Descriptive statistics for the sample of enterprises
Chart 35
Breakdown of enterprises by economic activity
(unweighted percentages)
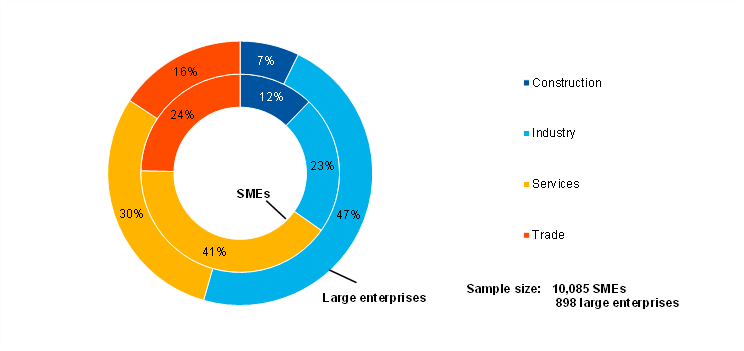
Base: The figures refer to round 28 of the survey (October 2022-March 2023).
Chart 36
Breakdown of enterprises by age
(unweighted percentages)
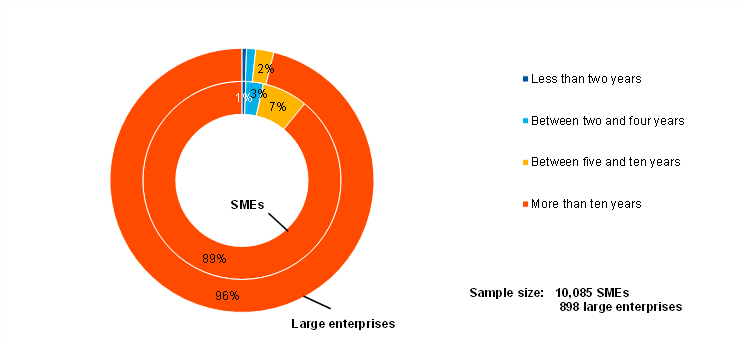
Base: The figures refer to round 28 of the survey (October 2022-March 2023).
Chart 37
Breakdown of enterprises by ownership
(unweighted percentages)

Base: The figures refer to round 28 of the survey (October 2022-March 2023).
Chart 38
Breakdown of enterprises by exports
(unweighted percentages)
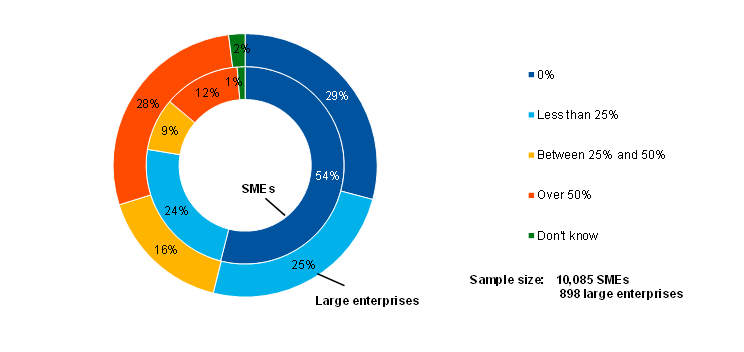
Base: The figures refer to round 28 of the survey (October 2022-March 2023).
Annex 3
Methodological information on the survey
For an overview of how the survey was set up, the general characteristics of the euro area enterprises that participate in the survey and the changes introduced to the methodology and the questionnaire over time, see the “Methodological information on the survey and user guide for the anonymised micro dataset”, which is available on the ECB’s website.[13]
In this survey round, no major changes were made to the existing questions in the questionnaire.[14]
Postal address 60640 Frankfurt am Main, Germany
Telephone +49 69 1344 0
Website www.ecb.europa.eu
All rights reserved. Reproduction for educational and non-commercial purposes is permitted provided that the source is acknowledged.
The cut-off date for data included in this report was 14 April 2023.
For specific terminology please refer to the ECB glossary (available in English only).
PDF ISSN 1831-9998, QB-AP-23-004-EN-N
HTML ISSN 1831-9998, QB-AP-23-004-EN-Q
See Annex 3 for details of methodological issues relating to the survey.
The net percentages indicated in this report are defined as the difference between the percentage of enterprises reporting that something has increased and the percentage reporting that it has declined.
Vulnerable firms are defined as firms that simultaneously report lower turnover, decreasing profits, higher interest expenses and a higher or unchanged debt-to-assets ratio.
Weighted averages calculated after trimming observations below the 1st percentile and above the 99th percentile of the country distributions.
Firms’ expectations about their future selling prices reported here cannot be directly compared with commonly used measures of consumer price inflation expectations. The firms’ responses reflect producer prices rather than a consumption basket as in the case of the Harmonised Index of Consumer Prices (HICP).
See the euro area bank lending survey.
The financing obstacles indicator is the sum of the percentages of firms reporting the rejection of loan applications, loan applications for which only a limited amount was granted, and loan applications which resulted in an offer that was declined by the firms because the borrowing costs were too high, as well as the percentage of firms that did not apply for a loan for fear of rejection.
The indicator is one of the “principal components” derived from a factor analysis using firm-level survey replies since 2009. The variables included in the analysis cover changes in (i) price terms and conditions, (ii) non-price terms and conditions, (iii) the financial position of firms, and (iv) firms’ perceptions of changes in the willingness of banks to provide credit. This principal component is interpreted as relating to price terms and conditions. The aggregate indicator is the average of firm-level scores, weighted by size, economic activity and country. The analysis detects two other principal components, namely (i) the financial position of firms and (ii) non-price terms and conditions. For a detailed description of the indicator, see the box entitled “Financing conditions through the lens of euro area companies”, Economic Bulletin, Issue 8, ECB, 2021.
Vulnerable firms are defined as firms that simultaneously report lower turnover, decreasing profits, higher interest expenses and a higher or unchanged debt-to-assets ratio, while “strong” firms are those that simultaneously report higher turnover and profits, lower or no interest expenses and a lower or no debt-to-assets ratio. See the box entitled “Distressed and profitable firms: two new indicators on the financial position of enterprises”, Survey on the Access to Finance of Enterprises in the euro area, October 2017 to March 2018, ECB, 2018.
Weighted averages are calculated after trimming observations below the 1st percentile and above the 99th percentile of the country distributions. The median expectation about price and wage changes is equal to exactly 5% across size classes.
Only those survey respondents which report that a particular financing instrument is relevant for their enterprise are asked about their need for that source of financing.
Only those survey respondents which report that a particular financing instrument (i.e. bank loans, credit lines, trade credit, leasing or hire-purchase, debt securities, and equity or other loans) is relevant for their enterprise are asked about the availability of that source of financing.
The questionnaire is available on the ECB’s website. It has been translated into various languages for the purposes of the survey.
-
7 June 2023