


Commercial real estate and financial stability – new insights from the euro area credit register
Commercial real estate and financial stability – new insights from the euro area credit register
Published as part of the Macroprudential Bulletin 19, October 2022.
This article examines links between Commercial Real Estate (CRE) markets and financial stability. The global financial crisis demonstrated the implications of CRE boom-bust cycles for the stability of many countries’ financial systems. However, CRE risk assessment and macroprudential policy frameworks remain in their infancy due to both the markets’ complexity and the persistence of data gaps. This article takes steps towards closing a number of data gaps by using euro area credit register data to examine the size and nature of links between euro area (EA) banks and CRE markets. Moreover, given that this dataset covers the COVID-19 pandemic crisis period, the operation of these transmission channels can be seen in action, providing insight into how economic theory plays out in practice.
1 Commercial real estate and financial stability – key players and transmission channels
Dynamics in CRE markets can have serious implications for financial stability, although the complexity of the market and persistent data gaps pose challenges for risk assessment and mitigation. As outlined in the Bulletin’s lead article, the exposures of euro area banks to CRE market are smaller than their exposures to residential real estate (RRE) markets. Nevertheless, CRE boom-bust cycles can still have serious financial stability consequences, as seen in many countries during the global financial crisis (GFC). Risk assessment and macroprudential policy frameworks for CRE remain underdeveloped compared with those for RRE. This is due both to the complexity of the CRE market and to persistent data gaps. This article begins by outlining the key transmission channels for CRE risks to the financial system. It then presents novel analysis of euro area credit register data, making it possible to quantify bank-based transmission channels and to understand how the banking system responds to CRE market shocks.
Chart 1
A wide range of players are involved in CRE markets, with extensive participation by non-banks and international buyers
CRE market transactions by buyer type and origin - 2015-2019
(% total value of transactions)
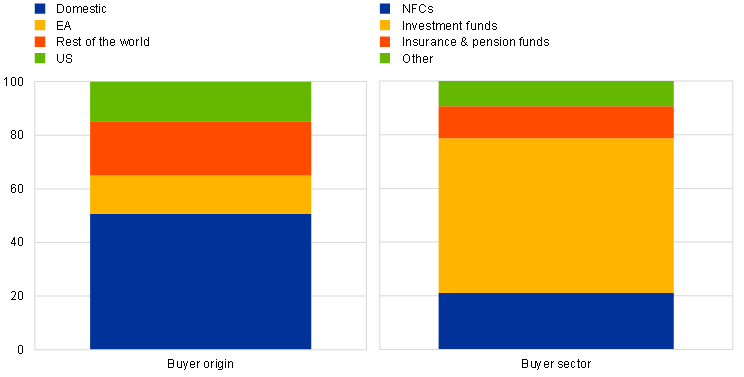
Source: Real Capital Analytics (RCA)
Notes: NFCs stands for non-financial corporations.
The composition of CRE markets differs markedly from that of RRE markets, with non-banks and international buyers playing a prominent role. As indicated in the Bulletin’s lead article, the main players in RRE markets are domestic households and the banks funding them. In contrast, between 2015-2019 investment funds accounted for 58% of purchases in euro area CRE markets (Chart 1). Non-financial corporations (NFCs) accounted for only 21%. Over the same time period, only half of transactions were carried out by domestic counterparties, with 14% of counterparties coming from other parts of the euro area and 35% from outside the euro area. Non-bank market participants are typically owners of CRE assets and are consequently directly exposed to losses in the event of price drops. For investment funds such losses may trigger materialisation of risks associated with excess leverage and liquidity transformation.[1] Given that the financial stability implications of both these risks were recently been discussed in ESRB (2021)[2], the rest of this article focuses on the risks arising from banks’ CRE exposures.
Banks are exposed to CRE markets through loans made for CRE purposes and through the use of CRE as collateral, with the latter also linking CRE market dynamics to wider credit conditions through the collateral channel. Banks are exposed to CRE markets when they make loans to firms involved in CRE activities, as a market shock increases the credit risk on these exposures. CRE is also extensively accepted as collateral by banks, exposing them to increased losses if a borrower default coincides with a drop in collateral values. Moreover, economic theory suggests that the use of CRE as collateral may create a financial accelerator effect by linking CRE market prices to borrowers’ access to credit. This mechanism may exacerbate excesses in the upswing of the cycle and amplify losses in a downturn.[3] For example, when CRE prices fall this may reduce banks’ willingness to lend to firms that rely on CRE as collateral. Where this restricts firms’ capacity to fund further CRE purchases, this collateral channel may amplify the original CRE market price drop, creating a feedback loop. Where this channel restricts firms’ capacity to borrow for other purposes, the collateral channel may create a link between CRE prices and wider credit conditions.
2 Challenges arising from CRE markets
Because the buyers, end-users and financing sources for CRE and RRE markets are different, the risk dynamics for these markets can diverge from one another. For example, while exuberance in RRE markets accelerated over the course of the COVID-19 pandemic, the CRE market entered a risk materialisation phase. Behavioural change arising from lockdowns (working from home and shop closures) presented a medium-term challenge to prices for office and retail (shopping centre) assets. The gradual withdrawal of investors from retail commercial property seen prior to COVID-19 accelerated, with annual price growth in prime retail commercial property markets reaching a low of -18% in 2020. Of course, some types of CRE benefitted from the changes brought about by COVID-19, with Industrials benefiting from the rise in e-commerce as customers shifted their purchases from physical stores to online sources. Pandemic-related experience with remote working, health concerns and stronger demand for more environmentally friendly buildings also significantly reduced demand in non-prime markets. These sectoral and asset quality trends are clearly visible from survey data showing investors’ price growth expectations (Chart 2). Further discussion of these risk dynamics can be found in Chapter 1.5 of the ECB’s May 2022 Financial Stability Review[4].
Chart 2
CRE markets have faced significant headwinds in recent years, with prices across low-quality and retail assets falling
12-month price growth expectations - quarter 1, 2022
(percentage)
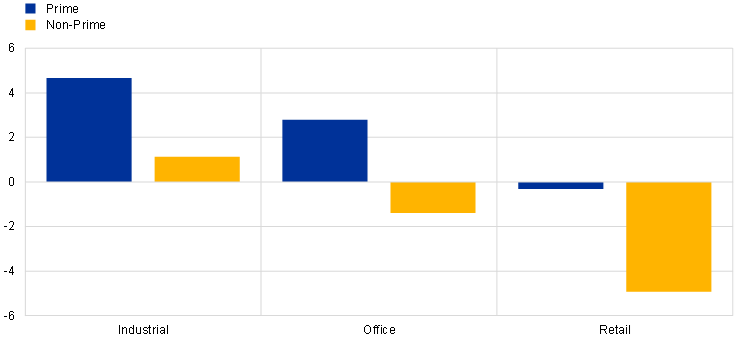
Source: Royal Institution of Chartered Surveyors (RICS).
The complexity of CRE markets has also hampered the development of a macroprudential toolkit to mitigate CRE risks. While macroprudential tools have been widely used in RRE markets in recent years (see also article 2), the use of tools to tackle CRE risks remains limited. First, the range of market participants poses a challenge to the use of macroprudential policy, given that the macroprudential toolkit remains primarily bank based.[5] The extensive participation of non-banks and international investors also limits the data available to authorities seeking to understand risks in the market and to calibrate the available range of tools. Finally, the complexity of banks’ exposures to CRE markets also poses a challenge to understanding the risks, although the next section closes an important data gap in this regard by quantifying the various bank-based transmission channels and illustrating how the banking system responds to CRE market shocks, and specifically the COVID-19 shock.
3 Using euro area credit register data to understand the transmission of CRE risks through the banking sector
Euro area credit register data show that a third of euro area NFC loans are exposed to CRE markets and that these exposures extend beyond the real estate sector. The ESRB defines a “CRE loan” as a loan whose purpose or collateral is associated with CRE. AnaCredit – a credit register data set providing loan-level information on euro area banks’ loans to NFCs – makes it possible to identify both the loan purpose and collateral type and therefore to quantify the transmission channels discussed above.[6] In June 2022, 25% of NFC loans had a CRE purpose and hence were exposed to CRE markets through the credit risk channel. 29% used CRE collateral and were therefore exposed through the collateral channel. The overlap between these groups is substantial, with 16% of loans exposed to CRE markets due to both their purpose and their collateral. However, a further 12% of loans use CRE as collateral for non-CRE loans, suggesting that fluctuations in CRE prices could indeed have implications for wider NFC credit (Chart 3, panel a). These euro area aggregates mask substantial country-level heterogeneity, with over half of NFC loans exposed to CRE in some countries. Looking at the types of firms that have taken out these loans; 61% of CRE loans are to real estate firms or construction firms but the remainder are to firms in other sectors of the economy (Chart 3, panel b). Again, this suggests capacity for substantial spillovers from CRE markets to other parts of the real economy.
Chart 3
AnaCredit data shows that a third of NFC loans are exposed to CRE markets and make it possible to identify which transmission channels are at play for each loan
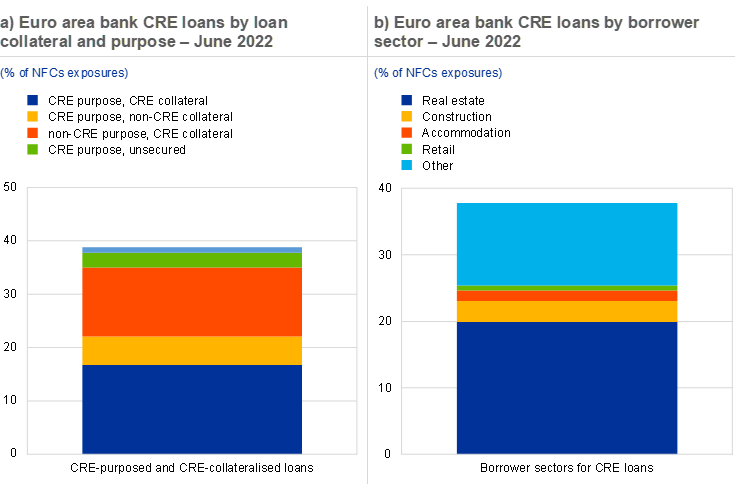
Sources: ECB calculations and AnaCredit.
Notes: A loan is considered to be CRE-purposed if it is flagged as a CRE purchase, an RRE purchase or a construction purchase. A loan is considered to be CRE collateralised if its collateral is flagged as CRE, RRE or Offices and commercial premises. It should be borne in mind that RRE purchased by non-households is considered to be a CRE purchase (see lead article).
With the onset of the COVID-19 pandemic, banks reduced their CRE lending, potentially aggravating the impact of the original market shock. The AnaCredit sample covers the COVID-19 pandemic crisis period and can therefore be used to examine how these transmission mechanisms operate during periods of stress. The outbreak of the pandemic saw a sharp rise in new lending by euro area banks, but this did not extend to CRE-purposed lending (Chart 4). More specifically, loans for CRE purchases declined during the period, although total NFC new lending by the banking system more than doubled. Lending trends across all types of CRE remained subdued compared with wider lending for the rest of 2020. This may have exacerbated the stress experienced by CRE firms over the course of the pandemic, as flagged at the time in the ECB’s May 2021 Financial Stability Review[7]. Focus 5 shows that similar dynamics played out for firms reliant on CRE collateral, suggesting that CRE market dynamics also affected credit through the collateral channel.
Chart 4
The COVID-19 pandemic had a clear impact on banks’ CRE lending decisions during the pandemic
Monthly new NFC lending by loan purpose
(Index = 100 at January 2020)
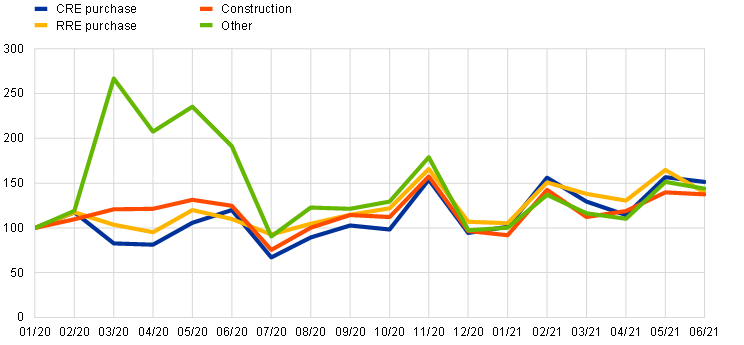
Sources: ECB calculations and AnaCredit.
Note: Only new loans with initial maturities greater than 2 years are included
Despite the large market shock, credit risk materialisation has been limited and asset disposals continue to strengthen bank portfolios. AnaCredit data make it possible to identify non-performing loans (NPLs) and also to identify when a loan became an NPL. The NPL ratio for euro area CRE-purposed loans, as revealed by AnaCredit data, actually declined between February 2020 and December 2021. AnaCredit data show that 0.6% of the December 2021 stock became NPLs during the pandemic (yellow part of the right-hand scale in Chart 5), meaning that it was likely that the market drop had some impact on credit. The overall effect on the NPL ratio was, however, offset by on-going efforts to reduce the stock of legacy CRE NPLs through asset disposals.
Chart 5
Despite the large market shock, credit risk materialisation has been limited to date
NPL ratio for CRE-purposed loans – February 2020 to June 2022
(% of CRE-purposed loans)
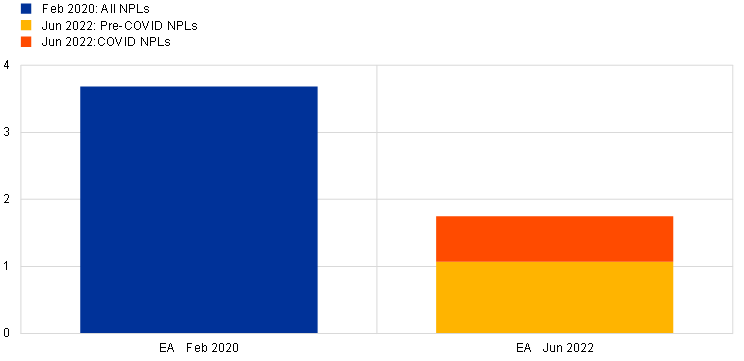
Sources: ECB calculations and AnaCredit.
Note: A loan is classified as a COVID NPL if it transitioned to NPL status after 15 March 2020.
Regarding collateral, the large price moves in CRE markets over the course of the COVID-19 pandemic do not appear to have been fully reflected in banks’ revaluation behaviour. Using AnaCredit data on individual pieces of collateral, revaluations of real estate collateral by banks can be identified and studied for the first time. In Chart 6, the stock of euro area CRE collateral is broken down by the size of its revaluation over the course of 2019, 2020 and 2021 and by the type of CRE collateral.[8] The Chart 6, left-hand panel, shows that there was some increase in the proportion of income-producing CRE collateral being revalued downwards over the course of 2020 and 2021 and a decrease in the proportion of collateral not revalued. However, these changes were not large, particularly when considered in light of the wider market dynamics. In contrast, RRE collateral saw substantial downward revaluations, despite strong market price growth (Chart 6, middle panel). This may reflect automatic haircuts applied to collateral over time under certain valuation methods. Where firms use their own premises as collateral, as opposed to income-producing or investment buildings, revaluations appear to be particularly infrequent (Chart 6, right-hand panel). On one hand, this may reduce the sensitivity of credit supply to market prices but, on the other, it may also force banks to make large downward revaluations of collateral in the event of default. Despite the limited revaluation response to the COVID-19 pandemic, Focus 5 shows that when collateral revaluations do occur, they have implications for subsequent lending, particularly when borrowers are highly leveraged.
Chart 6
The large moves in both RRE and CRE prices over the course of the COVID-19 pandemic do not appear to have been fully reflected in bank revaluation behaviour
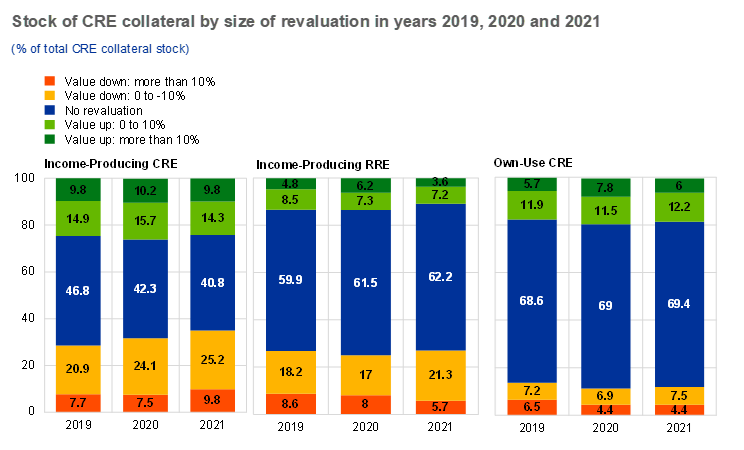
Sources: ECB calculations and AnaCredit.
Notes: A loan is considered CRE collateralised if its collateral is flagged as CRE, RRE or Offices and commercial premises. The first two categories are labelled as Income-producing and the final category as Own use to reflect the link between cash flow on the property and the firms’ credit risk, which should be absent in the last category. It should be borne in mind that RRE purchased by non-households is considered to form part of CRE (see the lead article).
4 Conclusion
The links between CRE markets and financial stability are complex, but new data sources, such as AnaCredit, can help deepen our understanding of risks in the market. Data gaps remain a major barrier to developing risk assessment and macroprudential policy for CRE markets. AnaCredit data makes it possible to close a number of these gaps in the banking system by helping to quantify banks’ CRE exposures through credit risk and collateral. Given that the AnaCredit data set covers the COVID-19 pandemic, it also provides insight into the complex way in which these transmission channels play out following a shock. Our findings underscore the importance of high-quality data to gain an understanding of how economic theories play out in practice.
References
Bernanke, B. S., Gertler, M. and Gilchrist, S. (1999), “Chapter 21 - The financial accelerator in a quantitative business cycle framework”, Handbook of Macroeconomics, Vol. 1, Part C, pp. 1341–1393.
ECB (2021), “Financial Stability Review”, Frankfurt am Main, May.
ECB (2022), “Financial Stability Review”, Frankfurt am Main, May.
European Systemic Risk Board (2021), “Commercial real estate – liquidity and leverage risks in investment funds”, EU Non-bank Financial Intermediation Monitor, Special feature 1, Frankfurt am Main, August.
Kiyotaki, N. and Moore, J. (1997), “Credit Cycles”, Journal of Political Economy, Vol. 105, Issue 2, pp. 211-248.
Real estate investment funds are exposed to liquidity risks due to the illiquidity of the assets they hold. Following large-scale investor redemptions, for example following a drop in the value of a fund’s assets, fund managers may be forced to engage in firesale activity to raise enough liquidity to meet redemptions. This can create a vicious cycle whereby firesales further depress the value of the fund’s assets and so trigger further redemptions. Where investment funds make use of leverage, this increases their exposure to fluctuations in market prices.
See ESRB (2021).
For example, see Kiyotaki and Moore (1997) and Bernanke et al. (1999).
See the May 2022 issue of the ECB Financial Stability Review.
The banking sector tools available to address CRE exposures include capital-based measures under Articles 124 and164 of Capital Requirements Regulation No 575/2013 (CRR) and, potentially, a range of other instruments, including capital based measures and large exposures limits under Article 458 CRR, although their use in this regard remains limited.
For further details of the AnaCredit project see the page entitled “What is AnaCredit” on the ECB website.
See the May 2021 issue of the ECB Financial Stability Review.
As specified in the lead article, when RRE assets are owned by players other than households, they are considered to be a form of CRE.