


What makes banks adjust dividend payouts?
What makes banks adjust dividend payouts?
Published as part of the Macroprudential Bulletin 13, June 2021.
This contribution reviews historical drivers of bank dividend payouts in the euro area. Economic literature presents three main reasons for adjustments to dividend payouts: asymmetric information between shareholders and management, the presence of agency costs, and regulatory constraints. Using a panel data approach, the article finds evidence supporting all three hypotheses. Banks lower dividends after facing a decline in profits and capital, but counterfactual simulations show that this adjustment could be small. Regulatory restrictions may therefore be warranted in the event of large expected losses or heavy uncertainty.
1 Introduction
Various elements of the regulatory and prudential framework are in place to constrain dividend payouts by banks. Banks remunerate their shareholders for the risks of holding bank equity through discretionary and variable dividend payouts, usually set annually by decision of a general meeting of shareholders, acting on a recommendation by the bank’s management. European regulations provide for automatic restrictions on dividend distributions, the so-called maximum distributable amount, which preserves a bank’s capital base by retaining profits when a bank falls below a pre-defined level of capital. Regulators have also introduced further restrictions, related for example to state-aid rules. The European Systemic Risk Board (ESRB) recommended that banks should not pay dividends in 2020 due to the COVID-19 pandemic and also to conserve capital for loss absorption and maintaining loan supply.
2 Data and methodology
Bank dividend payouts have varied in a seemingly procyclical – albeit heterogeneous – way over the business and financial cycle. They reached a high point immediately prior to the global financial crisis and declined in its aftermath (Chart 1) as regulatory requirements were tightened and banks’ profitability fell (Chart 2). However, there has been a high cross-sectional variance in every year for which the data are available, indicating that bank-specific circumstances play a large role in determining payout policies.
Chart 1
Bank dividend payouts fluctuated over time, with large variance across banks
Distribution of dividend payouts by euro area banks over time
(y-axis: dividend payout as a percentage of total after-tax earnings; whiskers: 5th and 95th percentile)

Sources: SNL Financial, ECB calculations.
Chart 2
Two offsetting factors have played an important role in determining the evolution of dividend payouts
Distribution of return on assets (RoA) (left-hand panel) and capitalisation by euro area banks over time
(left - y-axis: RoA; right - y-axis: capital over RWA; whiskers: 5th and 95th percentile)
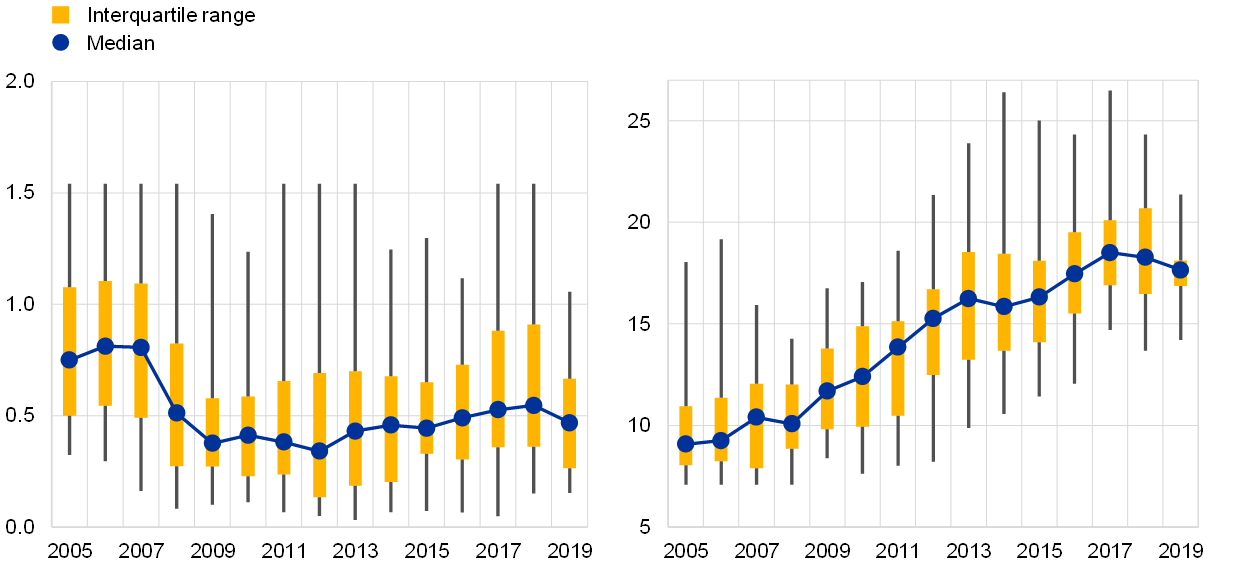
Sources: SNL Financial, ECB calculations.
Economic literature suggests that dividend policies might vary due to asymmetric information, agency costs, and regulation. While the Modigliani-Miller theorem would suggest that, with perfect information and in the absence of tax distortions, dividend policies are irrelevant to the value of the firm, its assumptions may not be a fit to the specific aspects of banks. In particular, there are three main strands of literature analysing dividend policies which apply nicely to banks.[1] First, according to the signalling theory, managers may know more about the true value of their firm than investors. Dividend announcements convey information about future earnings, so more profitable banks may be expected to pay higher dividends.[2] Second, the incomplete contract strand suggests that agency costs, associated with a conflict between stockholders, management, and bondholders over dividend policy would lead larger firms to pay higher dividends,[3] while better investor protection allows investors to reduce agency costs by effectively forcing management to pay out dividends. Finally, the regulatory strand suggests that banks are constrained by regulators in their dividend payout policy, implying that better capitalised banks pay higher dividends.[4]
This article explores these hypotheses in an empirical context of the euro area banking sector, using panel data approaches. We use two complementary unbalanced panels of euro area banks. The sample of listed banks covers 69 banking groups observed over 2005-2019, with data collected from SNL Financial. The second panel covers about 1,400 banks, a large majority of which are unlisted, over a shorter period (2010-2019) and the data was collected from Orbis BankFocus. We adopted a Tobit specification to account for the fact that bank dividend payouts are truncated at zero, and also used a standard panel approach as a robustness check.[5] In order to limit the effect of outliers, and in particular to exclude banks that may be subject to non-disclosed supervisory restrictions on distributions,[6] banks with negative after-tax earnings and capital ratios were excluded.
We aimed to identify the bank-specific characteristics that explain the changes in the bank dividend payout ratio. The dependent variable was defined as a ratio of total dividend payout over total after-tax earnings. Leveraging on the existing literature encompassing the key variables explaining dividend payout, variants of the following equation were estimated in the first stage:
where DP denotes dividend payout in bank i at time t, which is explained by signalling hypothesis variables (SHV), agency hypothesis variables (AHV), regulatory hypothesis variables (RHV), and other variables (OV).
In line with the literature, we used indicators of profitability to validate the signalling hypothesis, and bank size to validate the agency cost hypothesis. We also used a minority shareholder protection indicator, obtained from the World Bank’s Doing Business surveys, as a measure of investor protection that might provide additional evidence for the agency cost hypothesis. Capital ratios were used to seek evidence for the regulatory cost hypothesis.[7] For robustness purposes, we employed both a risk-weighted capital ratio (equity over risk-weighted assets) and a balance-sheet-leverage ratio (equity over total assets) as indicators of capitalisation, and two indicators of profitability (return on assets and return on equity). Finally, we used GDP growth and time-fixed effects to control for changes in the macroeconomic and financial environment. All dependent variables were lagged by one year to mitigate potential endogeneity associated with simultaneity and to account for the fact that bank dividend payouts are determined by shareholder meetings early in the financial year, based on financial information available for the previous year.
3 Results
Empirical results suggest that bank dividend payouts are related to capitalisation, profitability, size and institutional framework, supporting all three hypotheses presented in the literature (see Table 1). In line with the regulatory hypothesis, better capitalised banks tend to pay out a larger share of their profits to shareholders, although the immediate effect of an increase in the capital ratio was estimated to be relatively moderate. An increase in the capital ratio by 1 percentage point translates into the payout ratio increasing by between less than 0.2 and almost 1 percentage points, with a stronger effect for listed banks. Similarly, the results are aligned with the signalling hypothesis, as more profitable banks tend to pay out higher dividends, again with a stronger relationship identified for listed banks. The posited influence of agency costs on payout ratio is also supported by the findings, as banks operating in countries where investors are better protected by law and larger banks tend to pay higher dividends. The sensitivity of payouts to the level of institutional protections is stronger for unlisted banks, tentatively pointing to a beneficial effect of the transparency associated with listed banks on agency costs. Furthermore, higher credit risk is associated with smaller pay-outs, which may suggest that banks retain earnings to shore up their balance sheets against future credit losses. Finally, dividend policies seem relatively stable over time, particularly for listed banks. However, there is no significant relationship between the economic cycle and dividend policies.[8]
Table 1
Bank-specific variables explain the variation in dividend payouts
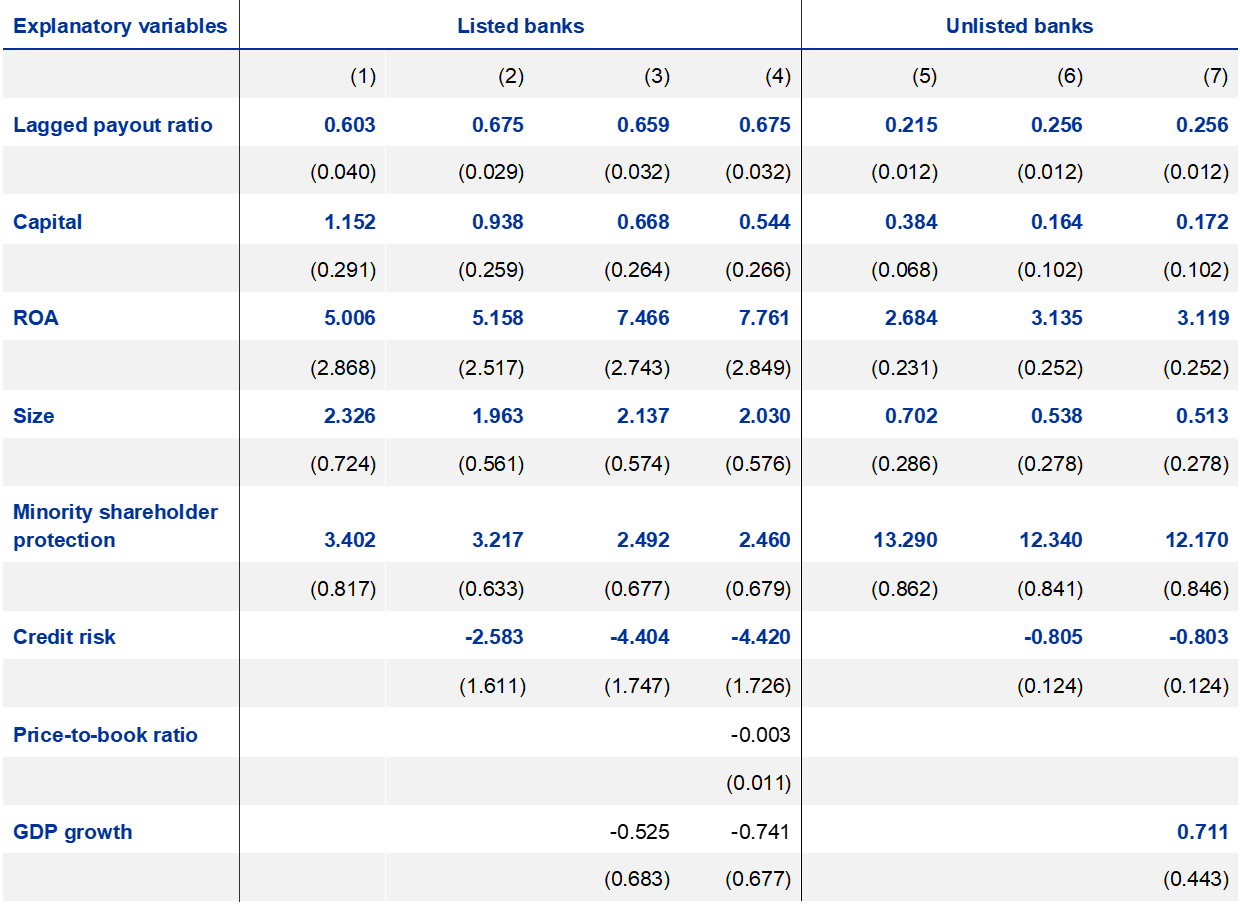
Sources: ECB calculations based on Orbis BankFocus, SNL Financial, and World Bank data.
Note: All regressions include time-fixed effects and employ a Tobit specification. Bold denotes coefficients significant at a 10% level. Standard errors reported in brackets. A price-to-book ratio is included in the regressions only for listed banks. ROA proxies asymmetric information (SHV), shareholder protection and size (expressed as a log of assets) proxy agency cost (AHV), capital (expressed as regulatory capital over RWA) proxies regulatory constraints (RHV), price-to-book ratio proxies forward-looking variables while remaining variables capture remaining effects.
A simulation exercise shows that, in absence of the 2020 recommendation to withhold paying dividends, a significant part of bank profits would have been paid out to shareholders. Using the econometric specifications (1) to (6) and actual realisations of capital and profitability up to the third quarter of 2020, we estimated the counterfactual payout ratios for the sample of 30 listed euro area banks. The results suggested that payout ratios would be adjusted downward by most banks, although the adjustment would be small (up to 4 percentage points for most banks), reflecting the decline in profits and a broadly steady level of capital. Some of the banks projected to decrease payouts did not pay any dividends in 2020 (Chart 3). Together with a projected moderate increase in payouts by two banks, this would lead to an almost unchanged total value of distributions, of about EUR 19 billion, for this group of banks. This simulation comes with a caveat that, as the COVID-19 crisis led to economic disruptions that were unprecedented in Europe in peacetime, the relationships identified from the data may no longer hold true. Its results should therefore be viewed with some caution as the magnitude of the reduction in dividends would then, in all likelihood, be understated.
Chart 3
Simulation results suggest payouts would have been slightly lower in 2020 than in 2019
Estimated changes in bank dividend payouts in 2020
(left- y-axis: estimated change in payout ratios in 2020, percentage points; right - x-axis: payout ratio in 2019, y-axis: estimated change in payout ratio in 2020)
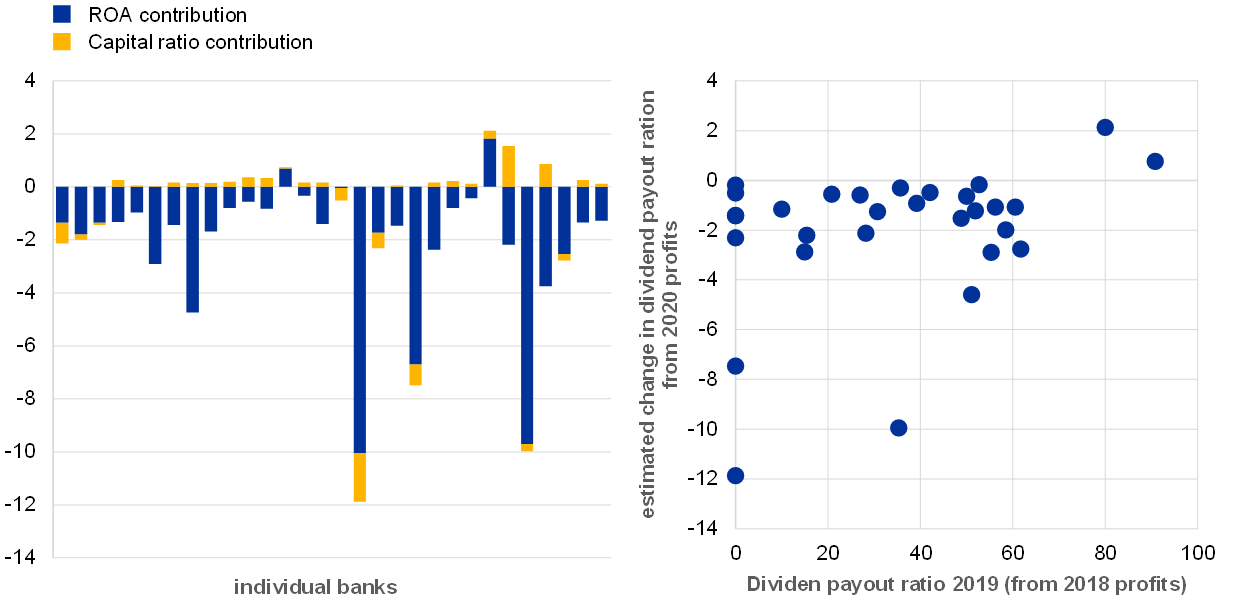
Sources: ECB supervisory data, ECB calculations.
4 Policy implications
These results indicate that dividend restrictions may be necessary to retain capital in times of heightened economic uncertainty. Absent prudential constraints, endogenous adjustment of dividend policies by banks based on economic and financial driving factors would be expected to reflect weaker profitability and capitalization. The adjustment would be limited in magnitude and might come with a lag. Therefore, regulators may need to impose restrictions on dividend payouts with a more forward-looking view than that of the banks, especially in presence of great uncertainty about the financial impact of a developing crisis. The findings imply that it would be justified to discount future expected losses and capital constraints when designing such restrictions.
References
Abreu, J. F. and Gulamhussen, M. A. (2013), “Dividend payouts: evidence from U.S. bank holding companies in the context of the financial crisis”, Journal of Corporate Finance, Vol. 22, pp. 54-65.
Allen, F., and Michaely, R. (2003), “Payout policy”, in Constantinides, G.M., Harris, M. and Stulz, R.M. (eds.), Handbook of the Economics of Finance, vol. 1, Part 1, ch. 07, Elsevier, pp. 337-429.
Amore, M.D. and Murtinu, S. (2019), “Tobit models in strategy research: Critical issues and applications”, Global Strategy Journal, pp. 1-25.
Ashraf, B.N, Bibi, B. and Zheng, C. (2016), “How to regulate bank dividends? Is capital regulation an answer?”, Economic Modelling, Vol. 57, pp. 281-293.
Belloni, M., Grodzicki, M. and Jarmuzek, M. (2021), “What makes banks adjust dividend pay-outs”, mimeo.
Boldin, R. and Leggett, K. (1995), “Bank dividend policy as a signal of bank quality”, Financial Services Review, Vol. 4, pp. 1-8.
Casey, K.M. and Dickens, R. (2000), “The effects of tax and regulatory changes on commercial bank dividend policy”, Quarterly Review of Economics and Finance, Vol. 40, pp. 279-293.
Fama, E. and Babiak, H. (1968), “Dividend Policy: an Empirical Analysis”, Journal of the American Statistical Association, Vol. 63, pp. 1132-1161.
Fama, E. and French, K. (2001), “Disappearing dividends: changing firm characteristics or lower propensity to pay?”, Journal of Financial Economics, Vol. 60, pp. 3-43.
Forti, C. and Schiozer, R. (2015), “Bank dividends and signalling to information-sensitive depositors”, Journal of Banking and Finance, Vol. 56, pp. 1-11.
Kent Baker, H. and De Ridder, A. (2018), “Payout policy in industrial and financial firms”, Global Finance Journal, Vol. 37, Issue C, pp. 138-151.
Kroszner, R. and Strahan, P. (1996), “Regulatory incentives and the thrift crisis: dividends, mutual-to-stock conversions, and financial distress”, Journal of Finance, Vol. 51, pp. 1285-1319.
Lintner, J. (1956), “Distribution of incomes of corporations among dividends, retained earnings and taxes”, American Economic Review, Vol. 46, pp. 97-113.
Theis, J. and Dutta, A. (2009), “Explanatory factors of bank dividend policy: revisited”, Managerial Finance, Vol. 35, pp. 501-508.
See Allen and Michaely (2003). Due to data limitations, the tax distortion strand was not covered.
Evidence that this holds true for banks can be found in Boldin and Leggett (1995) and Forti and Schiozer (2015).
See Fama and French (2001) for corporates and Abreu and Gulamhussen (2013) and Ashraf et al (2016) for banks.
See, in particular, Kroszner and Strahan (1996), Casey and Dickens (2000) and Theis and Dutta (2009).
Amore and Murtinu (2019) provide a discussion of methodologies suitable for corporate finance strategy applications.
Supervisors have powers to prohibit dividend payouts by banks that are in breach of capital requirements. It follows from this that such distressed banks may not adjust their dividend policies in line with economic factors, unlike other, more healthy banks.
Drawing on seminal papers by Lintner (1956) and Fama and Babiak (1968), as well as more recent evidence from Kent Baker and De Ridder (2018), the relevance of dividend history was also examined to check if and to what extent banks choose to smooth out their dividend policies.
Further robustness checks and extensions analysing whether bank dividend policies systematically account for expectations of future economic and financial conditions are available in Belloni, Grodzicki and Jarmuzek (2021), mimeo.