
Climate-related risks to financial stability
Published as part of the Financial Stability Review, May 2022.
The ECB is continuing its work on incorporating climate-related risks into assessments of financial stability. This includes a new analysis of disclosure, pricing and greenwashing risks in financial markets, as well as continued monitoring of financial institutions’ exposure to transition and physical risks. There is some encouraging evidence of better disclosure by non-financial corporations and increasing awareness of climate-related risks in financial markets. Progress made by banks, however, has been more limited. Established and newer metrics show no clear evidence of a reduction in climate-related risks, revealing instead a potential for amplification mechanisms stemming from exposure concentration, cross-hazard correlation and financial institutions’ overlapping portfolios. These findings can inform evidence-based international and European policy debates around climate-related corporate disclosure, standards for sustainable financial instruments and climate-related prudential policies. More generally, amid high uncertainty around governments’ transition policies in an environment of volatile energy prices, further investments in the transition to a net-zero economy would also have a positive impact on medium-term growth and energy security.
1 Introduction
Climate change has, for a number of years, been identified as a source of systemic risk, with potentially severe consequences for financial institutions and financial markets alike.[2] As our awareness of this risk has grown, the ECB has enhanced its approaches to understanding, monitoring and assessing the nature of climate risks and how such risks are evolving over time. Furthermore, the recent price increases and volatility seen in energy markets have underlined the wider value of supporting the transition to a net-zero economy. This special feature presents the latest developments, starting with a focus on green financing, which is needed to support the transition to a net-zero economy. The subsequent sections then provide updated assessments of bank and non-bank exposures to climate risks, by introducing aspects such as the link between climate risk and financial risk in exposures, concentration of exposures and correlations between hazards.
2 Increasing role of green finance in supporting the transition to a low-carbon economy
Sustainable markets continued to grow globally in 2021, mostly thanks to an increased volume of euro area ESG funds and green bonds (Chart A.1, panel a). Their growth has accelerated over the last two years, with euro area sustainable assets doubling since 2019, although sustainable markets still only account for 10% of the euro area investment fund sector and 3% of outstanding bonds. These developments reflect the expected green investment through the EU recovery fund (NextGenerationEU), and the sharp increase in the number of financial institutions that have made net-zero commitments.[3] However, maintaining such momentum requires that decisive regulatory action be taken to strengthen capital markets beyond the sustainable finance segment and help channel investments towards green projects.[4]
Chart A.1
Sustainable financial markets continue to grow, while firms are increasingly disclosing climate information

Sources: Bloomberg Finance L.P., Urgentem, Refinitiv and ECB calculations.
Notes: Panel a: ESG funds correspond to all sustainable funds identified using Morningstar intentions attributes based on information provided in funds’ prospectuses. Panel b: the sample includes NFCs listed in the S&P 500 and STOXX Europe 600 indices. “GHG” stands for greenhouse gas, “NFCs” stands for non-financial corporations.
Empirical evidence suggests that (green) finance supports green investment and the reduction of emissions, with some differences across financing instruments and firm types.[5] While research has suggested that a higher share of equity financing is associated with greater reductions in countries’ carbon footprints, debt is the primary source of external financing for NFCs in the EU and is also used to support the development and adoption of new (greener) technologies. An analysis of changes in emissions at over 4,000 European carbon-intensive firms between 2013 and 2019 provides evidence that, up to a certain point, debt has a positive impact on environmental performance in subsequent years: firms reduce their emissions by investing in green technologies, without reducing economic activity. However, when a firm is too indebted, higher leverage is associated with higher emissions as firms then tend to invest less in energy efficiency.[6]
In recent years, more firms have been disclosing both their exposure to transition risk and their emission reduction targets, but gaps in disclosure practices remain significant, signalling the need for international standards. More NFCs have been disclosing data on GHG emissions and setting emission-reduction targets over time, with high-emitting firms disclosing the most data, likely reflecting their greater exposure to public scrutiny (Chart A.1, panel b). Although a large part of this disclosure is verified by a third party, the risk of greenwashing remains high in the absence of global mandatory reporting requirements. In addition, although there has been an improvement in the climate-related disclosures of European banks since 2020, banks are not fully meeting supervisory expectations and gaps remain, especially regarding banks’ emission-reduction targets and interim milestones.[7] The prompt adoption of international disclosure standards across jurisdictions would allow investors to price and measure transition risk more effectively, while also supporting the transition to a low-carbon economy.[8] In particular, although there is evidence that firms which set an emission-reduction target have a lower credit risk and tend to reduce emissions more than other firms in subsequent years, the credibility of firms’ targets and their alignment with the Paris Agreement goals are difficult to assess.[9]
Against this background, capital markets remain susceptible to greenwashing, and only the most credible green bonds seem to benefit from cheaper funding. The growth of green bond markets could help stimulate the integration of European capital markets.[10] But the credibility of green bonds and/or their issuers appears to determine whether green bonds trade at a greenium – with lower spreads than for conventional bonds – in secondary markets (Chart A.2, panel a). Only green bonds with an external review, issued by firms in green sectors (e.g. alternative energy) or by banks which are members of the United Nations Environment Programme Finance Initiative (UNEP FI) exhibit a greenium. As ESG and green funds keep attracting new investors, the demand for green bonds and the greenium has also increased over time (Chart A.2, panel b).[11] New instruments, such as sustainability-linked bonds, which link borrowing costs to specific company-level sustainability targets, partly address investor concerns about greenwashing in the green bond market. Greenwashing also poses a risk to financial stability because it could lead to an undervaluation of transition risk and to potential fire-sales of green bonds. A common regulatory standard that requires regular standardised reporting, impact assessment and review by approved external reviewers, as proposed under the EU Green Bond Standard, would provide assurance that green bonds effectively finance the transition and alleviate risks to financial stability. Implementing this standard and making it mandatory within a reasonable period of time could enhance investor confidence in this asset class, reinforce flows of funding to the transition and reduce risks to financial stability.[12]
Chart A.2
The greenium depends on bond and issuer credibility and has evolved over time

Sources: Bloomberg Finance L.P., CSDB, and Pietsch and Salakhova.
Notes: Panel a: negative values indicate a greenium, as indicated by the shaded area. “All bonds” refers to all euro area bonds satisfying the International Capital Market Association (ICMA) use-of-proceeds principle, “Simple green” refers to bonds that are classified as green but have not been third-party reviewed, “External review” refers to only those bonds that satisfy all principles promoted by the ICMA and which have been externally reviewed, “UNEP FI bank” refers to bonds issued by banks that are members of the UNEP FI, and “Alternative energy” refers to bonds issued by the alternative energy sector. The estimated greenium is derived from a regression of the daily closing option-adjusted spread of each bond on multiple control variables and a green bond indicator equal to 1 if a bond is green. Negative estimates of the coefficient on the green bond indicator show a greenium as green bonds trade at tighter spreads. Panel b: the coefficient of this indicator is depicted for monthly sub-samples.
ESG – and particularly environmental – funds seem to have reduced their carbon footprint over time, but divergent ESG fund classification across data providers points towards greenwashing risks in the sector. In the absence of an ESG label and a common definition of ESG and environmental funds, investors rely on self-disclosure by asset managers and classifications from commercial data providers. The level of disagreement between these classifications is high (Chart A.3, panel a): the three main data providers agree in less than 20% of cases that a fund is ESG (317 funds out of more than 1,800 funds which are defined as ESG by at least one data provider). In this context, well-designed labels could materially reduce the risk of greenwashing. At the same time, environmental and other ESG funds do appear to have reduced the emission intensity[13] of their portfolios by more than non-ESG funds over the last four years (Chart A.3, panel b). But the extent to which this is driven by simply reshuffling portfolios towards already low-carbon sectors or by firms decarbonising – possibly due to supportive financing and activist pressure from impact investors – remains unclear, despite being important for the ultimate goal of transitioning to a net-zero economy.
Chart A.3
Agreement of data providers on ESG designation of funds is limited, although ESG funds have tended to reduce the emission intensities of their portfolios

Sources: Morningstar, Bloomberg Finance L.P., Refinitiv Lipper for Investment Management and ECB calculations.
Notes: Panel a: each bubble represents the number of different funds classified as ESG according to the providers (Morningstar, Bloomberg and Lipper). The numbers in the overlapping areas of the bubbles correspond to the funds identified either by two or by all three providers. Panel b: the chart shows average emission intensity of funds in each category. Categories are identified using Morningstar intentions attributes based on information provided in funds’ prospectuses. E funds are identified using environmental attributes; ESG funds correspond to all sustainable funds; “tCO2e” stands for tonnes of carbon dioxide equivalent.
3 Limited change in financial system exposures to transition risk
While firms’ emissions have been decreasing, exposures of euro area banks to currently high-emitting firms have remained broadly stable. Around two-thirds of the corporate credit exposures held by euro area banks are still directed towards high-emitting firms, which are mainly concentrated in the manufacturing, real estate and retail sectors (Chart A.4, panel a).[14] Also, around 30% of both bank and non-bank holdings of securities issued by NFCs with known emission levels are currently issued by high-emitting firms, a share which has only decreased slightly over the last five years. At the same time, the recent increases and volatility in energy markets have underlined the urgency of supporting the transition to a net-zero economy.
Metrics commonly used to assess corporate sector climate risks point to a small increase in carbon intensity in bank portfolios. Only a few (mainly large and highly exposed) banks have significantly decarbonised their credit portfolios since 2018, as measured by the loan-weighted emissions of the respective borrowers (Chart A.4, panel b). By contrast, two-thirds of banks have increased their loan-weighted emissions. The measures may still be missing the interaction between climate risk and financial risk of loans.
Chart A.4
While firms’ emissions have been decreasing, the financial system’s exposures to high-emitting firms have remained broadly stable

Sources: AnaCredit, Securities Holdings Statistics by Sector, Urgentem and ECB calculations.
Notes: Panel a: high/low emitters are defined here as firms with reported emission intensity in the top/bottom 33% of the distribution across euro area bank borrowers as of end-2020, i.e. firms with an annual emission intensity registered in 2020 above 556 tCO2e/USD million and below 47 tCO2e/USD million. “ICPFs” stands for insurance corporations and pension funds; “IFs” stands for investment funds. Panel b: ”G-SIBs” stands for global systemically important banks.
Information on carbon emissions can be combined with the existing probability of default (PD) so a corporate borrower can provide a credit risk-adjusted metric of transition risk. The resulting score can be computed at bank level by aggregating loan-weighted borrowers’ emissions multiplied by their PDs over the bank’s entire corporate portfolio.[15] The PDs are included as a measure of credit risk and the GHG emissions are included as a measure of vulnerability to transition risk. Overall, the higher a firm’s contribution to the transition risk score, the higher its contribution to the bank’s financial risk induced by the combination of credit and transition risk, as long as PDs have not already accounted for the latter.[16]
The credit risk-adjusted measure supports signals obtained from emissions-to-loans ratio measures indicating that risk has increased over time.[17] Once adjusted for financial risk using borrowers’ PDs, estimated transition risk has increased since 2012, with significant increases in sectors that face more underlying transition risk. This has some correlation with the signals from unadjusted measures of transition risk (Chart A.5, panel a). Exposures to the mining, manufacturing and electricity sectors together account for around 70% of the euro area aggregate (Chart A.5, panel b). Some of these sectors make an almost negligible contribution to the emissions-to-loans ratio but they play an important role when the financial risk component is considered.
Chart A.5
PD-weighted measures of emissions can capture the financial component of banks’ climate risks and round out the picture provided by emissions-to-loans ratios

Sources: AnaCredit, Urgentem, Register of Institutions and Affiliates Database and ECB calculations.
Notes: Emissions refer to firm-level relative and absolute (loan carbon intensity) scope 1, 2 and 3 emissions. Panel b) uses two different underlying firm samples. The bar chart comprises inferred emissions for around 2.5 million firms in 2018, covering around 80% of total AnaCredit exposures. The capital letters refer to NACE codes as follows: A – Agriculture; B – Mining; C – Manufacturing; D – Electricity; F – Construction; G – Wholesale and retail trade; H – Transport. The time series covers both inferred and reported emissions for 1,250 firms, which comprise on average 10% of AnaCredit exposures over time. “NACE” stands for Nomenclature statistique des activités économiques dans la Communauté Européenne (Statistical classification of economic activities in the European Community).
Since climate-related risks simultaneously affect multiple seemingly unrelated exposures, their concentration in individual institutions plays a significant role. Climate-related concentration risks can arise from exposures that share similar sensitivities to physical risks (e.g. due to their location or activity) or transition risks (e.g. due to their sector allocation or level of emissions). Focusing on transition risk and assuming a disorderly transition scenario,[18] it appears that higher concentrations of exposures to firms with high emission intensity coincide with higher expected losses at bank level over a 30-year period (Chart A.6, panel a). Around 35% of system-wide expected losses are incurred by the 10% of banks with the highest sensitivity to carbon price increases. In addition, carbon price shocks trigger a significant increase in firms’ default correlations.[19] For a transition risk intensity of , capturing the cost due to increases in the cost of carbon borne by firms causes estimated average (median) correlations to double (Chart A.6, panel b). Transition risk not only leads to a source of novel correlation between previously uncorrelated or weakly correlated firms in general, but also increases correlations for high emitters[20] by ten times more than it does for low emitters.
Chart A.6
Climate-related concentration risk is a new form of concentration risk simultaneously affecting multiple, seemingly unrelated, exposures

Sources: AnaCredit, Urgentem, NGFS, Moody’s Credit Edge and ECB calculations.
Notes: Panel a: corporate loan portfolios of euro area significant institutions which represent 60% of total AnaCredit exposures. Panel b: euro area sample based on 500,000 Monte Carlo iterations. The parameter incorporates both the transition risk shock (€/tCO2) as well as a pass-through factorcapturing the degree to which firms can pass the cost of a transition risk shock on to consumers (Belloni et al., see footnote 19).
4 Systemic amplifications could result from interconnected physical risks arising from climate change
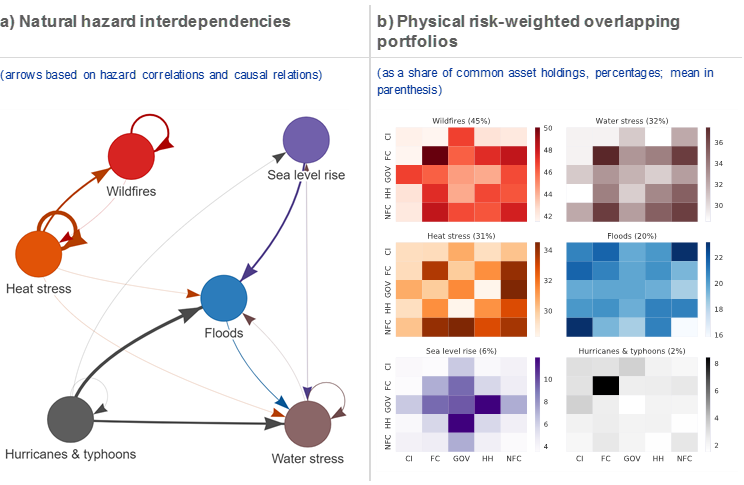
Financial stability risks arising from physical hazards are exacerbated by the fact that some investors hold assets which are vulnerable to multiple hazards. The occurrence of natural hazards is characterised by interactions between hazards in the form of either correlations or causal links (Chart A.7, panel a) which can generate self-reinforcing or feedback mechanisms. For example, the joint combination of thunderstorms and droughts (both captured by the “Heat stress” category in Chart A.7, panel a) can cause wildfires which, in turn, both increase the likelihood of more wildfires and exacerbate heat stress.[21] Future intensification of climate risk, especially when clustered hazards occur, may create hard-to-price tipping points and impair options for diversification, potentially posing financial stability risks, especially for securities with wider protection gaps.
In addition to the direct exposure to physical risk, the impact of physical hazards could be amplified by fire-sale dynamics. In the event of a sudden reassessment of risks affecting portfolios, the liquidation of securities exposed to potential hazards may affect market prices. This could result in contagion losses spreading by way of the common holdings of different market participants and, in worst-case scenarios, spiralling deleveraging pressures.[22] Constructing estimates of the common asset holdings (overlapping portfolios) exposed to the different physical risks[23] of different market participants (Chart A.7, panel b) reveals a range of estimates running from 2% of overlapping portfolios for the hurricanes and typhoons category to an average of 45% for portfolios weighted for wildfires.[24] In addition, the concentration of overlapping portfolios in specific sectors may further exacerbate such risks, as in the case of financial corporates, which are much more exposed to wildfires than other sectors.
Chart A.7
Interdependencies between natural hazards and financial sectors could lead to hard-to-price tipping points triggering concurrent revaluations affecting different investors
Sources: Gill and Malamud*, ECB (securities holdings statistics), Moody’s 427 and ECB calculations.
Notes: Panel a: links refer to both correlations and causal links. Arrow thickness is proportional to a score capturing either increased probability or causal trigger of hazards, in terms of both spatial overlaps and temporal likelihood. Aggregated from Gill and Malamud*. Self-loops refer to the increased likelihood of a given hazard conditional on the materialisation of the hazard itself due to associated self-reinforcing mechanisms. Panel b: overlapping portfolios weighted by physical hazard scores as a share of common asset holdings by aggregate sectors. The physical-risk-weighted overlapping portfolios between sectors and are reported as a share of common asset holdings, that is where denotes the holdings by sector of security , and the physical risk weight associated with the issuer of security . Sectors considered are credit institutions (CI), financial corporations (FC), governments (GOV), households (HH), and non-financial corporations (NFC). Securities include both bonds and equities. Note that a different scale applies to each hazard (right-hand scale of each heatmap, percentages). Group averages (in parentheses) give a sense of the relative importance of each hazard at system-wide level.
*) Gill, J.C. and Malamoud, B.D., “Reviewing and visualizing the interactions of natural hazards”, Reviews of Geophysics, Vol. 52, Issue 4, 2014, pp. 680-772.
Climate-related tipping points may translate into a financial tipping point in the form of a sudden risk repricing which would strain investors with overlapping portfolios. In the event of a sudden reassessment of risk following clustered hazard events, common holdings may cause several different investor segments to face large mark-to-market losses at once, which could be amplified by fire-sales and other portfolio rebalancing actions. This system-wide risk highlights the relevance of a macroprudential approach to prudential responses aimed at mitigating the impact of climate change on financial stability. This risk runs in parallel with the insurance protection gap relating to climate-related catastrophes.[25]
5 Conclusions and policy implications
This special feature contributes to the ECB’s monitoring of climate risks by examining the role of green finance in supporting the transition to a low-carbon economy, the currently limited financial adaptation to transition risk and the financial system amplifiers of physical risk. While further progress on consistent climate data is required, especially for forward-looking metrics, granular physical risk exposures and insurance coverage, there is encouraging evidence of greater disclosure by NFCs and an increasing awareness of climate-related risks in financial markets. Yet the risk of greenwashing remains a concern and may be rising fast – in both the green bond market and the investment fund sector – given the absence of well-designed, consistent standards for sustainable financial instruments. The dynamic exposures of financial institutions to transition and physical risks, together with their risk metrics, show no clear evidence of financial institutions experiencing a significant reduction in risk. In addition, exposure concentration, cross-hazard correlation and institutions’ overlapping portfolios are shown to act as amplifiers of such risks.
This analysis can contribute to the policy debate around disclosures, standards for sustainable financial instruments and climate-related prudential policies. The development of consistent sustainability disclosures via the Corporate Sustainability Reporting Directive and the IFRS Foundation, as well as the convergence of these requirements in common minimum international standards, are important factors allowing firms, investors and financial institutions to effectively measure and manage transition risk. Regulatory standards on sustainable financial instruments, such as the EU GBS and ESG/environmental fund labels, are key to reducing the risk of greenwashing and thus helping to scale up sustainable financing. Finally, based on the systemic aspect and possible amplification mechanisms originating from climate-related physical and transition risks, there should be further reflection on how to close any material gaps in the prudential framework.[26] Future work will focus on the extent to which existing macroprudential tools, including the systemic risk buffer, could be readily deployed to capture climate risks. New tools, such as concentration risk measures, may also be needed to address climate-related risks from a systemic perspective.[27]
This special feature has benefited from input received from Olimpia Carradori, Alberto Grassi, Giulio Mazzolini and Allegra Pietsch.
This special feature builds on the analysis presented in previous editions of the Financial Stability Review published since 2019 (see the special feature entitled “Climate change and financial stability”, Financial Stability Review, ECB, May 2019, and the special feature entitled “Climate-related risk to financial stability”, Financial Stability Review, ECB, May 2021). It complements recent ECB initiatives, including the decision to disclose climate-related information relating to Eurosystem central banks’ investments in non-monetary policy portfolios by the first quarter of 2023 (see the press release of 4 February 2021), the consideration of climate-related factors in the monetary policy strategy review (see the press release of 8 July 2021), the need for a macroprudential response (see Macroprudential Bulletin, Issue 15, ECB, October 2021) and the supervisory assessment of the progress made by European banks in considering climate and environmental risks (see “The state of climate and environmental risk management in the banking sector”, ECB, November 2021, and “Supervisory assessment of institutions’ climate-related and environmental risks disclosures”, ECB, March 2022).
See the Glasgow Financial Alliance for Net Zero (GFANZ), which encompasses the UN-convened Net-Zero Banking Alliance, Net-Zero Asset Owner Alliance, and Net-Zero Insurance Alliance, and the Net Zero Asset Managers initiative. The GFANZ aims at mobilising the necessary capital to build a global net-zero economy and deliver on the goals of the Paris Agreement. In addition, see the “Supervisory assessment of institutions’ climate-related and environmental risks disclosures”, ECB, March 2022.
See “Towards a green capital markets union: developing sustainable, integrated and resilient European capital markets”, Macroprudential Bulletin, Issue 15, ECB, October 2021.
See De Haas, R. and Popov, A., “Finance and carbon emissions,” Working Paper Series, No 2318, ECB, September 2019; Fatica, S. and Panzica, R., “Green bonds as a tool against climate change?”, Business Strategy and the Environment, March 2021; and Flammer, C., “Corporate green bonds”, Journal of Financial Economics, Vol. 142, Issue 2, November 2021, pp. 499-516.
The ECB analysis covers the sample of 4,000 European carbon-intensive NFCs that are included in the European Union Transaction Log database and are subject to the EU Emissions Trading System. The database includes information on verified GHG emissions. Firms’ revenues, profitability, and the age and number of plants with carbon-intensive activities, alongside country-specific factors such as fossil fuel subsidies, are also found to influence their ability to reduce emissions by investing in new green technologies.
See the Supervisory assessment of institutions’ climate-related and environmental risks disclosures, ECB, March 2022.
The climate change-related disclosure standards under the proposed European Union’s Corporate Sustainability Reporting Directive is expected to be used by companies for the first time in 2024, for the 2023 financial year.
See Carbone, S., Giuzio, M., Kapadia, S., Krämer, J., Nyholm, K. and Vozian, K., “The low-carbon transition, climate commitments and firm credit risk”, Working Paper Series, No 2631, ECB, December 2021.
See the box entitled “Home bias in green bond markets”, Financial Integration and Structure in the Euro Area Report, ECB, April 2022.
From Pietsch, A. and Salakhova, D., “Pricing of green bonds – drivers and dynamics of the greenium”, Working Paper Series, ECB, forthcoming.
The emission intensity of a portfolio is measured as the exposure-weighted emission intensity of respective firms, with firm’s emission intensity being absolute emissions scaled by revenues.
High-emitting firms are defined here as firms with reported emission intensity in the top 33% of the distribution as of end-2020, i.e. firms with 2020 emission intensity in excess of 556 tCO2e/USD million.
The credit-risk-weighted metric of transition risk for a bank is defined as:
where is (one of) the borrower(s),is the level of (relative or absolute) GHG emissions produced by the borrower and is the probability of default assigned to the borrower by the bank concerned. An alternative for the credit risk component would be to use loan loss provisions as a proportion of loans instead of PD. In the present case, PDs are used because they capture credit risk from a more forward-looking perspective. An alternative for the climate risk component would be to use emission targets alongside or instead of current emission levels. This choice would also improve the forward-looking power of the metric.Transition risk can materialise in the form of higher operating expenditures and investment requirements for firms, the purpose being to reduce their emissions. These higher monetary costs can manifest themselves in transitional risk metrics (e.g. credit risk parameters such as PDs), although it is assumed that banks do not currently explicitly account for the contribution of transition risk to firms’ credit risk.
The bank-level emissions-to-loans ratio is computed by aggregating borrowers’ emissions and dividing this figure by the total value of the bank’s corporate loan portfolio.
This exercise measures a bank's sensitivity to carbon price increases under the NGFS Phase I disorderly transition scenario over a 30-year period, leveraging on model parameters developed in the ECB economy-wide climate stress test (see “ECB economy-wide climate stress test”, Occasional Paper Series, No 281, ECB, September 2021). The increase in banks’ expected losses stemming from carbon price increases is calculated for each of its credit exposure as
where and are coefficients determining the extent to which borrower PDs react to changes in profitability and leverage.Firms’ default correlations are estimated using a multi-firm Merton model calibrated on historical data for a large sample of euro area firms. Via 500,000 Monte Carlo iterations, the model simulates the default events of thousands of firms for which the asset value process is modelled as correlated geometric Brownian motions. The transition risk intensity , capturing the fraction of transition cost borne by firms for each tonne of CO2 emitted, incorporates both the transition risk shock (€/tCO2) and a pass-through factor capturing the degree to which firms can pass the cost of a transition risk shock on to consumers, and impacts the value of assets (see Belloni, M., Kuik, F. and Mingarelli, L., “Euro area banks’ sensitivity to changes in carbon price”, Working Paper Series, No 2654, ECB, March 2022). Under the simplifying assumption that firms would bear the full cost of an increase in carbon prices (), the transition risk intensity would be equivalent to this increase in the cost of carbon, i.e. .
Firms with emission intensities above (below) the sample’s 75th percentile are referred to as high (low) emitters.
Another example is typhoons and rainfall, which can trigger ground subsidence. This has the potential to start landslides which can, in turn, cause flooding.
Cont, R. and Schaanning, E., “Monitoring indirect contagion”, Journal of Banking and Finance, Vol. 104, Issue C, July 2019, pp. 85-102.
Firm-level risk scores for over four million firms worldwide, from Moody’s Four Twenty Seven, are used.
The degree to which the share of portfolios exposed to natural hazards will concretely be at risk is unclear as firms can implement physical risk-mitigation measures to reduce impacts.
See “Climate change, catastrophes and the macroeconomic benefits of insurance”, Financial Stability Report, EIOPA, July 2021, pp 105-123.
See Baranović et al., “The challenge of capturing climate risks in the banking regulatory framework: is there a need for a macroprudential response?”, Macroprudential Bulletin, ECB, October 2021.
See “ECB response to the European Commission’s call for advice on the review of the EU macroprudential framework”, March 2022.