
Climate-related risks to financial stability
Climate-related risks to financial stability
Published as part of the Financial Stability Review, May 2021.
The ECB has been intensifying its quantitative work aimed at capturing climate-related risks to financial stability. This includes estimating financial system exposures to climate-related risks, upgrading banking sector scenario analysis and monitoring developments in the financing of the green transition. Considerable progress has been made on capturing banking sector exposures to firms that are subject to physical risks from climate change. While data and methodological challenges are still a focus of ongoing debates, our analyses suggest (i) somewhat concentrated bank exposures to physical and transition risk drivers, (ii) a prevalence of exposures amongst more vulnerable banks and in specific regions, (iii) risk-mitigating potential for interactions across financial institutions, and (iv) strong inter-temporal dependency conditioning the interaction of transition and physical risks. At the same time, investor interest in “green finance” continues to grow – but so-called greenwashing concerns need to be addressed to foster efficient market mechanisms. Both the assessment of risks and the allocation of finance to support the orderly transition to a more sustainable economy can benefit from enhanced disclosures, including of firms’ forward-looking emission targets, better data and strengthened risk assessment methodologies, among other things.
1 Introduction
This special feature presents recent progress in the ECB’s quantitative work to map and monitor financial system exposures to climate change transition and physical risks and to measure bank vulnerabilities to climate-related risks (see Box A). This is complemented by analyses of the role played by the financial system in the transition to a greener economy.[1] While several challenges related to data and methodological developments still need to be addressed, a greater understanding of the potential risks posed by climate change is urgently needed. These analyses are intended to assist the orderly transition to a greener economy, while avoiding larger shocks or abrupt changes in the financial system stemming from climate-related risks.
2 Exposure of financial institutions to transition risk
Carbon prices have already seen steep increases and new policy commitments suggest they need to rise further if global climate targets are to be met. Since the last FSR was published in November 2020, the price of carbon under the EU Emissions Trading System (ETS) has climbed by about 60%, based on expectations that relevant EU policies – including the EU ETS itself – will be reviewed.[2] On 19 February 2021 the European Commission announced that it was raising its target for reducing net greenhouse gas (GHG) emissions by 2030 from 40% to at least 55% compared with 1990 levels.[3]
The financial system is exposed to transition risk arising, for example, from exposures to firms with high carbon emissions throughout their value chains. Here, emissions of non-financial corporations (NFCs) are categorised as direct (“scope 1”), energy-related (“scope 2”) and indirect (“scope 3”) emissions which are associated with all other steps in the value chain, such as the use of goods sold.[4] The universe of NFCs reporting GHG emissions is limited to mainly large listed corporates, with scope 3 emissions having the lowest coverage of all disclosures. In order to fill the data gaps for other firms, this analysis relies on modelled GHG emissions calibrated on data self-reported by firms. Building on estimates for emissions along the full value chain, the entire resulting dataset spans €4 trillion of euro area banks’ loan exposures.
Banks’ loan portfolios are exposed to varying degrees to the four sectors with the highest emissions, although manufacturing sector exposures are significant and at the same time associated with high scope 3 emissions.[5] Firms in the mining and energy sectors account for about 5% of banks’ loan exposures. While they are among the most carbon-intensive counterparties in banks’ loan portfolios, the low share of loans suggests that the risk for banks is modest (see Chart B.1, left panel). However, manufacturing represents a much larger share (around 20%) of banks’ loan portfolios. The manufacturing sector’s emissions are mostly defined as scope 3, giving grounds to assume that changes in consumer preferences would entail significant transition risks. Our analysis therefore suggests that exposures to manufacturing firms represent a major source of climate-related credit risk in banks’ corporate loan portfolios, although this is only revealed after capturing the carbon footprint of the entire value chain due to scope 3 emissions. Transition risk exposure due to securities holdings follows a similar pattern, as around 30% of banks’ equity and corporate bond portfolios consist of high-emitting NFCs.
Chart B.1
High indirect emissions in the manufacturing sector may point towards concentrated transition risks, and non-banks are highly exposed to high emitters

Sources: AnaCredit, Urgentem, ECB (securities holdings statistics by sector) and ECB calculations.
Notes: Left panel: the sample consists of €4 trillion of exposures above €25,000 to NFCs matched with emission data, corresponding to 80% of euro area loans to NFCs. The left bar indicates the share of exposures to firms in the respective sector, compared with all exposures to all firms in the sample. All other bars compare emissions of firms in the respective sector to emissions of all firms in the sample. Direct emissions are scope 1, energy-related emissions are scope 2 (purchased energy) and indirect emissions are scope 3. Where reported data are not available, emissions were modelled (see main text). Right panel: the panel captures the exposure of non-banks to firms that issue bonds or are listed in the equity market. These firms are classified as low, medium and high emitters according to their emission intensities (scope 1, 2 or 3) in December 2019, i.e. the ratio of CO2 emissions to revenues. Low emitters are firms with less than 309 CO2-equivalent tonnes per million USD revenue (33rd percentile), while high emitters are firms with more than 1,068 CO2-equivalent tonnes per million USD revenue (66th percentile). NACE: Nomenclature statistique des activités économiques dans la Communauté Européenne (Statistical classification of economic activities in the European Community); NFCs: non-financial corporations; ICPFs: insurance corporations and pension funds; ICT: information and communication technology.
Non-bank financial institutions hold 30% of their portfolios in securities of high-emitting NFCs (see Chart B.1, right panel). Investment funds, and insurance corporations and pension funds (ICPFs) invest around €1.3 trillion and €0.3 trillion respectively in securities issued by high emitters operating mainly in the industrial, energy and materials sectors.[6] While the relative share of high-emitting firms in non-banks’ portfolios has remained broadly stable at around 30% over the last seven years, the absolute amount has doubled, from €0.8 trillion in 2013 to €1.6 trillion in 2019, broadly in line with the growth of non-bank assets. At the same time, an increasing number of institutional investors are adopting sustainable investment strategies with a view to financing the green transition. These approaches do not necessarily imply investing in current low emitters. Instead, they range from passive exclusion or screening strategies to exclude carbon-intensive firms, through to more sophisticated and active models. These include integration of environmental, social and governance (ESG) factors and impact investing, which aims to engage with firms to green their activities by improving their ESG score compared with the rest of the sector, for instance.[7]
3 Climate-related physical risks for the financial sector
In 2019 total economic losses from extreme events amounted to 1% of GDP in the euro area; without action, these costs are expected to rise over time. Extreme climate and weather events such as floods, wildfires and hurricanes can affect GDP through the destruction of property and physical capital used to produce goods, and their impact on investments and financial institutions.[8] Other hazards such as water stress and heat stress can reduce labour and agricultural productivity, impair logistics and lead to the relocation of economic activity.[9] Overall, physical hazards can have a lasting effect on GDP, as they can cause the long-term loss of production and divert capital earmarked for investment towards reconstruction and replacement. With climate change, these hazards are expected to increase in frequency and intensity, giving rise to ever greater physical risks.
Some firms are already highly or increasingly exposed to physical risks, usually concentrated in distinct geographical areas (see Chart B.2, left panel).[10] In this analysis, firms’ exposure is proxied by the location of their head office and the location of large firms’ subsidiaries.[11] Floods are most relevant in central and northern areas of Europe, with more than 7% of individual firms facing high or increasing levels of flood risk. Heat-related hazards dominate in southern Europe, with 18% of firms highly or increasingly exposed to heat stress, water stress or wildfires. Without ambitious reductions in emissions, firms that currently have only some risk exposure may in the long run also be subject to higher physical risks.
Around 30% of euro area banking system credit exposures to NFCs are to firms subject to high or increasing risk due to at least one physical risk driver (see Chart B.2, right panel). Looking at individual hazards, around 10% of loan exposures involve firms at high or increasing risk of floods, heat stress or water stress. Taken together, around 80% of loan exposures are to firms with at least some exposure to physical risks. This may become increasingly relevant if emissions are not effectively reduced in the long run and if firms and economies fail to adapt to climate change. In addition, almost 10% of loan exposures to NFCs are subject to multiple high or increasing physical risk drivers (see Chart B.3, left panel). An increase in connected or compound events may amplify the impact of the respective risks and cause clustering, with limited possibilities for diversification.
Chart B.2
Climate change hazards could affect up to a third of euro area banks’ credit exposures

Sources: Four Twenty Seven, AnaCredit and ECB calculations.
Notes: Based on a sample of 1.5 million firms in Europe, 1.1 million of which are located in the euro area; information refers to head office location and subsidiaries of the largest listed firms. The left panel shows the maximum risk level across the following hazards: floods, heat stress, hurricanes, sea level rise, water stress and wildfires. The risk levels defined by Four Twenty Seven are “high present/projected exposure”, “increasing exposure”, “some present/projected exposure” and “no significant exposure” (legend in right panel). For example, if one firm has “no significant exposure” to floods and “increasing exposure” to heat stress, it is marked with “increasing exposure” on the map. The indicators and risk levels are based on data integrating information on the current and projected (until 2040) extent of the different physical hazards; they are taken directly from Four Twenty Seven. Any potential economic impact is not taken into account. Right panel: bank loan exposure is taken from AnaCredit and matched with Four Twenty Seven data at corporate level. Credit exposures to NFCs above €25,000 are considered; total exposures amount to €4.2 trillion. 31% of exposures can be matched directly, 58% are matched using postcode-level aggregates of the Four Twenty Seven corporate level indicators and 11% cannot be matched this way due to missing geolocational information in AnaCredit (“no information” in right panel).
Two-thirds of exposures to firms highly or increasingly subject to physical risks are secured by collateral, which plays an important role in mitigating losses for banks but may itself be subject to damage or loss of value. The use of collateral ensures that bank losses from credit exposures are mitigated. However, climate-related damage causing firms to default also likely has an impact on the physical collateral used to secure the exposures. If the collateral is not fully covered by insurance, this link reduces its loss-mitigating ability and increases potential losses for banks.
Physical assets represent around 50% of the collateral value used to secure exposures to firms subject to high or increasing physical risks, but that share differs across sectors (see Chart B.3, right panel). The different degree of collateralisation for high-risk exposures reflects sector-specific characteristics. Banks are most exposed to firms in the manufacturing and real estate sectors, with more than two-thirds of exposures to sectors like real estate activities, construction, and accommodation and food being covered by collateral (mainly physical assets). The extensive use of physical collateral in these sectors raises concerns about the potential loss of value should these business activities be disrupted by physical hazards or take place in regions where risks are expected to intensify.
Chart B.3
A significant share of loan exposures in some sectors is secured by physical collateral which may also be impacted by climate-related damage
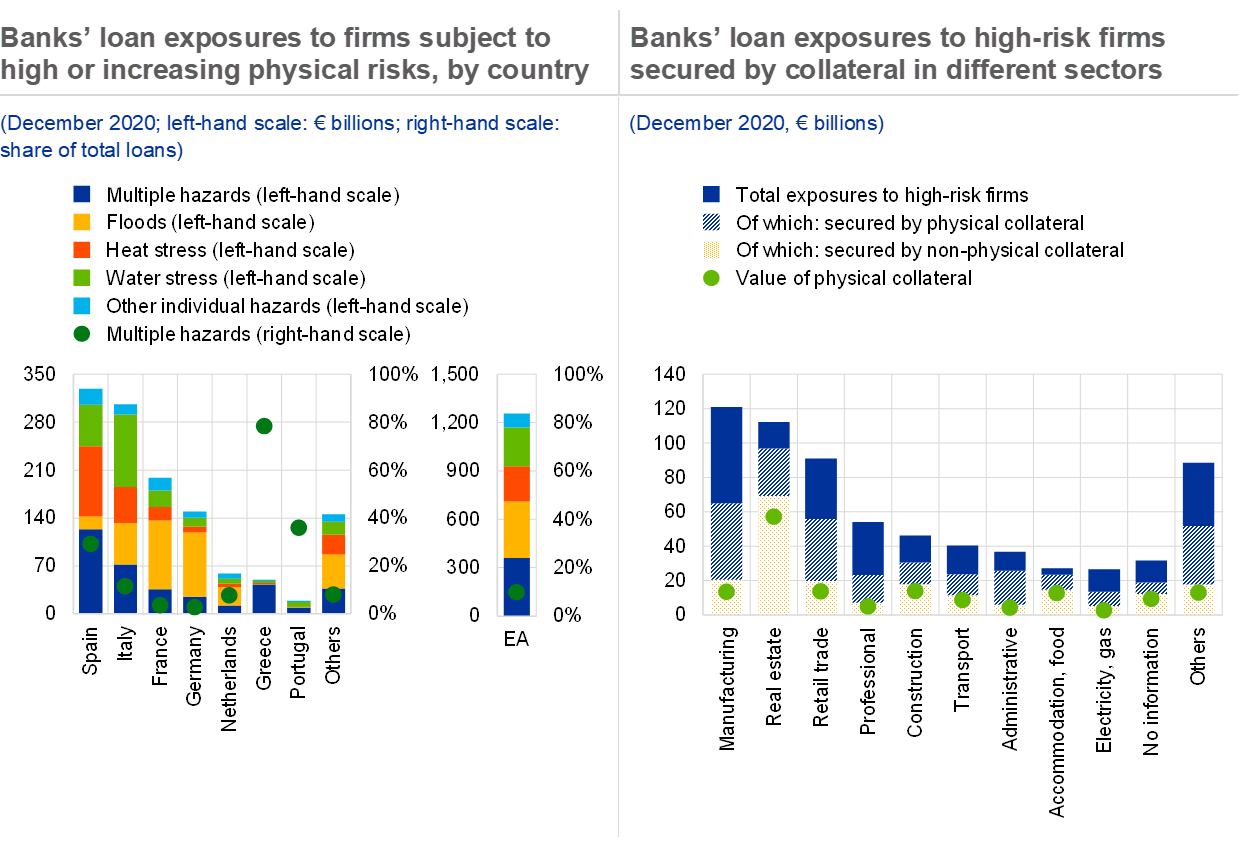
Sources: Four Twenty Seven, AnaCredit and ECB calculations.
Notes: Credit exposures to NFCs above €25,000 are considered; total exposures amount to €4.2 trillion; NFC location used to assign risk levels refers to the head office and the location of subsidiaries of the largest listed firms; country breakdown refers to the bank’s country of residence. Left panel: “Multiple hazards” refers to bank exposure to firms which are highly or increasingly exposed to more than one hazard (i.e. red and orange bars in Chart B.2, right panel) of those hazards listed in Chart B.2. For example, if a firm is highly exposed to both heat and water stress, banks’ exposure to that firm is counted under “multiple hazards”. Right panel: the maximum risk level across floods, sea level rise and wildfires is considered; the total collateral value at instrument level is capped at the value of the instrument; insurance cover not included.
Physical risk exposures may potentially give rise to broader financial stability risks if they are concentrated or paired with less capitalised and less profitable banks (see Chart B.4, left panel). Without taking collateral or other mitigating factors into account, the exposure to firms subject to high or increasing physical risk is six times larger among the 25% least well capitalised banks (by Common Equity Tier 1 ratio) relative to the 25% most well capitalised banks. Similarly, the median exposure at risk held by the quartile of banks with the lowest return on equity is twice as big as that for the 25% most profitable banks.
More than 70% of the banking system credit exposures to the identified high-risk firms are held by 25 banks (see Chart B.4, right panel).[12] Ten of these banks individually hold more than 3% of the total exposures to high-risk firms. These banks are generally large and well diversified across asset classes and regions and have additional capital buffers given their status as global or other systemically important banks. While exposures to the high-risk firms are generally around 5% of total assets among these banks, seven of the 25 banks have exposures of 10-15% of total assets.
Chart B.4
Physical risks concentrated in a few banks and interaction with other vulnerabilities

Sources: Four Twenty Seven, ECB supervisory data, AnaCredit and ECB calculations.
Notes: Credit exposures to NFCs above €25,000 are considered; total exposures amount to €4.2 trillion; NFC location used to assign risk levels refers to the head office; sample of 357 banks (significant institutions and major less significant institutions in the euro area). Whiskers in the left panel extend to €8.83 billion and €9.7 billion for CET1 quartiles 1 and 2 respectively and €10.06 billion for ROE quartile 1. CET1: Common Equity Tier 1; NFCs: non-financial corporations; ROE: return on equity.
A potential concentration of climate-related physical risks among a few, more vulnerable banks could have implications for financial stability. While physical risks are not new for the assessment of credit and market risks, more frequent, more severe and more strongly correlated physical hazards may place additional strains on the banking system, especially for banks with lending in limited geographical areas. Furthermore, medium and long-term forward-looking scenario-based analysis can be used to assess the interaction of these risks with transition risks across sectors (see Box A). To limit losses to the financial system, it will be essential to support an orderly transition to a sustainable economy, limit the impact from physical hazards by means of climate change adaptation measures and diversify risks among financial institutions using loss-absorbing capacity, financial instruments or insurance coverage. In addition, further investment in granular, forward-looking data collections and risk quantification methodologies is needed to underpin comprehensive, forward-looking analyses.
4 Role of insurers in mitigating physical risk[13]
Only a third of climate-related economic losses in the euro area are insured, and climate change is expected to cause this protection gap to widen. Eurostat and NatCatSERVICE data indicate that this share is as low as 12% in southern European countries. Insurance claims are set to increase as natural disasters become more frequent and more severe, which may result in higher insurance premiums and/or lower insurance coverage, thereby widening the protection gap.[14]
Insurers play an important role in mitigating the macroeconomic effects of catastrophes which may be precipitated by climate change. Estimates suggest that uninsured losses have a negative aggregate impact on a country’s GDP, while this is not the case if the event is insured (see Chart B.5). Specifically, the payouts from insurers reduce uncertainty and support aggregate demand and investment for reconstruction, which helps to accelerate the recovery from a natural disaster. Still, the reduction in value added following such events has a negative impact on corporate productivity.
Chart B.5
Insurance helps to maintain GDP growth after a natural disaster, while uninsured losses are estimated to have an adverse effect on GDP growth
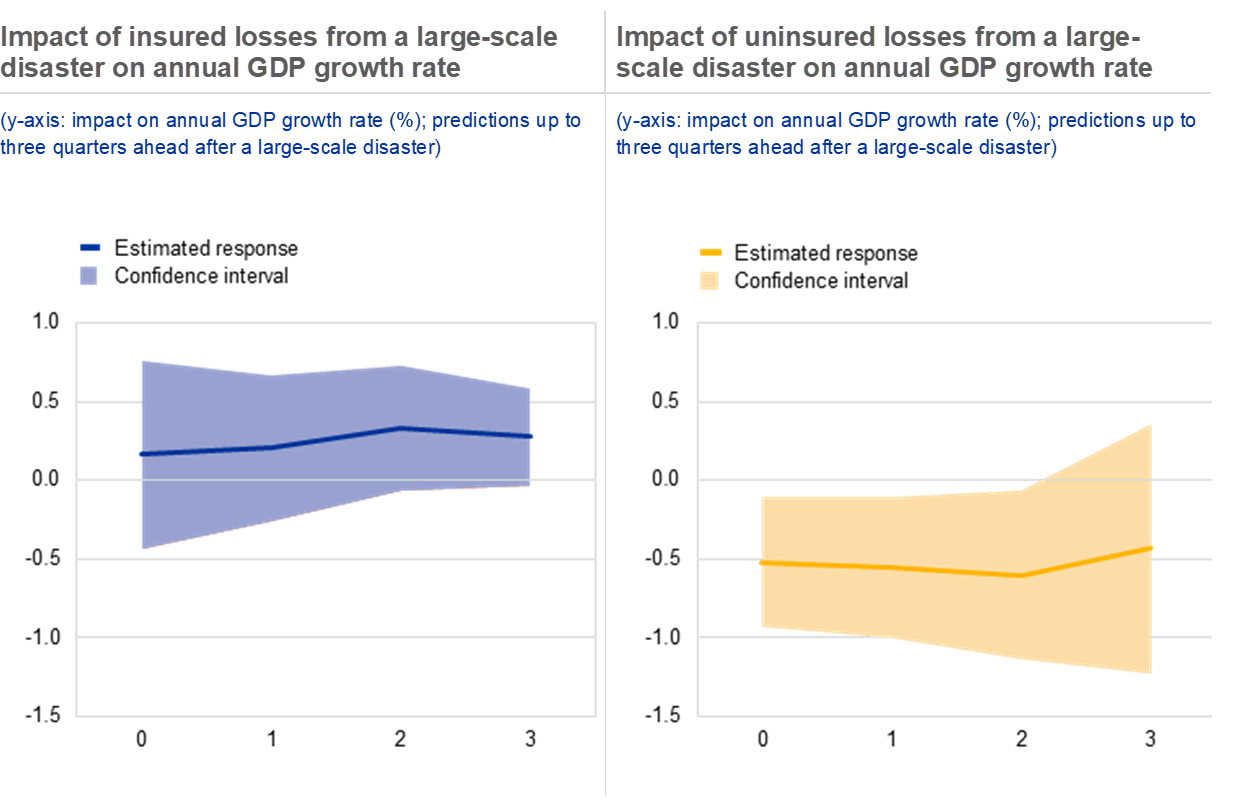
Sources: EM-DAT, OECD and ECB calculations.
Notes: The sample includes 45 countries for which the OECD provides quarterly GDP data from 1996 to 2019. The charts show the impact of large-scale natural disasters (i.e. with total damage larger than the third quartile at 0.1% of GDP) when the share of insured losses is high (above the median of 35%) in the left panel, and low (i.e. below the median of 35%) in the right panel. The estimates are obtained using a panel regression model where the dependent variable is the year-on-year difference in the log of GDP and the explanatory variables include two dummies capturing large-scale disasters with a high and low share of insured losses respectively (included with up to three lags), and country and quarterly fixed effects. For the quarter including the date(s) of the disaster (t=0) and the three subsequent quarters, the y-axis measures the percentage point impact of the disaster on the year-on-year annual growth rate at the end of that quarter.
These results suggest strong risk-pooling benefits – across entities and over time – from enhanced insurance protection. The European Commission recently published a new EU strategy on adaptation to climate change, which includes the objective of closing the insurance protection gap.[15] More concrete actions should be considered to mitigate physical risk by means of insurance coverage and adaptation measures by, for example, linking specific forms of credit to insurance requirements, increasing public-private partnerships or diversifying risks through a common European disaster fund.
Box A
Advances in bank vulnerability assessments
The ECB is currently conducting an economy-wide climate stress test.[16] Its purpose is to assess the resilience of the banking system to the transition to a low-carbon economy and to provide information to market participants on the risks from climate change. To that end, it looks at the exposure of euro area banks to future climate risks by analysing the resilience of their counterparties under various climate scenarios over the next 30 years.
The current climate stress test combines granular datasets with economic scenarios. This specifically encompasses: (a) a dataset of approximately four million companies worldwide, including climate risk data and financial information; (b) granular data on loan and securities exposures for some 2,000 euro area banks (almost all monetary financial institutions in the euro area); and (c) aggregate trajectories for transition and physical risk embedded into scenarios created by the Network for Greening the Financial System (NGFS).[17] The scenarios consider possible future paths for key aggregates such as real GDP, carbon emissions and energy prices, in cases both with and without successful climate policy action. This allows the impact of climate risks on the probability of companies defaulting to be assessed and clarifies the trade-off between the cost of transitioning towards a greener economy and a no-transition scenario.
The scenarios and firm-level data are complemented by models built on micro data sources that are specifically designed to assess the impact of climate risks on non-financial corporate solvency and profitability.[18] Policies to facilitate the transition, such as a carbon tax, can increase the prices of energy generated from fossil fuels and some goods that rely heavily on carbon emissions during the production process. This could result in some firms – especially in carbon-intensive industries – seeing their revenues decrease and their operating costs increase. Changes in corporate debt are also likely due to the possible destruction of physical capital by natural disasters, potentially coupled with technological substitution in the transition towards a less carbon-intensive production chain. Mitigants and amplifiers of climate risks have also been considered. Insurance coverage can mitigate the losses of physical capital from future natural disasters, while operating costs can be affected by changes in insurance premiums, especially for firms located in vulnerable geographical areas. The combined impact of transition and physical risk on corporate profits, operating costs and debt allows the probabilities of default (PDs) to be estimated for firms under different climate scenarios.
Preliminary results show that, in the absence of further climate policies, the impact of extreme physical events on companies’ PDs will rise substantially over the 30-year time horizon (see Chart B.A). The PD for a median firm initially rises in the orderly transition scenario compared with the adverse scenarios, reflecting the short-term costs of introducing climate policies in an orderly fashion (see Chart B.A, left panel). In a “hot house world”, by contrast, PDs rise rapidly in the second half of the time horizon, far beyond the levels of the orderly transition. This outcome highlights the long-term benefits of rolling out climate policies and conversely the long-term costs of taking no action to combat climate change. The same chart also demonstrates the limited short-term benefits followed by the high long-term costs of a disorderly transition rather than an orderly transition. The benefits of an orderly transition are even more prominent when looking at the results for those firms that are most exposed to physical risk (see Chart B.A, right panel).
Chart B.A
Without further climate policies, the impact on companies’ PDs from extreme physical risk would rise substantially, especially for those firms most exposed to physical risk

Sources: NGFS scenarios, Four Twenty Seven, Urgentem, Bureau van Dijk – Orbis database, Bloomberg Finance L.P., Refinitiv, AnaCredit and ECB calculations.
Notes: Left panel: median across all firms in the sample. Right panel: median across all firms in the sample with a physical risk score above the 75th percentile.
The results show a strong inter-temporal dependence of risks, with early action yielding clear benefits in terms of systemic risk reduction. The short-term costs of implementing climate policies are significantly lower than the potentially much higher costs arising from natural disasters in the medium to long term. Climate change may thus represent a source of systemic risk, particularly for banks with portfolios concentrated in certain economic sectors and geographical areas. The results will help inform ongoing climate work across the ECB, including the separate supervisory climate stress test of individual banks that ECB Banking Supervision will carry out in 2022.
5 The role of financial markets in financing the transition and mitigating risks
Financial markets have been seizing the opportunity to help finance the transition to a greener economy. Since 2015 assets under management of ESG funds have almost tripled, the outstanding amount of green bonds issued by euro area residents has increased eightfold, the outstanding amount of catastrophe bonds has almost doubled, and emission-related derivatives have grown more than sevenfold[19] (see Chart B.6, left panel).[20] As transition risks to the financial system increase with higher carbon prices, they need to be actively managed. This is causing volumes to rise in emission-related derivatives markets, mostly concerning futures on EU ETS allowances that are used to hedge transition risk. In parallel, financial markets are designing new products, such as blue bonds to protect marine areas and sustainability-linked bonds[21] to incentivise sustainable investments and help counter greenwashing. But the risk of greenwashing remains high due to the lack of consistent disclosures, taxonomy alignment and consistent standards for green bonds and ESG investment funds.[22]
Chart B.6
Investors in ESG and green funds appear less sensitive to past negative performance
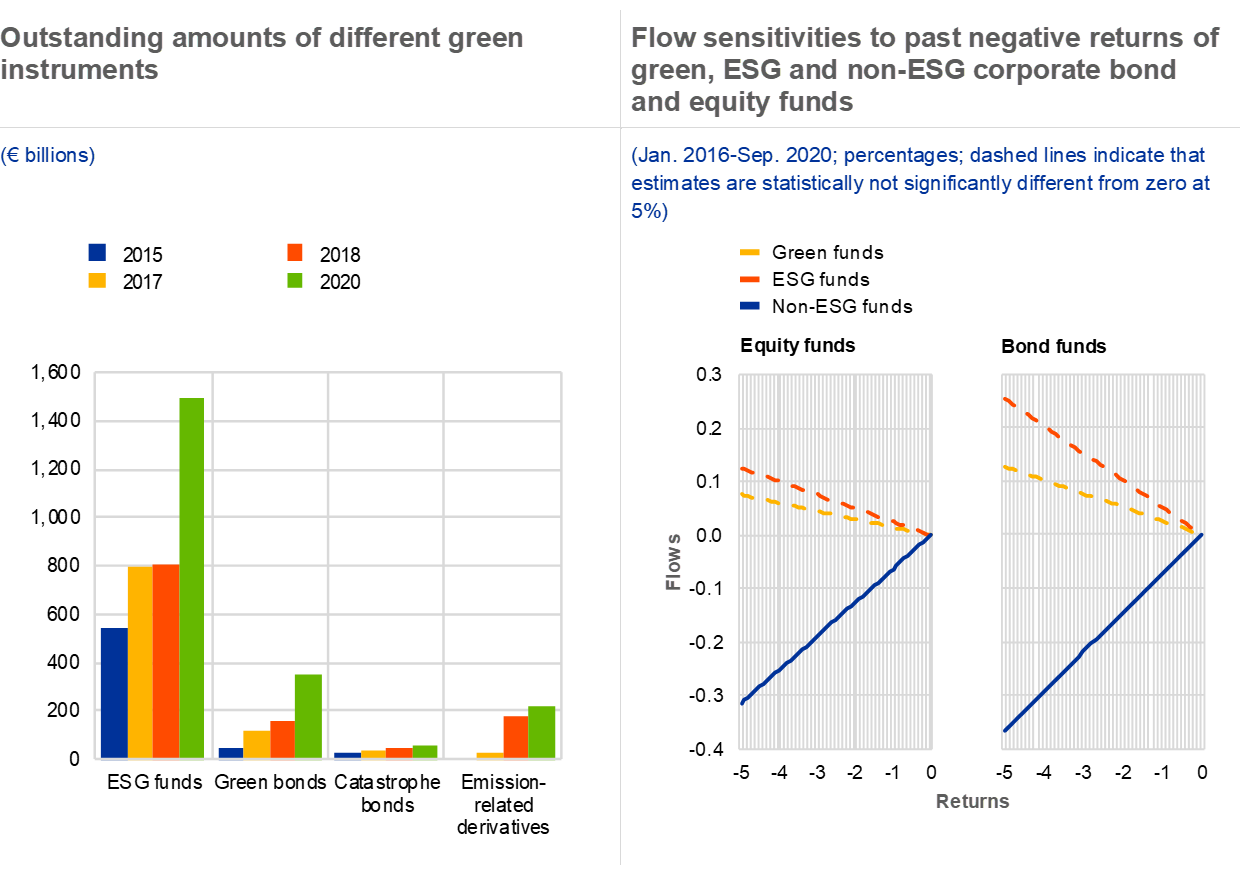
Sources: Artemis, Bloomberg Finance L.P., EMIR data, EPFR Global, Lipper and ECB calculations.
Notes: Left panel: data on catastrophe bonds are copyright to www.artemis.bm, Steve Evans Ltd. To avoid end-of-year effects, the outstanding amount of emission-related derivatives is the notional value of open positions reported under EMIR as at the end of November. 2015 values are not included due to data unavailability. See footnote 19 for data limitations. The right panel shows the relationship between net flows as a share of a fund’s lagged total net assets and lagged fund returns. It is based on a sample of 1,452 and 8,337 non-ESG fund shares, and 131 and 1,017 ESG shares, of corporate bond and equity funds domiciled in the euro area between January 2016 and September 2020. Green funds are identified using text search for key words such as 'green' and 'environmental' in funds’ prospectuses. Controls include fund age, fund size, lagged flows and standard deviation of returns. Share and interaction-time-ESG fixed effects are included and standard errors are clustered at share level. Dashed lines indicate that estimates are statistically not significantly different from zero at the 5% level. EMIR: European Market Infrastructure Regulation; ESG: environmental, social and governance.
Investors in ESG bond and equity funds appear less sensitive to past negative performance, meaning that they appear to provide relatively stable financing to support the transition (see Chart B.6, right panel). Returns of ESG and non-ESG funds are statistically similar. However, the sensitivity of flows to negative performance in ESG funds, including those with a green focus, has not been statistically significantly different from zero over the last four years. This is in contrast with non-ESG funds, which exhibit a clear flow-performance relationship following negative returns, consistent with the wider literature.[23] This observation may signal that investors have started pricing in transition risks and may expect better risk-adjusted performance from ESG funds, or that ESG investors are more committed and have a longer-term investment horizon.
Chart B.7
Green bonds are similar to conventional bonds in terms of interest rates and liquidity, and credit ratings partly reflect firms’ transition risk

Sources: Bloomberg Finance L.P., Dealogic, IHS Markit, Refinitiv, Urgentem and ECB calculations.
Notes: Left panel: the chart shows how green bonds differ from matched conventional bonds in terms of asset swap spread and liquidity (bid-ask spread). It is based on 145 pairs between January 2019 and October 2020. Dependent variables, asset swap spread and bid-ask spread are regressed on a green-bond dummy variable. Controls include macro variables (VIX, three-month EURIBOR, ten-year German Bund), bond-specific characteristics (maturity, coupon rate, size, issuer credit rating, ECB eligibility and bid-ask spread for regression of spread). Pair and month fixed effects are included, and standard errors are clustered at a bond level. The coefficients are not significantly different from zero at the 5% level. Right panel: the coefficients are based on a firm-level panel regression of environmental metrics, financial controls and sectoral/time fixed effects on credit ratings. The sample consists of yearly data on 859 listed non-financial corporations from Europe and the United States, with observations covering the period from 2016 to 2019. The first column presents the impact of an average yearly decrease in scope 1 and 2 carbon intensities, while the other two columns show the impact of dummy variables for the existence of environmental disclosure and forward-looking targets related to emissions reduction respectively.
Complementary evidence about whether investors in green bonds treat them differently to conventional bonds is mixed, potentially due to a lack of clear standards and commitment from issuers (see Chart B.7, left panel). Over 2019 and 2020 green bonds were issued at lower yields and with larger order books than conventional bonds. However, their subsequent performance in terms of interest rates and liquidity is statistically similar when controlling for macroeconomic factors and bond-specific characteristics.[24] Tentative evidence suggests, by contrast, that green bonds satisfying all the green bond principles promoted by the International Capital Market Association and with second-party certification exhibit a statistically significant “greenium”[25], unlike green bonds satisfying only the “use-of-proceeds” principle. This suggests that further strengthening green bond standards and issuer accountability can foster market development in order to fund the transition. Measures aimed at averting greenwashing may also be important, given mixed evidence on whether green bond issuance signals lower or decreasing carbon intensity on the part of the issuers.[26]
Firms’ transition risk seems to be reflected in credit ratings to some degree, but its impact is mitigated by the presence of forward-looking emission-reduction targets. Corporate disclosure is predominantly based on current emissions, but transition risk can affect a firm’s capacity to service and repay its debt in the future.[27] For this reason, an increasing number of companies are disclosing their strategy to reduce emissions in line with the Paris Agreement targets. Our analysis suggests that disclosure and more ambitious forward-looking targets are associated with better credit ratings (see Chart B.7, right panel), which may be indicative of greater risks in companies not taking a proactive approach to assessing and reducing their carbon footprint.[28]
6 Conclusions and policy considerations
While data and methodological challenges still persist, the available evidence suggests that euro area banks, funds and insurers face material climate-related financial risks. Banks and non-bank financial institutions alike have a sizeable share of exposures to emission-intensive corporates that could face an increased risk of losses during the transition to a low-carbon economy. Including more evidence on scope 3 emissions allows these risks to be captured more comprehensively. An even more concerning risk for banks and non-bank financial institutions may arise from exposure to physical risks if climate change is not contained and if economies fail to adapt to climate change. For both transition and physical risks, our results suggest that the risks may be particularly concentrated in certain sectors, geographical regions and individual banks. In addition to mapping financial system risk exposures and transforming them into impacts, climate stress tests enhance our understanding of financial system vulnerability to higher corporate default risk. To do so, they make use of alternative forward-looking scenarios for climate change and emission reduction, thereby shedding light on the relative costs and benefits of transitioning towards a greener economy. Overall, our understanding of climate-related risks is still a work in progress, as data and methodological gaps continue to need addressing.
The analysis also reveals that the measurement of climate-related financial risks needs to account for the interplay between banks and insurers. A key determinant of how banks are affected by materialising risks is the extent to which exposures or collateral are covered by insurance. Evidence from past disasters shows how economic recovery benefits from a higher level of insurance coverage. Insurers play a central role in managing and distributing the risks that could arise from climate change. However, as climate-related risks intensify, there is a growing risk of an increasing insurance protection gap due to increasing insurance premiums or because of some risks becoming uninsurable. A cross-sectoral assessment is therefore required in order to obtain a complete picture of the climate-related risks faced by the financial system.
While investor interest in “green finance” continues to grow, supportive market pricing and further growth may be inhibited if greenwashing concerns are left unaddressed. Amid the wider market turmoil in the wake of the coronavirus (COVID-19) pandemic, green funds and instruments have proved notably resilient, and ESG funds have continued to grow, demonstrating the value investors place on this sector. Effective green finance can help to foster an orderly transition towards a net zero emissions economy and reduce vulnerability to climate-related risks. At the same time, possible market failures can stem from data gaps, which would raise the risk of greenwashing.
Further progress on closing data gaps and improving reporting is required to enhance the capacity to measure, monitor and mitigate climate-related financial risks and reduce the risk of greenwashing. The lack of adequate and consistent data hampers the development of active strategies for monitoring and managing climate-related risks and undermines the effective pricing of risk. Disclosed metrics should include direct and indirect emissions together with forward-looking measures, such as emission-reduction targets and green investments. It is also essential to enhance granular geolocational information on physical risk drivers and the exposure of firms and their facilities to these risk drivers, together with implemented and future adaptation measures and insurance coverage. These data gaps should be closed as a matter of priority, by setting mandatory, harmonised and auditable disclosure standards.
European and global initiatives to develop consistent sustainability disclosures should help to foster better informed pricing of climate-related risks. Given the importance of a globally coordinated approach, the efforts of the Financial Stability Board (FSB) and the G20, as well as the initiative of the IFRS Foundation, are essential to develop common standards. Mandatory global reporting standards which still leave room for regional jurisdictions to go further, if they wish, can help promote global upward convergence beyond the minimum standards. The EU’s recent initiatives serve as an important global reference point.[29]
Building on improved disclosures and standards, consistent regulatory and supervisory approaches will help to address climate-related and environmental financial risks.[30] Maintaining global consistency will be important to avoid regulatory arbitrage, with ongoing work in this area being conducted by the FSB, the Basel Committee on Banking Supervision, the European Banking Authority (EBA) and others. Currently, the work at both the international and the EU level focuses on whether the current prudential frameworks adequately cover climate-related financial risks or whether there are any gaps. Subsequently, the need for potential regulatory and/or supervisory measures will be considered to ensure financial institutions are effectively addressing climate-related financial risks.
A macroprudential perspective is needed to mitigate climate-related risks in the financial system. In particular, the systemic nature of climate-related risks implies that narrowly mitigating the exposure of one part of the financial system could prompt the transfer of risk to other sectors. This suggests that a system-wide perspective is needed. Hence, while the microprudential framework can continue to focus on the soundness of individual financial institutions, macroprudential authorities will need to consider the risks to the financial system as a whole and ensure cross-sector consistency. Ultimately, macroprudential and supervisory approaches will need to be complementary and account for the long horizon of climate-related risks and their complex interactions with the real economy and the financial system.
- This special feature builds on the special feature entitled “Climate change and financial stability”, Financial Stability Review, ECB, May 2019. It complements recent ECB initiatives, including climate-related disclosures of the ECB’s investments in non-monetary policy portfolios (see press release of 4 February 2021), the consideration of climate-related factors in macroeconomic models and in the monetary policy strategy review and supervisory guidance for banks (see “Guide on climate-related and environmental risks – Supervisory expectations relating to risk management and disclosure”, ECB Banking Supervision, May 2020).
- See “EU Emissions Trading System (EU ETS)”.
- See speech by President von der Leyen at the Special Edition 2021 of the Munich Security Conference.
- Considering emissions by different “scope” makes it easier to understand different demand and supply channels through which transition risk can translate into financial risk. Scope 1 and 2 emissions can help capture the adverse effects of carbon taxes and policies that penalise the use of fossil fuels. Scope 3 emissions focus on the impact of changes in transporting supplies or finished products, but also in consumer demand for goods. For example, an abrupt reduction in demand for carbon-intensive products can be harmful for firms producing less sustainable goods, causing their assets to become stranded.
- The industry sector classification used throughout this special feature is the NACE rev. 2.
- Transition risk varies across funds, and the median exposure to polluting assets is 57% of total holdings (see “Report on Trends, Risks and Vulnerabilities”, European Securities and Markets Authority, No 1, 2021). In contrast to “Sensitivity analysis of climate-change related transition risks: EIOPA’s first assessment”, European Insurance and Occupational Pensions Authority (EIOPA), December 2020, our estimates include exposures to NFCs, irrespective of their sector’s relevance for climate policy, and do not reflect indirect exposures through investment funds’ holdings.
- According to Krueger, P., Sautner, Z. and Starks, L., “The Importance of Climate Risks for Institutional Investors”, The Review of Financial Studies, Vol. 33, Issue 3, March 2020, institutional investors consider risk management and engagement, rather than divestment, to be the better approach for addressing climate risks. The classification of strategies is based on Eurosif and the United Nations’ Principles for Responsible Investment (PRI). See, for example, the “2018 Eurosif European SRI Study”.
- See Faiella, I. and Natoli, F., “Natural catastrophes and bank lending: the case of flood risk in Italy”, Occasional Papers, No 457, Banca d’Italia, October 2018.
- “The Macroeconomic and Financial Stability Impacts of Climate Change”, Network for Greening the Financial System, June 2020.
- Four Twenty Seven describes the exposure of firms to physical hazards at five different levels: “highly exposed to historical and/or projected risks” (“high present/projected exposure” in Chart B.2, right panel), “exposed today and exposure level is increasing” (“increasing exposure” in Chart B.2, right panel), “exposed to some historical and/or projected risks” (“some present/projected exposure” in Chart B.2, right panel), “not significantly exposed to historical or projected risks” and “no exposure” (grouped together as “no significant exposure” in Chart B.2, right panel). The risk indicators integrate information on current and projected hazards up to 2040.
- The assumption of corporate head office location as the place where the firm is exposed to physical hazards is a reasonable assumption for small and medium-sized firms and for those sectors that do not commonly involve multiple physical locations in their activities. In turn, it may fall short of capturing the full extent of firms’ exposure to physical hazards for larger firms with multiple production facilities or locations.
- These 25 banks represent 64% of the banking system in terms of total assets, suggesting that exposures to climate-related risks tend to be more concentrated than overall exposures.
- This analysis is based on a joint study with EIOPA.
- See “Draft Application Paper on the Supervision of Climate-related Risks in the Insurance Sector”, International Association of Insurance Supervisors (IAIS) and Sustainable Insurance Forum (SIF), October 2020.
- See “Forging a climate-resilient Europe - the new EU Strategy on Adaptation to Climate Change”, European Commission, 24 February 2021.
- See also de Guindos, L., “Shining a light on climate risks: the ECB’s economy-wide climate stress test”, The ECB Blog, 18 March 2021.
- See “NGFS Climate Scenarios for central banks and supervisors”, Network for Greening the Financial System, June 2020.
- All model specifications and details of their calibration will be published by mid-2021 in a dedicated ECB Occasional Paper.
- The sample of EMIR data used here includes transactions with at least one counterparty located in the euro area or the underlying issued by a euro area entity; reliable data start in 2017. Reported data do not capture the full EU emission-related derivatives market. The data (reported by both trade counterparties) are paired and de-duplicated, then outliers are removed. The final data can still be subject to data quality limitations (e.g. missing values, some transactions remain unpaired, possible under-reporting, etc.).
- See also the box entitled “The performance and resilience of green finance instruments: ESG funds and green bonds”, Financial Stability Review, ECB, November 2020, with evidence on the resilience of flows into ESG funds compared with their non-ESG peers.
- In January 2021 the Eurosystem started accepting sustainability-linked bonds as eligible collateral for Eurosystem credit operations and also for Eurosystem outright purchases for monetary policy purposes, provided they comply with all other eligibility criteria. This signals the Eurosystem’s support for innovation in the area of sustainable finance.
- See “Testing Draft EU Ecolabel Criteria on UCITS equity funds”, European Commission, June 2020.
- See, for example, Goldstein, I., Jiang, H. and Ng, D.T., “Investor flows and fragility in corporate bond funds”, Journal of Financial Economics, Vol. 126, Issue 3, December 2017.
- This is an average result for the full sample; however, there is significant diversity within the sample.
- The term “greenium” refers to a lower yield for green bonds compared with conventional bonds with a similar risk profile, reflecting the fact that green projects benefit from cheaper financing.
- Ehlers, T., Mojon, B. and Packer, F., “Green bonds and carbon emissions: exploring the case for a rating system at the firm level”, BIS Quarterly Review, September 2020, find that current labels for green bonds do not necessarily signal lower or decreasing carbon intensity of issuers; Fatica, S. and Panzica, R., “Green bonds as a tool against climate change?”, Business Strategy and the Environment, March 2021, show a decrease in the carbon intensity of green bond issuers’ assets after borrowing in the green segment.
- Capasso, G., Gianfrate, G. and Spinelli, M., “Climate change and credit risk”, Journal of Cleaner Production, Vol. 266, September 2020, and Höck, A., Klein, C., Landau, A. and Zwergel, B., “The effect of environmental sustainability on credit risk”, Journal of Asset Management, Vol. 21, March 2020, show that high emitters have shorter distance to default and higher credit spreads.
- The International Financial Reporting Standards (IFRS) Foundation is currently developing new sustainability reporting standards, starting from the recommendations of the Task Force on Climate-Related Financial Disclosures, to foster more informative forward-looking disclosures.
- Recent EU initiatives include a proposed Corporate Sustainability Reporting Directive, as released on 21 April 2021 and based on the review of the Non-Financial Reporting Directive, ongoing work on the EU taxonomy for sustainable activities including the EU Taxonomy Climate Delegated Act, and EBA initiatives on prudential disclosures of ESG risks.
- See “Guide on climate-related and environmental risks – Supervisory expectations relating to risk management and disclosure”, ECB Banking Supervision, May 2020.