


The impact of loan and market-based credit supply shocks on euro area GDP growth
Published as part of the Financial Stability Review, November 2021.
The global financial crisis put focus on the impact of loan supply on GDP growth – but since then credit to firms has also been increasingly supplied via debt securities. In the euro area, the credit supplied to non-financial corporations (NFCs) via debt securities, i.e. through market-based debt financing, has doubled from around 10% of total external debt financing to NFCs in 1999 to around 20% in 2020.[1] This structural shift raises the question of the extent to which market-based credit to NFCs, and disruptions in the supply of such credit, play a role in explaining GDP growth – a topic for which there is little empirical evidence so far
Chart A
NFC debt securities growth significantly exceeded NFC loan growth over the last two decades, while supply shocks to both types of NFC debt financing play an important role in explaining GDP growth
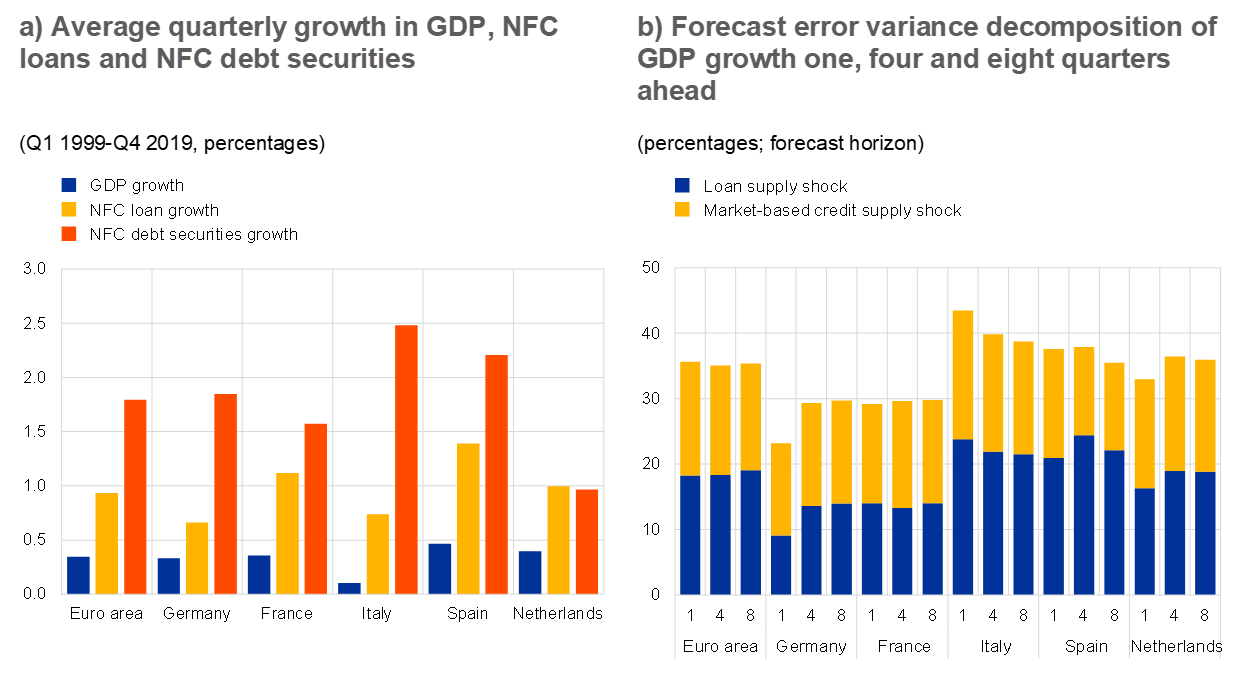
Sources: ECB (euro area accounts, MFI balance sheet item statistics and financial vehicle corporation statistics), Eurostat, Datastream, Gilchrist and Mojon, and authors’ calculations.
Note: Panel a: NFC loans include loans provided to euro area NFCs by euro area banks, euro area non-banks and the rest of the world. NFC debt securities include debt securities issued by euro area NFCs. Panel b: the bars depict the explanatory power of the two types of shock in explaining real GDP growth in a quarterly Bayesian VAR model estimated on a country-by-country basis with six endogenous variables using data from Q1 1999 to Q4 2019. Corporate bond spreads for the euro area, Germany, France, Italy and Spain are available from Gilchrist, S. and Mojon, B., “Credit Risk in the Euro Area”, The Economic Journal, Vol. 128(608), 2018, pp. 118-158; corporate bond spreads for the Netherlands are calculated by the authors.
To help fill this gap, this box uses a Bayesian vector autoregression (BVAR) model to estimate the impact of both loan and market-based credit supply shocks on quarterly GDP growth in the euro area.[2] The model includes six endogenous variables: NFC nominal loan growth, NFC nominal debt securities growth, real GDP growth, inflation, the corporate bond spread and the one-year nominal interest rate. To identify credit supply shocks, the model applies sign restrictions consistent with the recent macroeconomic literature,[3] while a novel identification scheme with inequality restrictions is used to distinguish between the two types of credit supply shock (loan supply shocks and market-based credit supply shocks).[4] The model is estimated country-by-country for the five largest euro area countries and the euro area as a whole. Except for the Netherlands, the average debt securities growth significantly exceeded the average loan growth between 1999 and 2019, which in turn exceeded the average GDP growth in all five countries (see Chart A, panel a).
Overall, market-based credit supply shocks are found to play an important role in explaining GDP growth (see Chart A, panel b). On aggregate for the euro area, the explanatory power of market-based credit supply shocks is found to be comparable to that of loan supply shocks. In Germany and France, where corporate debt markets are relatively well developed, the explanatory power of market-based credit supply shocks exceeds that of loan supply shocks, and their impact on GDP growth is also highly persistent.
Chart B
Both types of credit supply shock had a major impact on euro area GDP growth during the global financial crisis, while their impact was less pronounced in the early 2020 pandemic-induced recession
Historical decomposition of euro area quarterly GDP growth
(Q1 2001-Q1 2020, percentages)

Sources: ECB (euro area accounts, MFI balance sheet item statistics and financial vehicle corporation statistics), Eurostat, Datastream, Gilchrist and Mojon, and authors’ calculations.
Notes: The historical decomposition reveals how much of the actual fluctuations in GDP growth is explained by the two credit supply shocks. The blue lines show actual quarterly GDP growth. The yellow lines depict the counterfactual quarterly GDP growth when excluding (i) both loan and market-based credit supply shocks (panel a), (ii) loan supply shocks (panel b), and (iii) market-based credit supply shocks (panel c). The difference between the blue and yellow lines depicts the contribution of the credit supply shock(s) excluded from the counterfactual GDP growth in explaining the actual GDP growth. For instance, in Q1 2009, the two credit supply shocks explain a GDP drop of around 2.9%, as depicted by the arrow in panel a. The results are based on the same model as in Chart A (panel b) for the euro area, except that the time period also includes the first two quarters of 2020 and a stochastic volatility framework is used over the entire sample to account for the exceptionally large shocks caused by the pandemic-related crisis.
The historical decomposition for the euro area also underscores that the two credit supply shocks explained most of the fall in GDP during the global financial crisis (see Chart B). Specifically, in the first quarter of 2009, GDP fell by 3.3%, with the two credit supply shocks explaining a GDP drop of around 2.9% (see Chart B, panel a), comprised of 1.6% attributable to a loan supply shock and 1.3% attributable to a market-based credit supply shock (see Chart B, panels b and c respectively).
By contrast, the impact on GDP of the two credit supply shocks was less pronounced during the pandemic-induced recession in early 2020. The market-based credit supply shock appears to have had an adverse impact on GDP (explaining a GDP drop of around 0.9%), while this is not the case for the loan supply shock. These results likely reflect the greater impact of the March 2020 market turmoil on non-bank financial intermediaries than on banks (see below). Overall, the lesser impact of credit supply shocks on GDP growth than in the global financial crisis is in line with the non-financial origin of the 2020 pandemic-induced recession.[5]
As market-based credit is mostly provided by non-bank financial intermediaries, our findings suggest that their resilience is important for GDP growth.[6] In this respect, enhancing the macroprudential framework for non-banks would strengthen the resilience of market-based financing, while also supporting GDP growth. For instance, in March 2020, non-banks shed assets on a large scale and market-based debt financing dried up, while NFCs continued to benefit from loans and credit lines provided by banks. Several factors supported the flow of bank credit to NFCs during the turmoil, including government guarantees and moratoria on loans together with the provision of liquidity to banks by central banks. Nevertheless, the regulatory reforms of the banking system after the global financial crisis, including macroprudential measures, also made banks more resilient to shocks. From this perspective, our results call for more regulatory attention relating to non-banks going forward (see Section 5.2).
- See Financial Stability Review, ECB, November 2020, Section 4, Chart 4.1 (left panel).
- For a fuller discussion of the model and its results, including various robustness checks (e.g. different identification schemes), see Barauskaitė et al., “The impact of credit supply shocks in the euro area: Market-based financing versus loans”, Working Paper Series, ECB (forthcoming).
- See, for example, Gambetti, L. and Musso, A., “Loan supply shocks and the business cycle”, Journal of Applied Econometrics, Vol. 32(4), 2017, pp. 764-782, and Mumtaz et al., “What do VARs tell us about the impact of a credit supply shock?”, International Economic Review, Vol. 59(2), 2018, pp. 625-646.
- Specifically, the contemporaneous response of loans (debt securities) is assumed to be the largest for the loan (market-based credit) supply shock as compared with the responses of other variables to this shock, along the lines of Peersman, G., “What caused the early millennium slowdown? Evidence based on vector autoregressions”, Journal of Applied Econometrics, Vol. 20(2), 2005, pp. 185-207.
- This supports the results for the COVID-19 shock estimated by the model, which are subject to a large uncertainty owing to the limited sample period.
- See Chart 4.2 and the related text.