
Sensitivity of sovereign debt in the euro area to an interest rate-growth differential shock
Published as part of the Financial Stability Review, November 2021.
Euro area sovereigns have issued significant amounts of new debt in response to the pandemic. As a result of this and the sizeable GDP drop, the euro area debt-to-GDP ratio increased to about 100% of GDP in 2020, above the peak of 95% reached in the aftermath of the euro area sovereign debt crisis. While the related fiscal support was crucial to limit economic scarring and aid the recovery, it has also triggered concerns about medium to longer-term debt sustainability. Sustainability risks hinge on a multitude of factors, including fiscal and economic prospects, financial market conditions, the structure of debt and institutional features.[1] A key factor among these is the interest rate-growth differential (𝑖−𝑔), also known as the “snowball effect”. If 𝑖>𝑔 a primary surplus is needed to stop the debt ratio from rising and an ever-larger surplus being needed to reduce it. Conversely, a persistently negative differential (𝑖<𝑔) would imply that debt ratios could be reduced even in the presence of primary budget deficits, as long as such deficits have a lower impact on the debt ratio than (𝑖−𝑔). This implies that projected budget balances play a key role as well: large and persistent primary deficits could prevent debt ratios from stabilising. The differential is surrounded by uncertainty related to the medium-term growth outlook and the long-term path of sovereign interest rates. Against this backdrop, this box assesses the impact of a rising (𝑖−𝑔) differential on sovereign debt ratios in the euro area.
The current favourable financing conditions and the expected economic recovery are helping to contain the short-term impact of the pandemic on sovereign debt sustainability. Indeed, sovereign interest payments have continued to decline as a share of both debt and GDP, despite higher overall debt levels (see Chart A, panel a). In addition, governments are (re)financing debt at increasingly long maturities, contributing to lower rollover risks. Finally, to the extent that higher debt levels help economic growth to recover more quickly, some of the increase in sovereign debt-to-GDP ratios will reverse as the economy recovers. As a result, even elevated debt levels can be considered sustainable in the short-to-medium term provided that primary deficits do not outweigh the favourable contribution from projected negative (𝑖−𝑔).
Empirical evidence from past crises suggests that reversals in interest rate-growth differentials are not uncommon, notably for higher-debt countries. From a historical perspective, while periods of negative (𝑖−𝑔) have not been uncommon, most of the literature assumes that (𝑖−𝑔) should be positive over the longer run, at least in advanced economies that are closer to their steady state.[2] For the mature euro area economies (as well as for most other advanced economies), differentials have been mostly positive on average since the early 1980s and over the EMU period. For the euro area aggregate debt, (𝑖−𝑔) was 0.8 percentage points on average between 1999 and 2019 (0.6 percentage points for the period before 2008). Higher-debt countries tended to have higher differentials (see Chart A, panel b), among other things, as they paid higher risk premia in times of economic stress and have historically experienced a larger decline in economic activity. The pandemic brought a surge in the differentials for 2020 as GDP growth dipped, with record – albeit temporary – differentials for all countries.
Chart A
Large positive interest rate-growth differentials are not uncommon during episodes of stress, particularly affecting countries with higher debt levels
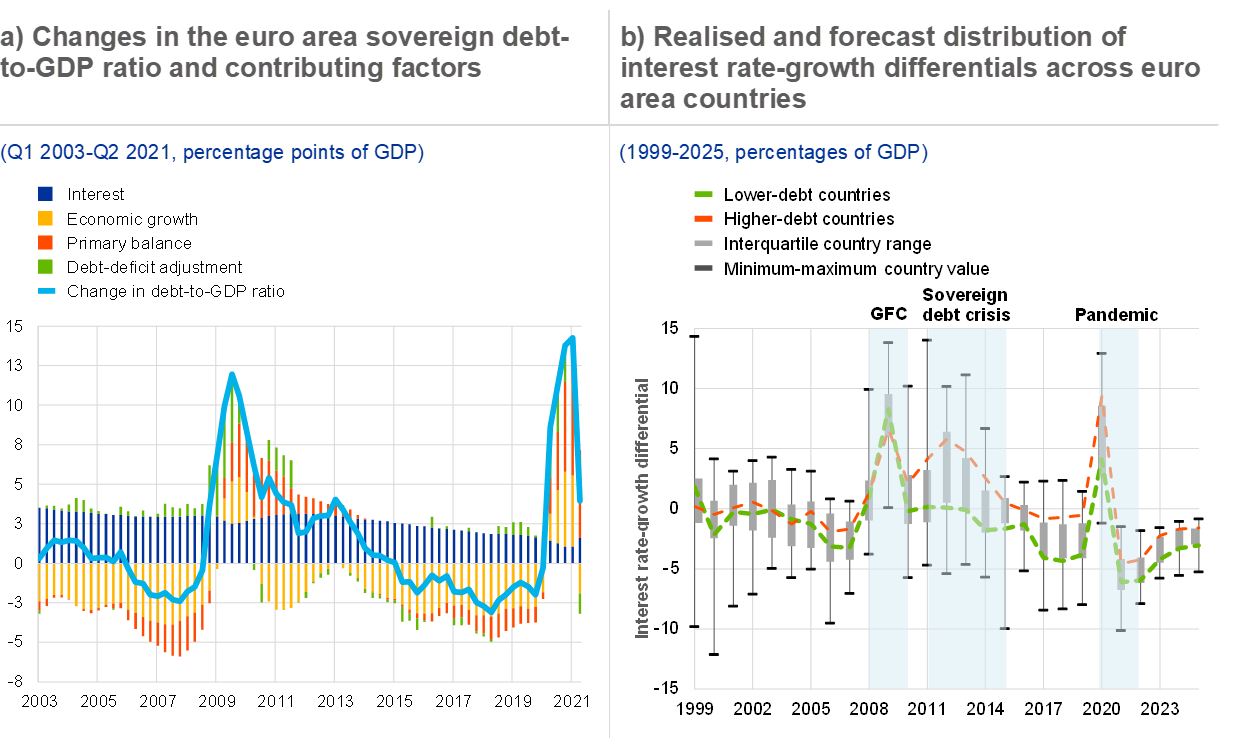
Sources: ECB and ECB calculations.
Notes: Panel a: the debt-deficit adjustment (DDA) captures the effects of the accumulation or sale of financial assets, changes in the value of foreign debt owing to exchange rate changes and remaining statistical adjustments, as well as other residuals. While relevant for debt dynamics, especially in crises times, DDA is assumed to be broadly neutral over the longer term, and thus abstracted from the discussions in this box (paragraph 1). The change in the government debt-to-GDP ratio can be decomposed as follows:
where
is a time subscript, b is general government gross debt as a percentage of GDP, pb is the primary balance as a percentage of GDP, i is the average (implicit) nominal interest rate on government debt, g is the nominal GDP growth rate and dda is the debt-deficit adjustment. Panel b: Estonia, Latvia and Lithuania are excluded for the period preceding 2011 on account of extreme (𝑖−𝑔) values and very high volatility. Ireland is excluded for 2015 due to a revision in GDP methodology. The aggregate of higher-debt countries includes euro area countries with a 2019 debt-to-GDP ratio above 90%. The lower-debt aggregate includes the remaining euro area countries. Averages in this chart are unweighted. The interest rate-growth differential is computed as the difference between the average nominal interest rate that governments pay on their debt (ratio of government interest payments in year t to the debt stock in t-1) and the nominal GDP growth rate. Projections over 2021-25 are based on an ESCB debt sustainability tool using September 2021 ECB macroeconomic and fiscal projections for 2021-23 (benchmark scenario). GFC: global financial crisis.
A benchmark scenario consistent with a continued economic recovery suggests a declining debt path, but at levels still higher than before the crisis for the higher-debt countries. Under a benchmark debt sustainability scenario (which assumes a continued economic recovery in line with ECB projections and further convergence to potential output growth, a fiscal path of improving structural balances, inflation converging to the ECB’s target and sovereign interest rates in line with market expectations), (𝑖−𝑔) is expected to decline below zero for all euro area countries as of 2021 and for the foreseeable period thereafter. Despite rising over the scenario period, (𝑖−𝑔) still remains negative over the medium-to-longer run and well below its long-term average. As such, understanding the implications of possible higher (𝑖−𝑔) differentials is key to gauging the resilience of sovereign debt sustainability and the higher debt levels induced by the pandemic.
Sensitivity analysis indicates that an (𝑖−𝑔) shock would be more detrimental for higher-debt countries. Indicative simulations capturing (only) adverse risks to the (𝑖−𝑔) differential under four alternative scenarios, which consider historical patterns in the distribution of (𝑖−𝑔) or calibrated forward-looking shocks, suggest more debt pressure in all cases, notably for higher-debt countries (see Chart B). The “historical mean” scenario, in which countries’ differentials return to their 1999-2019 average over ten years, shows an upward debt path even for lower-debt countries. In the “BVAR uncertainty” scenario, the shock calibrated based on the (usually reported) 68th upper percentile of the (𝑖−𝑔) distribution from a Bayesian vector autoregression (BVAR) model with relevant macroeconomic, financial and fiscal variables sees a milder impact but still with a substantial rise in the debt burden, especially for higher-debt countries. In the “(𝑖−𝑔) high inflation” scenario[3], higher than currently projected inflation, accompanied by monetary policy tightening, also heightens debt sustainability risks for higher-debt countries. The aggregate debt ratios decline in the first year after the shock, owing to the favourable denominator effect, but then start rising again for several years, even though the interest rate-growth differential remains negative. In the “(𝑖−𝑔) low inflation” scenario, where the inflation rate is assumed to follow a path below the ECB’s target, with no further central bank reaction (interest rates assumed already at the effective lower bound), the debt ratios would also remain on a higher path than in the benchmark but would stabilise.
Chart B
An adverse (i−g) shock would have negative implications, in particular for higher-debt countries

Sources: ECB and ECB calculations.
Notes: The benchmark refers to the main scenario of the debt sustainability analysis simulations based on the September 2021 Macroeconomic Projection Exercise for the period 2021-23 and assumes broad minimum compliance of the fiscal path thereafter with the Stability and Growth Pact (gradual convergence to countries’ specific medium-term fiscal objectives, with current debt rule requirements not included in the simulations). For more details, see Bouabdallah et al., op. cit. The (GDP-weighted) aggregate of higher-debt countries includes euro area countries with a 2019 debt-to-GDP ratio above 90%: BE, GR, ES, FR, IT, CY, PT. The lower-debt aggregate includes the remaining euro area countries. The alternative scenarios show risks stemming from less favourable (i−g) dynamics as of 2022. In the (i−g) historical mean scenario, the interest rate-growth differential is assumed to converge over ten years to its 1999-2019 average, or at least 0.5 percentage points. The BVAR scenario reflects the impact on benchmark debt of (i−g) following the 68% percentile path of its distribution based on a BVAR model (for more details, see Checherita-Westphal, C. and Domingues Semeano, J., “Interest rate-growth differentials on government debt: an empirical investigation for the euro area”, Working Paper Series, No 2486, ECB, November 2020). The (i−g) high inflation scenario assumes the standard reaction of monetary policy to an inflationary shock (3% for four years) according to an estimated Taylor rule. In the (i−g) low inflation scenario, the inflation rate is assumed to follow a path below the ECB’s target, in line with indicators of market expectations. For individual countries, specific conditions apply; Greece is one example, where a very large share of the stock of debt is fixed-rate and governed by official financing conditions, and therefore consistently excluded from the calculation of the historical average as well as from the simulated path of i-g differential.
All in all, the risks arising from the pandemic-induced increase in sovereign debt levels appear manageable in the shorter run, but sovereign risks could intensify in the event of a sustained rise in (𝑖−𝑔) levels. The ongoing economic recovery is expected to deflate some of the recent increase in sovereign debt-to-GDP ratios, while favourable financing conditions, if supported by fiscal prudency and growth-friendly policies, are expected to keep rollover risks in check. However, shocks to currently projected (𝑖−𝑔) levels could prove detrimental to debt dynamics in both higher and lower-debt countries. For higher-debt countries, any adverse deviation from the benchmark (𝑖−𝑔) scenario would further increase the debt burden and potentially heighten overall vulnerabilities. This, in turn, could trigger a reassessment of sovereign risk by market participants and reignite pressures on more vulnerable sovereigns. While these events, especially the return to (𝑖−𝑔) historical averages, do not have a high probability, risk monitoring should continue.
- For more details, see Bouabdallah, O., Checherita-Westphal, C., Warmedinger, T., de Stefani, R., Drudi, F., Setzer, R. and Westphal, A., “Debt sustainability analysis for euro area sovereigns: a methodological framework”, Occasional Paper Series, No 185, ECB, April 2017.
- See Box 11 in Work stream on monetary-fiscal policy interactions, “Monetary-fiscal policy interactions in the euro area”, Occasional Paper Series, No 273, ECB, September 2021 for an overview. A debate on the role of fiscal policy with a persistently negative (i−g) was revived by Olivier Blanchard in his 2019 American Economic Association presidential address. Other authors (e.g. Charles Wyplosz) conclude that (𝑖−𝑔) <0 is not the norm for advanced economies (and has not been since at least the 1960s) or, even if extended periods of negative (i−g) exist, they are not necessarily conducive to lower debt ratios and sovereign stress.
- For more details on the calibration of the latter two scenarios, see also Box 18 in Work stream on monetary-fiscal policy interactions, “Monetary-fiscal policy interactions in the euro area”, Occasional Paper Series, No 273, ECB, September 2021.