
Selecting adverse economic scenarios for the quantitative assessment of euro area banking system resilience
Published as part of the Financial Stability Review, November 2020.
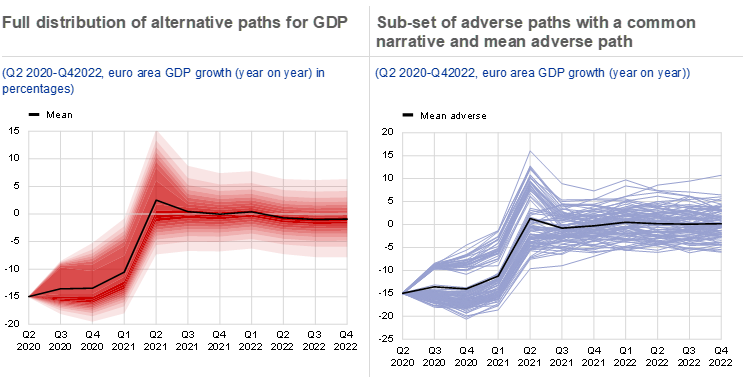
The adverse scenarios used to assess banking system resilience quantitatively in the FSR are selected as extreme events. They are derived directly from the output of the macro-micro model.[1] Specifically, the model generates several thousand alternative paths for economic and bank-level variables using the combinations of macro-financial shocks sourced from their historical distributions. This results in a large set of both strong and weak scenarios, exemplarily illustrated for the euro-area GDP (see Chart A, left panel). Adverse scenarios for use in the analysis are then selected among adverse paths where the evolution of variables mirrors a particular narrative commonly linked to prevalent financial stability concerns for example, scenarios reflecting the economic effects of lockdowns. This approach contrasts to the methodology for scenario design used by the European Banking Authority (EBA) and ECB Banking Supervision, which relies more on judgment to select the scenario severity and calibrate the parameters.[2]
Chart A
Adverse scenarios for quantitative banking system assessment amalgamate historical data and economic narrative
Source: ECB calculations.
Notes: Illustration of the narrative-based selection from the full distribution of scenarios starting in the third quarter of 2020. Left panel: Full distribution of year-on-year growth rate of real euro area GDP with different shared of red reflecting different percentile of the distribution, the solid black line is the mean of the distribution, Right panel: Blue solid lines represent various scenarios selected from the full distribution which are most consistent with the assumed adverse scenario narrative. The black line reports the mean of the euro area GDP across these adverse scenarios.
The analysis reports the mean outcomes from a set of adverse scenarios following the same narrative (see Chart A, right panel). All selected scenarios correspond with system-wide solvency rates with low probability of realisation i.e. lying in at most 20% percentile of their distribution at the end of the horizon. The focus on the mean outcome across the selected subset of adverse scenarios, rather than the outcome from a single scenario closest to the narrative, aims to take account of scenario uncertainty. The resulting scenarios should have stronger statistical plausibility as compared to scenario designs that rely mostly on judgement (so called hypothetical approaches[3]), though have limitations in terms of their comprehensiveness and when thinking about potential future risks not yet reflected in the data.
- Budnik, K., Balatti, M., Dimitrov, I., Groß, J., Kleemann, M., Reichenbachas, T., Sanna, F., Sarychev, A., Siņenko, N. and Volk, M., “Banking euro area stress test model”, Working Paper Series, No 2469, ECB, September 2020.
- For a more detailed description of the scenario design, see Dees et al. (op. cit.) and Henry, J. and Kok, C. (eds.), “A macro stress testing framework for assessing systemic risks in the banking sector”, Occasional Paper Series, No 152, ECB, October 2013. Regarding the tool used to calibrate financial shocks, see the technical note on the ESRB’s website.
- See Bunn, et al, “Stress testing as a tool for assessing systemic risks”, Bank of England Financial Stability Review, June 2005.