
Financial Integration and Structure in the Euro Area, March 2020
Preface
As part of its efforts to streamline and focus its publications, the ECB has decided to combine the previous report on “Financial integration in Europe” (last published in May 2018)[1] and the previous “Report on financial structures” (last published in October 2017)[2] into a single report on “Financial integration and structure” in the euro area. This report is designed to focus on structural developments in the financial system of the euro area, and in some cases also of the European Union (EU), and related policy issues. It will be published at a biennial frequency. The new report will, first, pay specific attention to key structural developments such as the process of financial integration, changes in financial structure and the process of financial development or modernisation. Second, it will discuss selected financial sector policies, notably policies related to the European banking union and capital markets union (CMU), and thereby also contribute to the debate on how European Economic and Monetary Union (EMU) can be deepened.
For the ECB, the market for a given set of financial instruments and/or services is fully integrated if all potential market participants with the same relevant characteristics: (1) face a single set of rules when they decide to transact in those financial instruments and/or services; (2) have equal access to the above-mentioned set of financial instruments and/or services; and (3) are treated equally when they are active in the market.[3] The financial structure of a financial system can be understood as the mixture of financial intermediaries and of financial markets operating within the economy of that system.[4] One way of defining financial development (or financial modernisation for an already highly developed financial system like the one of the euro area) is the process of financial innovations, as well as institutional and organisational improvements in the financial system that reduces asymmetric information, increases the completeness of markets and contracting possibilities, reduces transaction costs and ensures a high level of competition.[5]
The Eurosystem has a keen interest in the integration, structure and development of the financial system in Europe, and especially in the euro area. All three interact with the implementation of monetary policy and influence its transmission throughout the euro area. All three also interact in multiple ways with financial stability. In addition, financial integration and development are two reasons behind the Eurosystem’s task of promoting well-functioning payment systems. Without prejudice to price stability, the Eurosystem also supports the objective of completing the EU Single Market, of which the banking union (since 2012) and the capital markets union (since 2014) have become important drivers in the financial services area. For all these reasons, the ECB monitors and assesses financial integration, structure and development and expresses its views on relevant policy options.
In general, each issue of the report will contain a first chapter reviewing the main trends in financial integration, structure and development, and a set of special feature articles and boxes, which will provide deeper analyses of specific issues or policies. This first issue of the new report includes special features and boxes on:
- the implications of Brexit for the EU/euro area financial system;
- the need to take the CMU project further;
- the implications of a common sovereign safe asset for the functioning of the banking and capital markets unions;
- euro area cross-border bank mergers and acquisitions in an international context;
- the role of equity markets in “greening” the economy; and
- the euro area fintech scene and how to improve the related statistics.
The ECB has since September 2005 released biannual updates of a set of indicators of financial integration. Similarly, since November 2004 it has also published a selection of EU structural financial indicators in the “Report on financial structures” (previously the “Report on EU banking structure”). Going forward, the ECB will continue these practices with a biannual release of a streamlined set of indicators covering both financial integration and financial structure.
Key messages
1 Overall assessment of financial structure and integration
The size of the euro area financial system has been broadly stable in the last few years at a level around six to seven times GDP, roughly in line with the relative sizes of financial systems in other major countries. The overall size of a financial system can be estimated, among other ways, from the assets of financial intermediaries or from the liabilities of all economic sectors. In June 2019 the total stock of assets held by euro area financial intermediaries amounted to €82 trillion (including assets held by the Eurosystem). This is more than seven times euro area GDP (see Chart 1.1, left panel). This figure has changed little since 2015. At the end of 2018 total financing of euro area sectors stood at €67 trillion, which is almost six times euro area GDP and has changed little since about 2014. Such proxies of total financial system size also constitute one way of assessing the development of a financial system in an economy. They are indicative of the capacity that a financial system has to channel funds of agents with surpluses to agents in need of financing for consumption or productive investment purposes. At the same time, the financial crisis that started in 2007 illustrated that too large a financial system could indicate widespread imbalances and therefore pose a serious threat to financial stability and, ultimately, economic welfare. Moreover, there are other dimensions of financial development that may not be reflected well in total assets or liabilities, such as financial innovations, as well as institutional and organisational improvements in the financial system.
In terms of the roles of different financial intermediaries, the euro area financial structure shows a medium-term movement from strong bank dominance towards a more balanced composition, in which different types of non-bank financial intermediaries are becoming increasingly important. Another dimension that characterises a financial system is its structure, which refers to the mixture of financial intermediaries and financial markets that operate in the economy. For example, the right panel of Chart 1.1 shows that – by assets – the largest financial sub-sector remains banks (credit institutions), although their share has consistently declined since the early 2000s. At the same time, the importance of non-money market investment funds, of a residual category of “remaining” other financial institutions[6] (comprising a wide set of different intermediaries and other entities, including security and derivatives dealers or brokers, insurance brokers, asset management companies, venture capital companies, investment advisers, financial holding companies, specialised lending companies, funding vehicles of non-financial corporations – e.g. supporting their debt securities issuance – and other entities that channel financial flows within non-financial corporations), and of the Eurosystem increased. In other words, in terms of the asset shares of different types of financial intermediaries, bank dominance in the euro area financial system has weakened, notably after the financial and sovereign debt crises.
Chart 1.1
Total assets of the euro area financial sector and shares of different types of financial intermediaries
(ratio of assets to nominal GDP (left panel); percentages (right panel); March 1999 -June 2019)
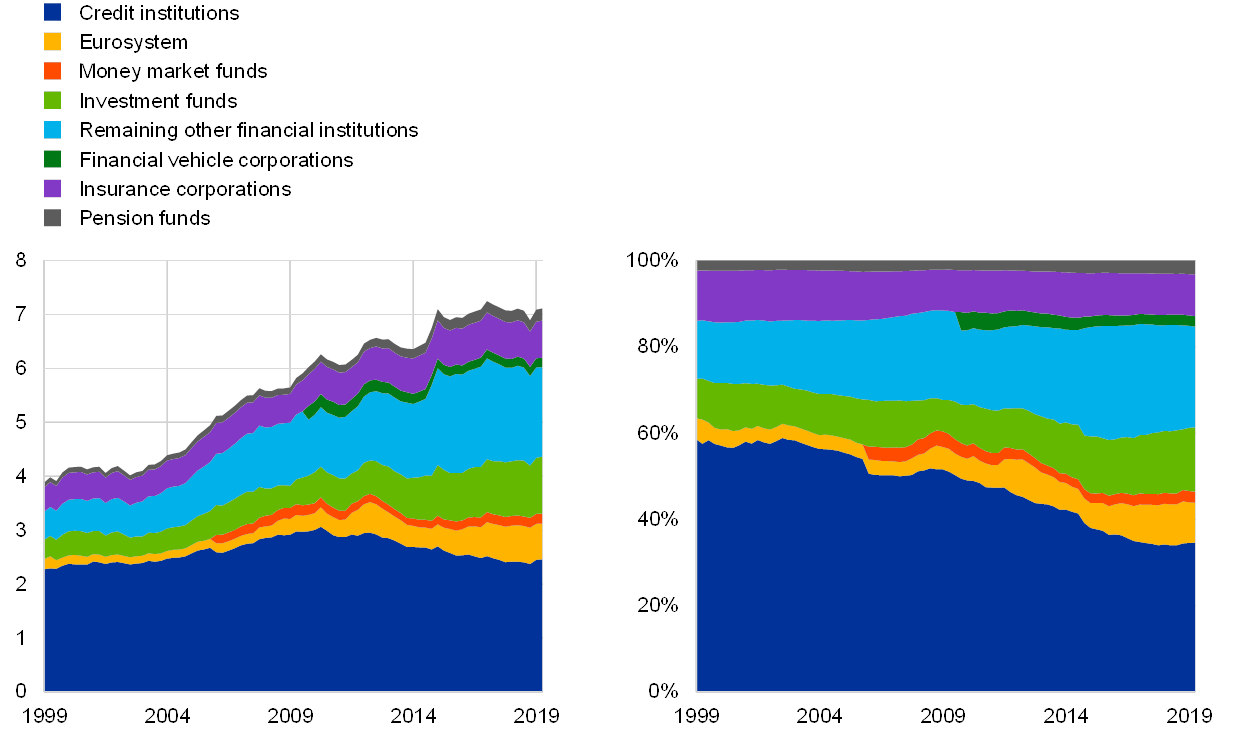
Source: ECB.
Notes: The aggregated (non-consolidated) assets of sub-sectors include financial assets and exclude non-financial assets. Remaining other financial institutions include security and derivative dealers, financial corporations engaged in lending (such as leasing or factoring companies), specialised financial corporations (including venture capital companies, export/import financing companies or some central clearing counterparties), financial auxiliaries (including for example asset management companies, securities brokers, investment advisers, insurance brokers or exchanges) as well as captive financial institutions and money lenders (including for example financial holding companies, funding vehicles of non-financial corporations – e.g. supporting their debt securities issuance – and other entities that channel financial flows within non-financial corporations). Data on money market funds are reported separately from credit institutions only as of Q1 2006. Data on financial vehicle corporations, which are undertakings carrying out securitisation transactions, are reported separately from remaining other financial institutions as of Q4 2009.
Investment and pension funds have been the fastest-growing types of non-bank financial intermediaries in the euro area over the last few years. Non-bank financial intermediaries (all areas in Chart 1.1, except the dark blue one for credit institutions and the yellow one for the Eurosystem), which accounted in June 2019 for almost 60% of total euro area financial sector assets, deserve particular attention. This is not only because their growth may represent financial development and a more diversified financial system, but also because it may reflect – in part – the migration of risks from the banking sector, which was re-regulated significantly after the crisis, to less regulated financial sub-sectors. A first observation in this regard is that the remaining other financial institutions (OFIs), which cannot be broken down with the currently available statistics and therefore remains relatively opaque, constitutes a substantial share of non-bank financial intermediaries by assets. A second observation is that investment funds and pension funds have been the fastest-growing categories in recent years and investment funds had already earlier become the second largest non-bank financial intermediary group in the euro area behind the residual remaining OFIs. The third and fourth largest types of non-bank intermediaries are insurance corporations and pension funds, respectively.
While non-bank financial intermediary growth has a number of benefits reflecting financial development, it also calls for prudential policy attention to how to contain transforming and potential newly emerging or even increasing financial stability risks. Investment fund growth is important for a variety of reasons. First, European households still hold a relatively large share of their savings in bank deposits, but in the current low interest rate environment various types of investment funds (based on past experience) offer more attractive returns on well-diversified portfolios. Second, many types of investment funds offer cross-country diversification for equities, bonds or other (less tradable) assets, which makes them natural conduits for private financial risk sharing in the euro area. The recent adoption of an EU directive and regulation to promote the cross-border distribution of investment funds may be helpful in this regard.[7] Third, the growing financial flows into investment funds, combined with increasing liquidity mismatches on their balance sheets (see, for example, sub-section 4.2 of the November 2019 ECB Financial Stability Review), may lead to greater financial stability risks and therefore require prudential policy attention. The recommendations published by the Financial Stability Board in 2017 and the European Systemic Risk Board in 2018 aim to address structural vulnerabilities of asset managers arising, in particular, from liquidity mismatches.[8] Progress in implementing these recommendations in Europe can be achieved in the context of a review of EU legislation, such as the ongoing review of the Alternative Investment Fund Managers Directive, for which a public consultation is expected in the second half of 2020.
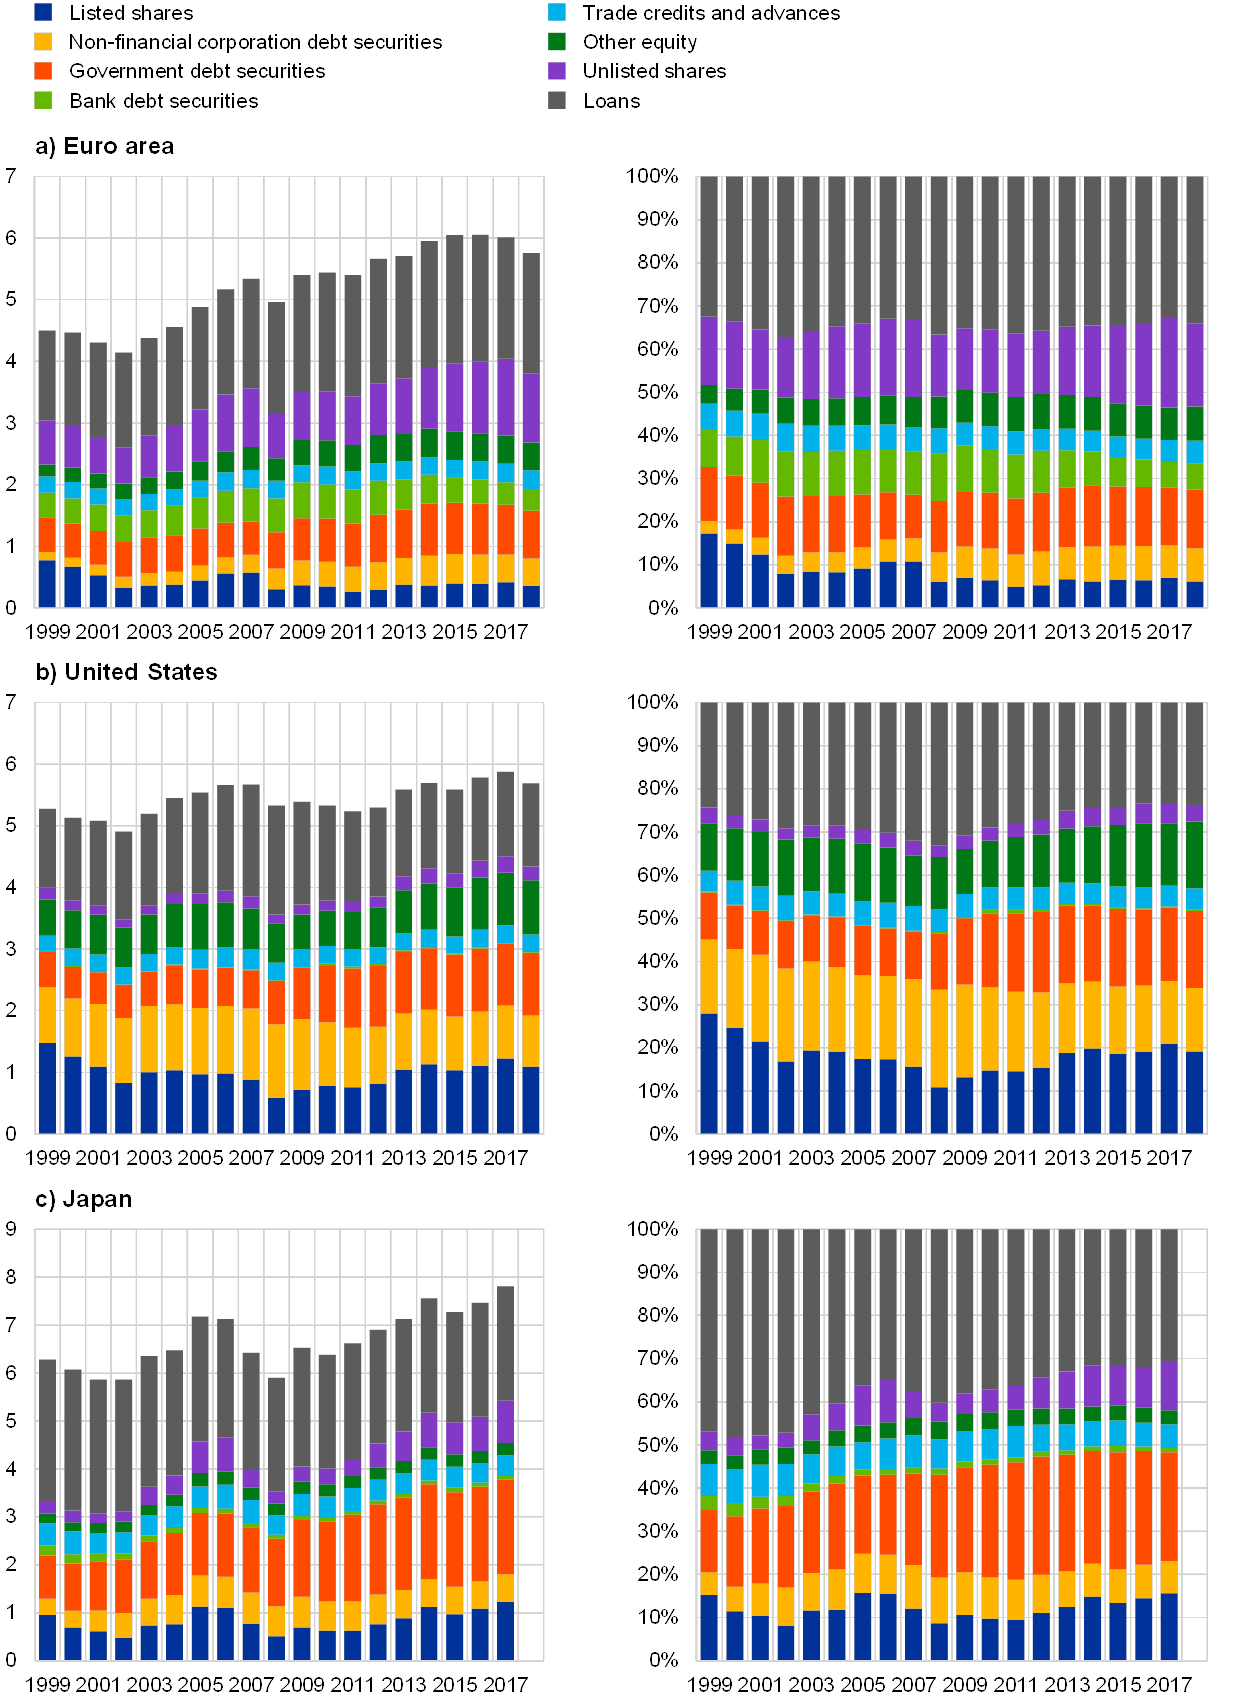
In terms of the roles of different financial markets, the euro area financial structure is characterised by a continuing dominance of non-marketable financing instruments, such as loans and unlisted shares. The second way of describing financial structure through the mixture of markets is via the relative importance of different financing instruments employed by the main economic sectors. Chart 1.2 details the relative shares of the main (on-balance-sheet) financial instruments in the aggregate financing of all economic sectors (households, firms and government, but excluding the external sector) for the euro area, the United States (US) and Japan. The three panels reveal some tangible differences, in line with the widespread view that Europe and Japan have more bank-based financial systems and the United States has a more capital market-based system. The euro area economy has particularly large shares of financing through loans and unlisted shares and the Japanese economy through loans and government debt securities. The US economy has a larger part of financing through listed shares and non-financial corporation (NFC) debt securities than the euro area or Japan (although the shares of loans and other equity are not small).
Only some marketable instruments, notably NFC debt securities, show a small medium-term upward trend in the euro area, while the amount of public equity remains relatively small. While the share of all equity instruments in total financing in the euro area is comparable to that in other countries, the proportions of different equity instruments are not. Financing through equity traded on public markets (listed shares) is relatively small, while financing through private equity (unlisted shares) is relatively large. In line with its bank-based system, the share of bank bonds – effectively financing loans (and leading to some double-counting in Chart 1.2) – is relatively large for the euro area compared with the US or Japan. At the same time, bank bond financing has somewhat declined after the financial crisis and direct corporate bond financing has increased, meaning that the latter has become larger than the former in the euro area. However, the slowly moving aggregate stocks displayed in Chart 1.2 do not suggest a generalised trend towards greater market-based financing, as financing through unlisted shares has broadly increased in tandem. They also mask significant cross-country heterogeneity in the relative importance of market-based instruments. If anything, Chart 2 in the first chapter of this report shows a mild decline for all sectors together over the last two decades. This may, however, have bottomed out recently, as the market-based financing of NFCs recovered after the crisis (probably because NFCs needed to compensate for bank deleveraging).
Chart 1.2
Financing structures of the euro area, US and Japanese economies by type of instrument
(percentages; annual data: 1999 -2018)
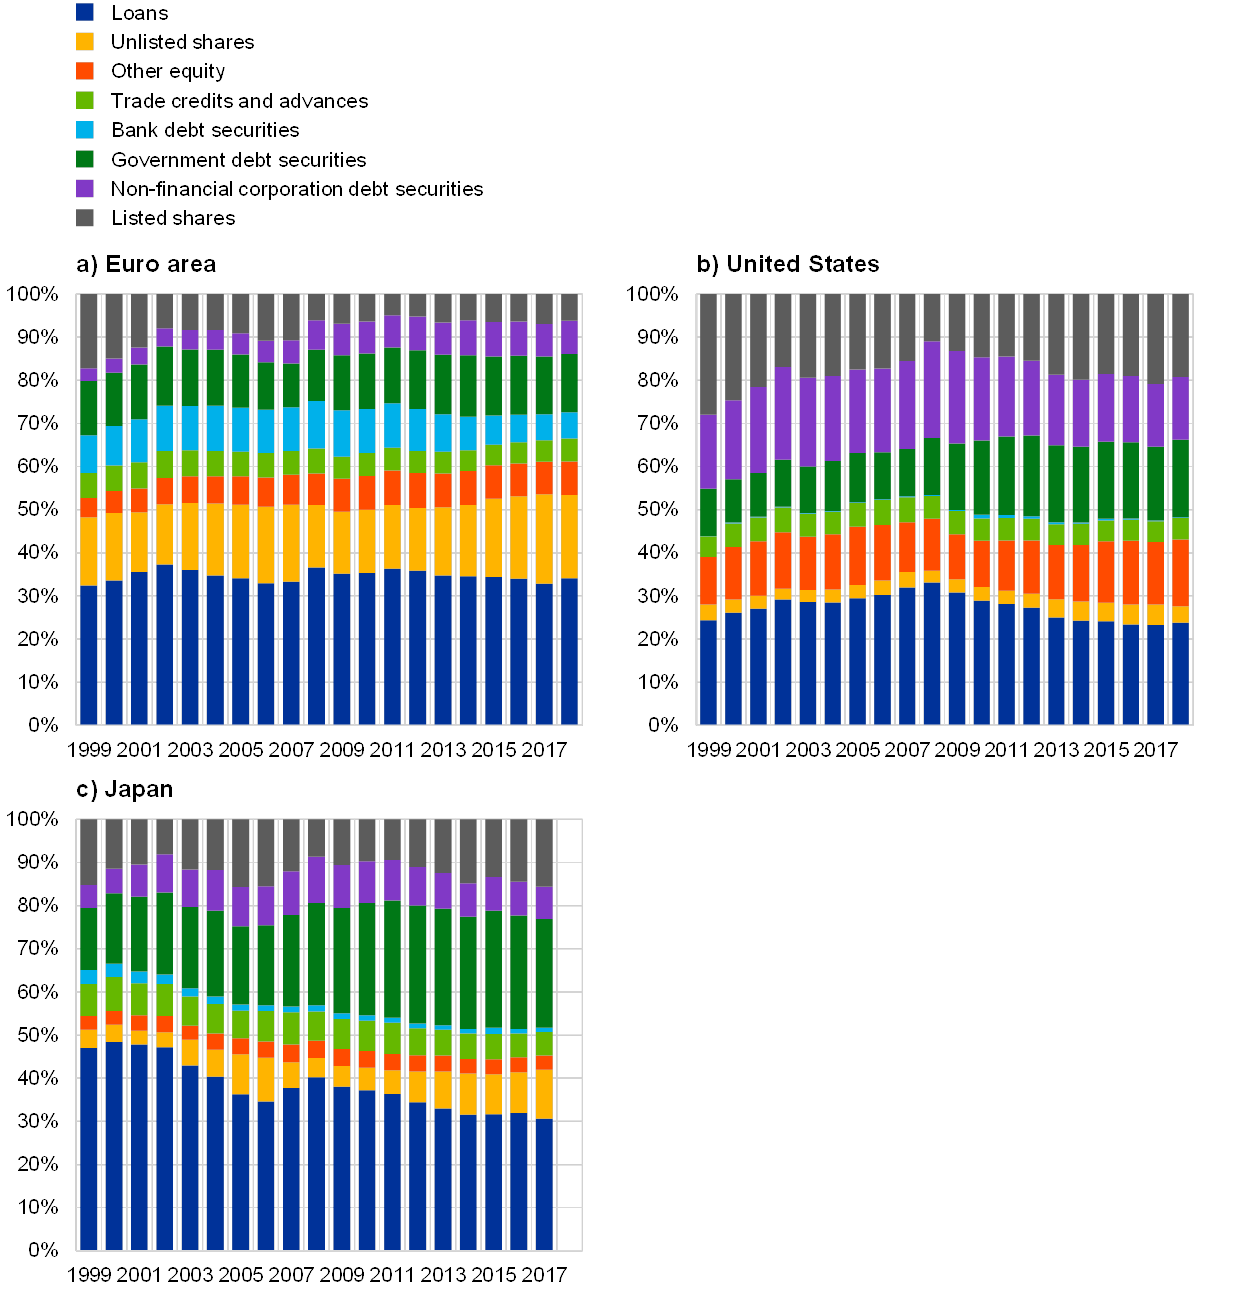
Sources: ECB for euro area and OECD for United States and Japan.
Notes: The chart is constructed from the liabilities of all economic sectors, excluding liabilities to the rest of the world, loans from NFCs (to net out intra-company loans in this non-consolidated data), currency and deposits, investment fund shares or units, entitlements from pension, insurance and standardised guarantee schemes, financial derivatives and employee stock options as well as other accounts payable. Other equity refers to equity claims that are not securities listed on an exchange and not unlisted securities, such as equity in incorporated partnerships, equity in limited liability companies whose owners are partners, capital invested in cooperative societies or investment by the government in the capital of public corporations whose capital is not divided into shares. Data for the United States and Japan are based on the global System of National Accounts (SNA) 2008. The European System of Accounts (ESA) 2010 underlying the euro area data is broadly consistent with the SNA 2008, although in some cases it may be more detailed.
The post-crisis bank restructuring process in the euro area is continuing at a gradual pace, but the limited domestic and cross-border consolidation seems to also be a global phenomenon. Since the financial crisis, the euro area banking sector has been going through a gradual restructuring process, which involves the search for new business models, the adjustment to the revised regulatory regime, consolidation and the resolution of non-performing assets. The number of euro area banks continues to decline slowly, as consolidation has remained rather muted since the crisis, whereas the number of foreign branches has been broadly stable. Interestingly, Box 3 in the first chapter finds that subdued post-crisis consolidation dynamics are not specific to the euro area or the EU. Similarly, low domestic and cross-border bank merger and acquisition (M&A) activity since 2010 has also been observed in the other main free-trade areas around the globe, including the United States-Mexico-Canada Agreement (USMCA, the successor to the North American Free Trade Agreement or NAFTA) area and the Association of Southeast Asian Nations (ASEAN) area.
One specific obstacle to bank consolidation in the euro area could be persistently low valuations and their underlying causes, in addition to other economic, business and regulatory factors. The single currency and the banking union could have been expected to result in a greater cross-border component of the bank consolidation process than in other regions of the world. But this is not the case. In addition to a series of economic, business and regulatory factors (including the still incomplete banking union) discussed in the 2018 ECB report on “Financial integration in Europe”, the box in this report points to declining valuations of euro area banks in the last few years as another important factor that may explain the lack of consolidation. The factors that might be behind the declining valuations include low profitability, problematic business models, high costs, unresolved non-performing exposures, and/or market misperceptions or mispricing. Such declining valuations have not been observed in the USMCA region or the rest of the world and seem to be specific to the euro area.
Following the dynamic creation of fintech entities over the last decade, the euro area now hosts about a fifth of all such entities worldwide – quite a number of which are located in smaller, “tech-savvy” euro area countries. One of the most dynamic developments in the financial structure of major economies has been the growth of fintech companies – companies that use technological innovation, in particular information technology, to support or provide financial services. Given the absence of a specific statistical reporting framework for fintechs so far, information about them is relatively limited and unsystematic. Based on a new but still experimental dataset collected by the ECB, the report indicates that – following a sharp acceleration in the creation of fintechs in the euro area since the middle of the first decade of the millennium – the 2,800 fintech entities domiciled in the euro area in 2018 constituted more than a fifth of all fintech entities worldwide. While large euro area countries host most fintech entities, there are some small and “tech-savvy” countries with significant fintech representation relative to their population (e.g. Estonia, Finland, Ireland, Lithuania and Luxembourg).
Understanding the economic benefits and potential risks of fintechs would be facilitated by integrating them as a separate class into the international and European statistical classification systems for economic activities. Following the typology of the European Banking Authority, the experimental dataset reveals that most entities are involved in payment, clearing and settlement services or in credit, deposit-taking and capital-raising services. But there are also significant numbers of entities involved in investment services and management or in credit scoring, compliance services and other (not further classified) financial technology. In terms of ownership structure, the largest shareholder group tends to be from the financial and insurance sector and the second largest group from the information and communication sector. In terms of the location of shareholders, most of the fintech entities are domestically owned. In order to provide a sound basis for monitoring fintech developments, for assessing their benefits and risks and for analysing their implications for the main central bank functions, it is important that they are properly integrated into the international and European statistical classification systems for economic activities. Monitoring and assessment would be facilitated if fintech activities were to become a separate class.
Following the strong post-crisis reintegration trend in the euro area until 2015, mixed developments in overall financial integration since then have been characterised by substantial volatility in price convergence and the stalling of growth in cross-border investment. The more advanced financial integration across euro area countries is, the more one can talk about a single market for financial services and the more adequate it is to look at financial structure and development in the euro area as a whole. The two composite indicators of financial integration displayed in Chart 1.3, which are designed to approximate the overall picture of euro area financial integration by combining information from the most important financial markets, still suggest discrepancies between integration as reflected in cross-border price differentials (the price-based indicator in yellow) and integration as reflected in cross-border investment (the quantity-based indicator in blue). Following the financial and sovereign debt crises both strongly recovered until 2015. Thereafter, however, the price-based indicator showed sizeable fluctuations, with the latest reading being only slightly above the 2015 peak. This volatility resulted in particular from changing cross-border bond yield differentials, related to emerging and dissipating political uncertainties in various euro area countries among other factors. Despite the generally supportive effects on financial integration from the ECB’s expansionary monetary policy, the quantity-based composite indicator was held down since 2015 particularly by modest cross-border interbank lending, as the injection of excess reserves implied by unconventional monetary policy measures – as expected – reduced counterparties’ need for cash. The slight pick-up of the quantity-based indicator for the latest observation, bringing it to similar levels as seen in 2004 and 2015, was driven by recoveries in cross-border interbank lending and bond holdings. A related indicator on cross-border finance in the euro area published by the Association for Financial Markets in Europe, which is based on a broader set of market segments and thereby less influenced by a single component, shows, however, a more continuous post-crisis recovery also in terms of quantities.[9]
Chart 1.3
Price-based and quantity-based composite indicators of financial integration
(quarterly data; price-based indicator: Q1 1995 – Q3 2019; quantity-based indicator: Q1 1999 – Q2 2019)

Source: ECB and ECB calculations.
Notes: The price-based composite indicator aggregates ten indicators for money, bond, equity and retail banking markets, while the quantity-based composite indicator aggregates five indicators for the same market segments except retail banking. The indicators are bounded between zero (full fragmentation) and one (full integration). Increases in the indicators signal greater financial integration. From January 2018 onwards the behaviour of the price-based indicator may have changed due to the transition from EONIA to €STR interest rates in the money market component. OMT stands for Outright Monetary Transactions. For a detailed description of the indicators and their input data, see the Statistical Web Annex to this report and Hoffmann, P., Kremer, M. and Zaharia, S. (2019), “Financial integration in Europe through the lens of composite indicators”, Working Paper Series, No 2319, ECB, September.
Favourable financial integration developments have been observed in the last few years, particularly, in large-value payment relationships, specific collateral repo market rates and, very gradually, bank retail lending volumes, but have mostly not been seen in equity markets. This report also identifies some specific integration developments in different financial markets. New research applying network methodologies to TARGET2 data indicates that the number of payment relationships that banks in Europe maintain with other TARGET2 banks of the same national community has steadily decreased in the course of the last decade, while new payment relationships with TARGET2 banks of other national communities have increased. This suggests increasing cross-border integration in the large-value payments area. In the secured euro money market, the specialness of repo rates for specific types of government bond collateral has diminished over the last two years, as indicated by the narrowing of their yield spreads below the ECB’s deposit facility rate for countries like France, Germany, Italy, the Netherlands and Spain. At the same time, euro area cross-border bank retail lending increased, albeit rather gradually and from a relatively low level (see the blue line in panel (d) of Chart 1.4). Euro area equity returns and holdings across countries (see the blue line in panel (a) of Chart 1.4) no longer point to further increases in stock market integration and, by some measures, suggest incipient signs of re-fragmentation. This is in line with the slowing and less uniform economic recovery, as well as political uncertainties in some euro area countries.
When considering measures of home bias in euro area equity and bond fund holdings that do not distinguish between investor and fund domiciles, it is necessary to be careful not to underestimate quantity-based financial integration. Special Feature C directly links fund investors’ countries of origin with the origins of their fund-specific equity and bond holdings. The corresponding home bias measure is considerably lower than measures taking the fund’s domicile as the investment origin. This finding can be explained by the sizeable share of fund investments that euro area investors hold in financial centres (e.g. Ireland or Luxembourg). The funds in these centres tend to have more diversified portfolios than funds domiciled outside financial centres. Therefore, when considering home bias measures that do not fully account for investor origin, one has to be careful not to underestimate quantity-based integration.
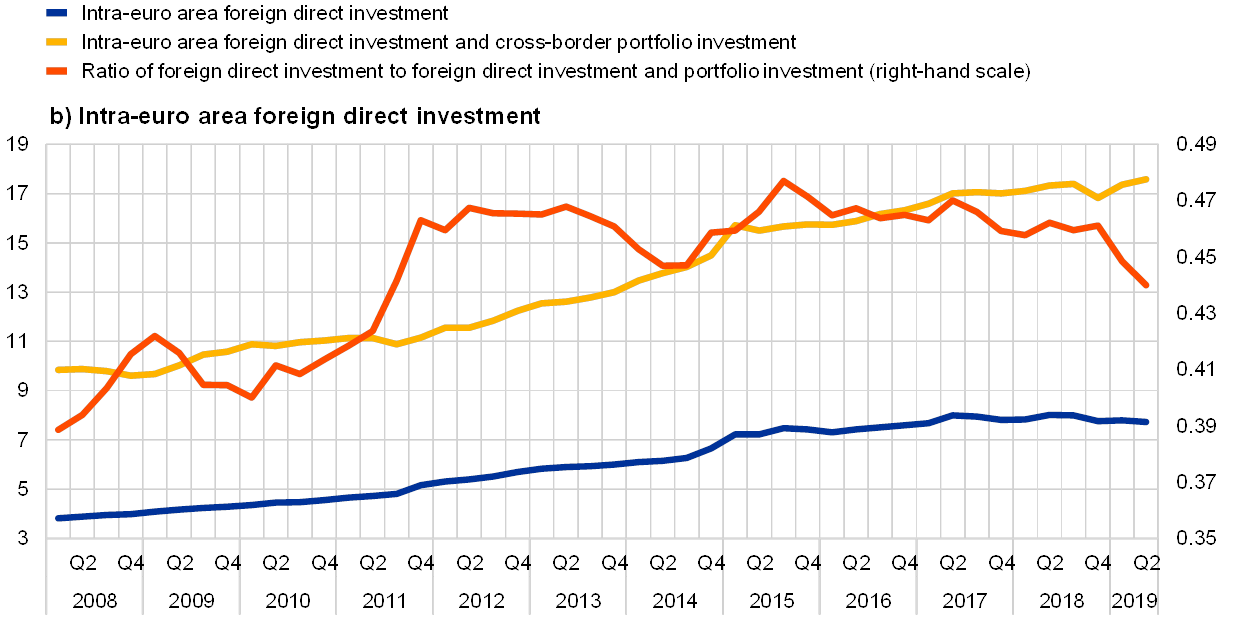
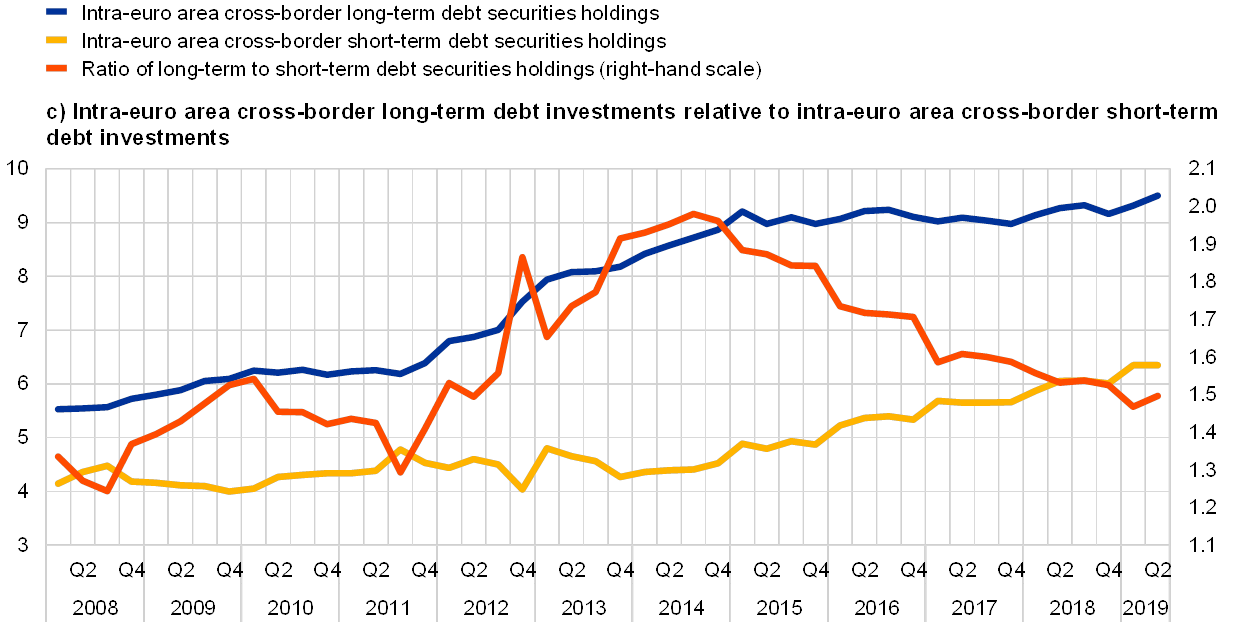
The significant post-crisis improvements in the resilience of euro area financial integration may have levelled out and it should be monitored that increasing cross-border short-term debt investments and decreasing cross-border foreign direct investment (FDI), if they continue, do not lead over time to pockets of vulnerability to shocks. Chart 1.4 shows the four indicators that the ECB monitors to assess the resilience of euro area financial integration (i.e. that the improvements in financial integration since the financial and sovereign debt crises do not unravel should severe shocks strike). For example, one type of vulnerability could emerge from over-proportionate shares of “runnable” instruments, such as interbank loans or short-term debt securities. First, panel (a) of Chart 1.4 may suggest that the ratio of cross-border equity investments to cross-border bond investments in the euro area peaked in 2017 and 2018. Second, panel (b) shows that FDI within the euro area as a share of cross-border direct investment and portfolio equity investment hovered around similar levels since 2011 and started to decline towards the end of 2018.[10] Third, panel (c) shows that since 2014 cross-border short-term debt investments have grown at a faster rate than cross-border long-term debt investments in the euro area. Fourth, panel (d) shows that during 2019 the rather gradual increase in cross-border retail bank lending in the euro area was more than offset by the recovery in cross-border interbank lending. While the reversals still tend to be rather small and, perhaps with the exception of short-term debt, not particularly protracted as yet, it seems advisable to continue monitoring developments in these resilience indicators.
Chart 1.4
Indicators of the resilience of financial integration in the euro area
(left-hand scale: EUR trillions; right-hand scale: ratio)
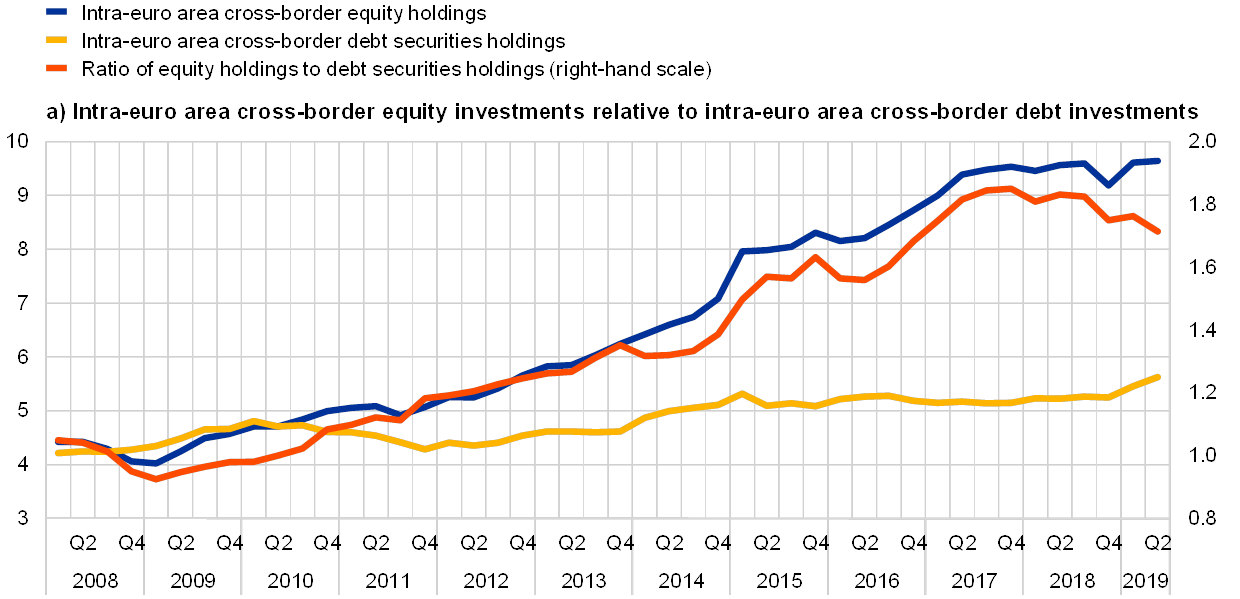
Sources: (a) ECB and ECB calculations; (b) ECB; (c) ECB, ECB calculation based on balance of payments data and Eurostat; (d) ECB.
Notes: (a) The blue line shows the total amount of equity holdings by euro area investors (all sectors) issued by residents of other euro area countries. The yellow line shows the total amount of debt securities holdings by euro area investors (all sectors) issued by residents of other euro area countries. The orange line shows the ratio of the two. For both equity and debt investments, the total refers to the sum of intra-euro area cross-border and domestic asset holdings. (b) The blue line shows the total amount of intra-euro area foreign direct investment. The yellow line shows the sum of intra-euro area foreign direct investment and intra-euro area cross-border portfolio investment. The orange line shows the ratio of the two. (c) The blue line shows the total amount of long-term debt (with a maturity of more than one year) issued by euro area countries and held by residents of other euro area countries. The yellow line shows the total amount of short-term debt (with a maturity of less than one year) issued by euro area countries and held by residents of other euro area countries. The orange line shows the ratio of the two. (d) The blue line shows the total amount of intra-euro area cross-border bank lending to households and NFCs, i.e. retail bank lending. The yellow line shows the total amount of intra-euro area cross-border lending between MFIs, i.e. interbank lending. The orange line shows the ratio of the two. For more discussion on the interpretation of these indicators, see Special Feature A “Financial integration and risk sharing in a monetary union” in the 2016 ECB report on “Financial integration in Europe”.
(left-hand scale: EUR trillions; right-hand scale: ratio)
(left-hand scale: EUR trillions; right-hand scale: ratio)
(left-hand scale: EUR trillions; right-hand scale: ratio)

2 Selected policy issues for financial structure and integration
A number of the features of and developments in euro area financial structure, development and integration mentioned above underline the importance of completing the European banking union and making further progress with the European capital markets union. Concerning CMU, the share of marketable financing instruments has not increased since the introduction of the euro. In particular, compared with other countries, there is scope to raise the share of public equity in total corporate financing. Furthermore, the euro area private equity markets should become a more dynamic source of risk capital, which would give rise to better growth opportunities for young and innovative companies. At the same time, the relatively strong growth of non-bank financial intermediaries suggests the need to contain transformed or new financial stability risks that may emerge and ensure a level playing field with banks. In order to maintain the resilience to shocks of the capital market integration achieved so far, it seems desirable that the slight declines in cross-border equity holdings and in FDI (to the extent that the latter was not a temporary effect of US multinationals repatriating foreign earnings) do not continue and that cross-border long-term debt investments resume to grow faster than short-term debt investments. Overall, the level of financial integration reached in the euro area is not satisfactory. For the effective functioning of the banking union, it would be good if the only very gradual increases of cross-border bank retail lending in the euro area continued and strengthened, enhancing the resilience of banking integration and increasing private credit risk sharing among euro area countries. These effects are much more likely to materialise with further cross-border bank consolidation among euro area countries. Therefore, obstacles to cross-border bank M&As should be addressed. In this regard and also more generally – including for financial stability purposes – further progress in completing the banking union is highly desirable.
The European Commission and the Economic and Financial Affairs Council of the EU (ECOFIN Council) have started initiatives to make a second set of measures to develop CMU following the 2015 Action Plan a priority for this legislative cycle. By the end of 2019, 11 out of 13 proposals included in the Commission’s CMU Action Plan announced in September 2015 had been adopted. As of January 2020, six of these legislative measures were already effective, with the remaining measures to gradually become effective up to mid-2022. While the adoption rate is relatively high, it also needs to be acknowledged that the ambition of some initiatives had to be lowered significantly in order to enable agreements among the European co-legislators. In the light of the above and other features of and developments in the EU financial system, various reports by policymakers and market participants have called for a second set of actions, partly reorienting CMU and taking it to the next level. Accordingly, the ECOFIN Council indicated its interest in putting CMU high on the political agenda and the Commission expressed its intention to make CMU a centrepiece of this legislative cycle. For example, the Commission has set up a High-Level Forum on capital markets union composed of experts from different industry sectors, which is working on proposals for concrete measures that could be included in the next CMU Action Plan. This work is currently focusing on how to create an ecosystem that enables more cross-border capital raising, how to develop a European capital market architecture and how to achieve greater retail investor participation, as well as on the related aspects of the transition to sustainable and digital economies.
The ECB strongly supports the new CMU initiatives, stressing for example the importance of further improving and harmonising insolvency frameworks and of further developing public and private equity markets in the EU. Given the benefits of more developed and integrated capital markets for the transmission of its monetary policy, for financial stability and for deepening EMU, the ECB strongly supports such efforts to further develop CMU. It stands ready to provide its views and advice on which policy measures would be most desirable. For example, already in the 2018 report on “Financial integration in Europe” the ECB emphasised the great importance of further improving and harmonising insolvency frameworks and of further developing public and private equity markets in the EU. Apart from generally fostering capital market integration and development, the key objectives of CMU should be to contribute to a wide choice and the stability of funding sources for households, firms and governments, to economic growth by supporting start-ups and promoting the scaling-up of young and innovative companies, and to more private financial risk sharing across euro area countries.
An emphasis on the further development of equity markets in the next set of CMU measures could, among other benefits, make an important contribution over time to de-carbonising EU economies. As illustrated in Chart 2.1 for 28 OECD countries, new ECB research suggests that economies with a financing structure more geared towards equity than bank credit or other debt have shrunk their carbon footprint by more over the last decades than other economies. This relationship is even more pronounced for private equity, such as venture capital or angel investments. It can be explained by two effects. First, equity markets are better at financing risky innovative companies, which are less rich in tangible assets, and energy-efficient sectors often have a larger share of such companies. By contrast, banks often lend against tangible collateral, which “brown” industries tend to possess to a larger extent than “green” industries. Second, equity investors are more immediately affected by litigation costs, and the lower probability of environmental damage implied by green industries diminishes the likelihood of such costs. A development programme for public and private equity markets could usefully complement ongoing initiatives to promote the issuance of green bonds. While changing the EU financial structure so that it comprises more equity will take time, overall it promises to be more effective in greening the economy than debt-based initiatives. It would also have many other benefits, related to boosting productivity and growth, enhancing private financial risk sharing and strengthening the resilience of financial integration.
Chart 2.1
Financial structure and carbon emissions
(y-axis: percentage change in country-specific carbon emissions per capita between 1990 and 2013; x-axis: total stock market capitalisation divided by the sum of total private credit and total stock market capitalisation, for each country, in 1990)

Sources: Data on carbon emissions (kilotons of CO2 per capita) are from the International Energy Association. Data on private credit and stock market capitalisation are from the World Bank Financial Structure Database.
Notes: “Financial structure in 1990” is defined as total stock market capitalisation divided by the sum of total private credit and total stock market capitalisation multiplied by 100, for each country, in 1990. The points in the chart are for 28 OECD countries.
The new economic and financial relationship between the United Kingdom (UK) and the EU27 after Brexit may lead to adjustments in the structure, development and integration of the EU’s financial system and the EU is prepared for all scenarios. Many EU27 companies use financial services currently provided from the City of London. Reliance on the UK is pronounced for capital market-related services, in particular derivatives clearing, various investment banking services such as securities issuance, M&A financing and syndicated lending, as well as securities and derivatives trading. Once the UK leaves the EU Single Market, the cross-border provision of services from the UK will be affected by supervisory and regulatory factors, such as decisions taken under the EU’s equivalence framework. Decisions on equivalence are the competence of the European Commission. Financial stability considerations, including financial stability risks related to the potential divergence of supervisory and regulatory frameworks, will be a key factor in them. The EU is prepared for all scenarios and, in the light of the current uncertainty regarding the future equivalence of the UK’s framework, the private sector must also continue to prepare for all possible developments after December 2020. Where the cross-border provision of services becomes no longer possible, UK-based financial service providers may have to relocate to the EU and/or the EU may have to deepen its domestic capacity, with implications for its financial structure and development.
Apart from regulatory factors, economic incentives for relocations between the UK and the EU27 and other private sector adjustments will depend, among other factors, on economies of scale and scope. For example, economies of scale in the clearing business provide strong incentives for concentration in a single location. Plans of London-based banks submitted to ECB Banking Supervision, as well as other intermediaries’ plans, suggest that some financial groups may relocate different types of activities to a number of Member States. This seems to indicate that “ecosystem” effects may be more important than economies of scope. If confirmed, the trend could enhance the multi-centricity of the euro area/EU27 financial system.
It is important that the new CMU initiatives currently under preparation facilitate the necessary adjustments in the EU financial sector to Brexit. Should the multi-centricity of the EU financial system become more prominent, it will be increasingly important to maintain the fluidity of financial activities between different EU financial centres, avoiding any fragmentation tendencies between them, in line with the integration goal of CMU. The EU should also deepen domestic capacity in the equity space. Euro area NFCs extensively rely for equity issuance on global banks, which largely serve the Single Market from London (see Chart 2.2). For services that will continue to be provided from London, relevant third country frameworks should be sufficiently uniform across EU countries. Regulatory and supervisory coherence is paramount to ensure level playing fields and avoid regulatory arbitrage. Future policy initiatives, notably the envisaged new set of CMU measures, should take such needs to adapt to Brexit into account in a forward-looking manner.
Chart 2.2
Euro area NFCs’ equity issuance via global investment banks
(left-hand scale: number of deals; right-hand scale: percentage shares)
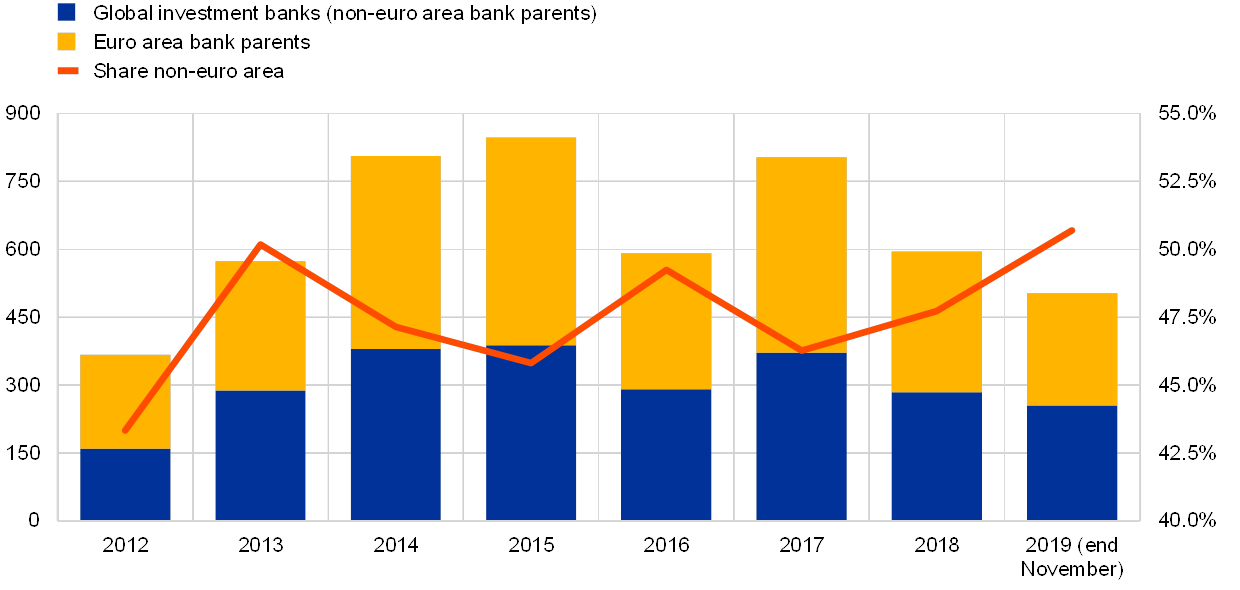
Source: Dealogic.
Notes: Banks involved in deals as manager, co-manager, bookrunner, participant or underwriter are categorised as “euro area” or “global”, depending on the location of the parent. Prior to Brexit, global banks typically accessed the market from London. The bars reflect the number of deals participated in by individual banks. As many banks typically participate in a single deal, this may entail some double-counting of deals on the left-hand scale. The orange line is the ratio between the blue and yellow bars and can be taken as a proxy of the relevance of global banks for the euro area market.
The introduction of an adequately designed common sovereign safe asset could have important benefits for financial stability, integration and development in the euro area. The euro area financial structure currently lacks a common sovereign safe asset. Such a security would develop the financial system by introducing an additional financial instrument with risk/return characteristics that are different from those of existing assets, notably with low risk that is not directly related to a single sovereign. Moreover, such a debt security could be an important ingredient for developing a proper euro area term structure, a key feature of highly developed capital markets based on which many other financial instruments would be priced. Both of these benefits have natural implications for financial integration, not only for the cross-country convergence of asset prices and interest rates, but also for investor diversification beyond domestic assets. But one of the most emphasised effects of a well-designed euro area sovereign safe asset is the potential benefit for financial stability. Notably, significant home biases in banks’ government bond holdings leave important channels of the sovereign-bank nexus still intact, despite major progress with the first two pillars of the banking union. The option to diversify sovereign holdings by also investing in a common safe asset would reduce the scope for direct losses from national fiscal sustainability issues. Furthermore, reducing the relevance of national sovereign benchmark bonds could weaken the link between debt sustainability of the domestic sovereign and bank funding costs (including via high-quality liquid collateral for repurchase agreements). Moreover, as both a common safe asset and changes to the regulatory treatment of banks’ sovereign exposures are part of the European policy debate, indicative simulations in Box 1 of Special Feature B suggest that combining regulatory sovereign concentration charges (i.e. higher capital requirements for banks with more concentrated sovereign debt portfolios) with a safe asset could facilitate the reduction of the home bias, imply a smaller need for reshuffling sovereign holdings above the concentration threshold, and could avoid potential increases in the volatility of banks’ sovereign bond portfolios. While introducing a common safe asset and changing the regulatory treatment of sovereign exposures could be two mutually supporting elements of EMU deepening, discussions on these possible measures should be viewed in the broader context of completing the banking and capital markets unions, which includes the ongoing policy debate on a European deposit insurance scheme.
Such a common sovereign safe asset would also pose multiple challenges, as expressed by some market participants. First, depending on the design, the creation of a common safe asset could have a negative impact on national bond markets. For example, likely the issuance sizes of traditional government bonds could become smaller, which would have a negative impact on their liquidity. Second, in relation to this, the likelihood of finding sufficient buyers in the market for any subordinated debt instruments, which are crucial for the credit quality of any common safe asset, might be low, as the investor base for such products is likely to be smaller than for traditional government bonds. In this regard, specific attention to the proportionate treatment of risks for the common safe asset and the remaining sovereign debt is needed in bank regulation. Third, the sizeable rating dispersion across euro area sovereign debt instruments may complicate the process of creating a common safe asset backed by sovereigns. These points need to be carefully considered.
To reap the intended benefits, a common euro area sovereign safe asset should combine a number of features related to its credit quality, size, incentive effects and alignment with the regulatory and market environment. A common safe asset should have a very high credit quality and be resilient to country-specific as well as more widespread sovereign shocks in the euro area. It should also be designed in such a way that it maintains incentives for sound national fiscal policies. Moreover, the safe asset should be compatible with both regulatory and market standards and meet the collateral eligibility criteria for the ECB’s liquidity operations. Another priority is that the remaining national public debt markets continue to function well. Some asset designs fulfilling these criteria would have the potential to extend the benefit of low sovereign funding costs to a larger set of issuers than is presently the case. The volume of the asset created should also be of a sufficient size, so that the market develops enough liquidity and brings meaningful improvements in financial integration, development and stability. All in all, a well-designed common sovereign safe asset could be a supportive element for the banking and capital markets unions and could therefore contribute to the deepening of EMU. At the same time, the current debate about different safe asset designs illustrates the challenges in fulfilling all the desirable criteria to the same extent.
Structural developments in the euro area financial system
The financial system comprises various agents, financial intermediaries and financial instruments which serve to fulfil the financing requirements of the euro area economy. Such agents include households, non-financial corporations (NFCs) and national governments, while the financial intermediaries include monetary financial institutions (MFIs), Insurance Corporations and Pension Funds (ICPFs), and other financial corporations including non-money market fund investment funds, other financial intermediaries and financial auxiliaries, as well as captive financial institutions and money lenders. The financial instruments include loans, bonds and equities. This section looks at the developments in these elements of the financial system, as well as their integration across the euro area.[11] The main findings emerging from this section can be summarised as follows.
In terms of international comparison, the euro area economy’s financing requirements reached 5.8 times nominal GDP at the end of 2018 – a level similar to the US economy and significantly lower than the Japanese economy. While the requirements are predominantly met through debt and non-marketable financing instruments, their funding also includes a component of financing via listed shares that is significantly smaller than in either the United States or Japan.
The relative weight of different financial intermediaries has changed in recent years. The relative role of MFIs, or more specifically credit institutions, compared to other financial intermediaries has declined since the global financial crisis. Up to the end of 2014 MFIs were still the largest financial sector. Non-credit institutions have gradually been playing a more important role, with the investment funds sector in particular channelling increased amounts of debt and equity financing to the euro area economy. Since 2015 non-money market fund investment funds, financial vehicle corporations and other financial entities together have represented the largest financial sub-sector.
This section begins by analysing the financing of the euro area economy by size and type of instrument, which points to two major developments over the last three years:
- the assets of non-bank financial intermediaries have surpassed in size the euro area banking sector’s assets.[12] This is the result of relatively slower growth in bank assets, further consolidation and concentration in the banking sector, the strong expansion of the Eurosystem’s balance sheet, and increased reliance on market-based intermediation;
- the ratio of financial sector assets to GDP has been contracting at the euro area level since 2015, masking heterogeneity in national developments.
When looking at overall financial integration, both dimensions – i.e. price convergence across the euro area and quantity-based integration via cross-border activities – were hit by the global financial crisis and the subsequent “double dip” in the economy. They have recovered some ground since, thanks to non-standard monetary policy measures (NSMs), reforms of Economic and Monetary Union (EMU), and macroeconomic adjustment programmes. Yet this process has stalled in since 2015, while the two dimensions exhibit some discrepancies. On balance, progress in financial integration within the euro area – based on combining a broad range of price-based and quantity-based indicators – has not been very satisfactory in recent years.
Concerning risk sharing, which should reflect both financial integration and resilience, it has risen slightly in recent years, but is modest overall across the various channels in the euro area. Not all risk-sharing channels are operating at their capacity, and some are not even contributing at all due to a reversal of cross-border banking flows. Thus, there may be potential for improved risk sharing through better integrated capital markets.
Concerning integration across market segments, a mixed picture emerges. The unsecured and secured segments of the money markets have not responded in quite the same way to an environment characterised by excess liquidity. The integration of retail banking markets is characterised by contrasting developments. Bank retail lending volumes grew across all countries and the share of cross-border intra-euro area loans rose somewhat over the review period. The dispersion of MFI interest on new loans to households is more nuanced. Euro area equity market returns across countries no longer point to a further increase in stock market integration. Meanwhile, cross-border holdings point to a slight increase in fragmentation – also due to political uncertainties in some euro area countries.
This section proceeds by first analysing the euro area financing requirements by size and type of financing instrument (Section 1.1) to understand the demand that the euro area financial sector is expected to meet. Subsequently the section illustrates in more detail how those financing requirements developed over time for the household, NFC and general government sectors (Section 1.2). This analysis provides insights into the evolving liabilities in euro area financial markets. The composition of markets in debt and equity instruments where those seeking and providing financing meet and trade is then presented (Section 2). These markets provide the link to the different types of financial intermediary that channel savings to sectors with borrowing needs. Section 3 reviews structural developments in key sub-groups of these three types of financial intermediaries. The section then turns to the analysis of the recent developments in financial integration (Section 4) by first looking at the price, quantity and quality of integration at the aggregate euro area level (Section 4.1) before looking in more detail at developments in credit markets (Section 4.2) and securities markets (Section 4.3).
1 Liabilities of euro area economic agents
This section characterises the type of instruments used to meet euro area resident economic agents' financing needs and compares them to their equivalents in the United States and Japan. Economic agents incur different types of liabilities depending on the institutional sector[13] they belong to. The aggregate liabilities determine the demand that the euro area financial system should cater for and that is analysed in Section 2.
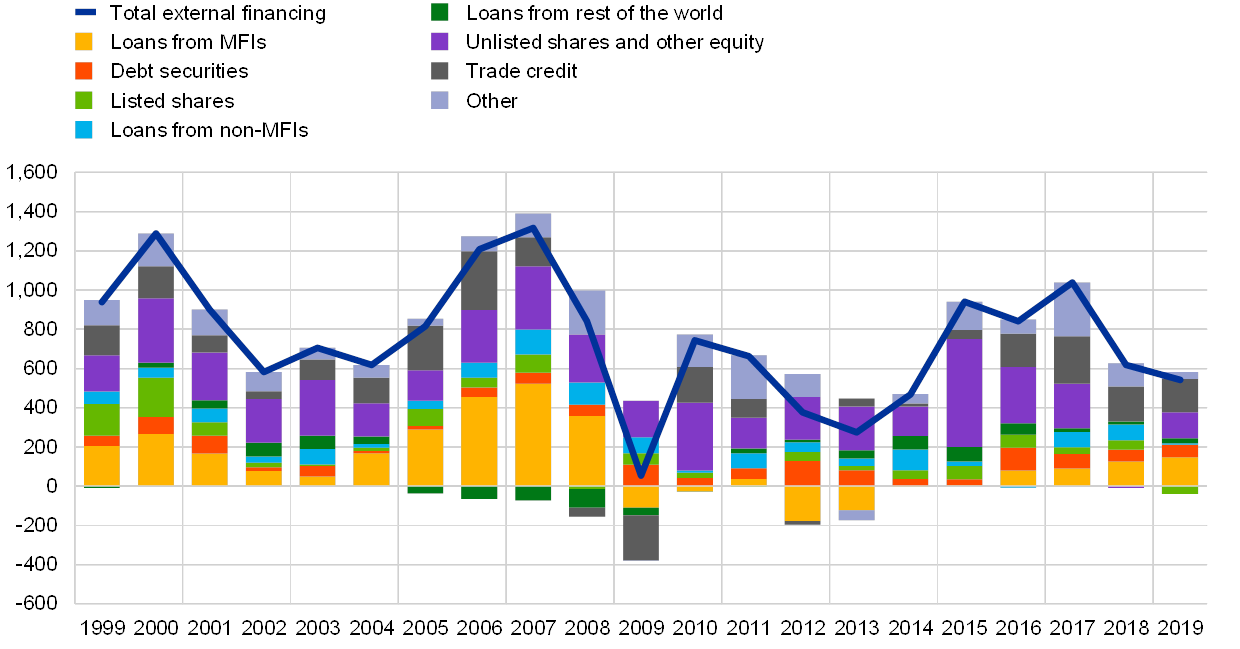
At the end of 2018, the euro area economy required total financing amounting to EUR 66.6 trillion or 5.8 times nominal GDP (Chart 1 – Section a). Such aggregate financing represented 66% of total[14] (unconsolidated) euro area domestic financial liabilities.[15] Euro area economic agents sourced this financing in the form of debt instruments – loans and trade credits as well as debt securities – and equity instruments – including listed and unlisted shares as well as other types of equity.[16]
The financing of the euro area economy has increased by EUR 1.1 trillion from 2016 to 2018[17]
Chart 1
Financing of the euro area, US and Japanese economies
(ratio to nominal GDP (left-panels); percentages (right-panels); annual data: 1999‑2018)
Sources: ECB for euro area and OECD for United States and Japan.
Notes: The chart is constructed from the liabilities of all economic sectors, excluding liabilities to the rest of the world, loans from NFCs (to net out intra-company loans in this non-consolidated data), currency and deposits, investment fund shares or units, entitlements from pension, insurance and standardised guarantee schemes, financial derivatives and employee stock options as well as other accounts payable. Other equity refers to equity claims that are not securities listed on an exchange and not unlisted securities, such as equity in incorporated partnerships, equity in limited liability companies whose owners are partners, capital invested in cooperative societies or investment by the government in the capital of public corporations whose capital is not divided into shares. Data for the US and Japan are based on the global System of National Accounts (SNA) 2008. The ESA 2010 underlying the euro area data are broadly consistent with the SNA 2008, although in some cases it may be more detailed.
1.1 By type of financial instrument
The financing of the euro area economy is still predominantly debt-based, despite a steady decline in the share of debt securities instruments. The share of debt financing declined from a peak of 73.6% in 2011 to 68.4% in 2018. Nearly 55% of debt financing consists in loans, 38% in debt securities and 7% in trade credits.
General government has issued the largest stock of debt securities outstanding, representing half of the debt securities in the euro area economy. Credit institution liabilities in the form of debt securities represented 6% of total external financing. This share has nearly halved since its peak in 2008 reflecting an advancing but slow process of euro area banking sector consolidation and concentration (see Section 3.1). It also reflects robust deposit growth and notable financing through the Eurosystem, thus reducing the need for debt securities issuance as well as dependency on interbank lending.
Despite gradually increasing from 27% in 2008 to 32% in 2018, equity financing is still well below the 36% share in external financing it had at the start of EMU. Looking ahead, a more significant role of equity financing of the euro area economy would have beneficial implications including diversifying funding sources, increasing financial resilience (see Section 4), and supporting a faster reduction in the carbon footprint of the economy (see Box 1).
Listed shares – a marketable and hence more easily tradable financial instrument – have seen their role in the mix of equity instruments diminish strongly since 1999 as they are increasingly supplanted by unlisted shares (i.e. equity securities not listed on an exchange). The proportion of listed shares has fallen from 46% to 19% whereas that of unlisted shares has increased from 42% to 58%.
The significant decline in the share of marketable instrument-based financing since the start of EMU has stabilised recently (at 32%). However, this masks significant heterogeneity in developments across Member States (Chart 2). Marketable financial instruments benefit from a broader investor base and – subject to an adequate prudential framework – provide economic agents with a more diverse and resilient funding pool. Therefore, from a financial stability perspective, it is desirable for these instruments to play a larger role in the external financing of euro area Member States. Unfortunately, the share of these instruments remains markedly low, especially the share in the NFC financing mix (19%). Furthermore, we note a downward trend for the overall share of these instruments since 1999, echoing the increasing role of unlisted shares, as indicated in Chart 1. Finally, the downward trend comes with a time-varying distribution across the euro area countries. The current width of the distribution – narrower than during the recent crisis, but broader than at the start of the period – translates into a heterogeneous situation across the various Member States.
The major role of loans in external financing, and the dominance of unlisted shares in equity financing (58%), reflect the high share of small and medium-sized enterprises (SMEs) in the euro area economy.
Chart 2
Marketable proportion of external funding among euro area countries
(ratio; annual data: 1999‑2018)
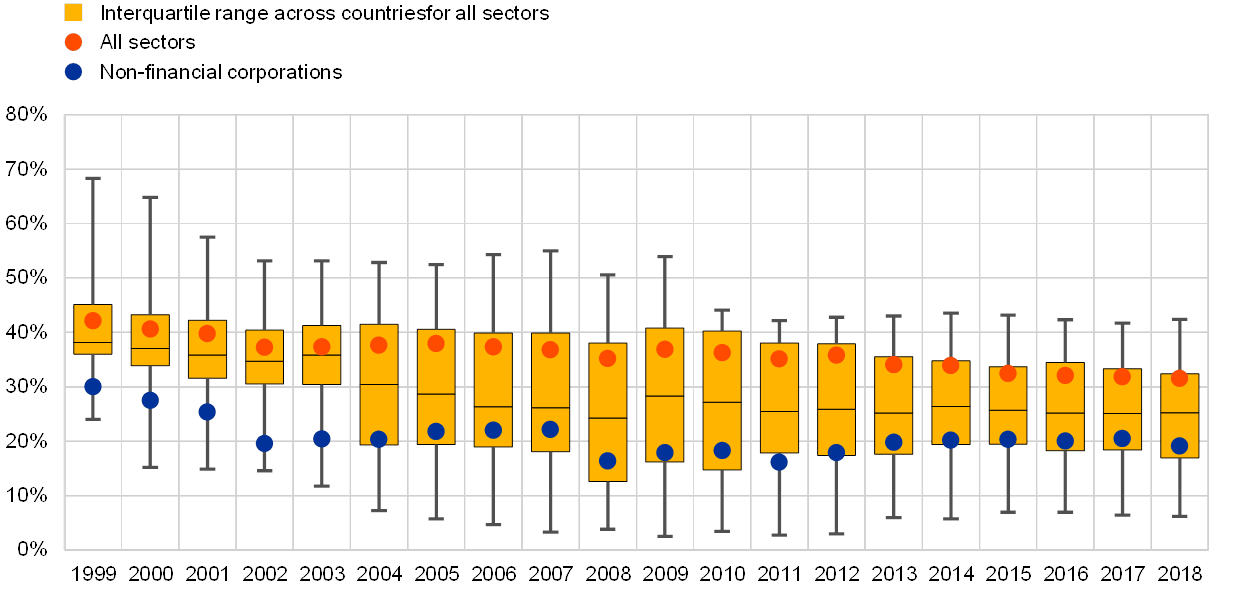
Source: ECB.
Notes: The marketable part of a euro area country’s capital market is defined as the total debt securities and listed shares over total loans (adjusted for intra-company loans), trade credits, debt securities and equity (including listed and unlisted shares as well as other equity). For the years 1999‑2003, the plot is based on only 12 countries (specifically, it excludes Cyprus, Estonia, Malta, Lithuania, Latvia, Slovakia and Slovenia).
A comparison with the financing structures of the US and Japanese economies highlights the following differences:
- At a comparable level in terms of ratio to GDP (5.7), the US economy’s external financing was more equity-based (39%) and marketable instrument-based (52%) (Chart 1 – Section b). It relied less on loans (24%) and featured a larger stock of public sector debt securities (18%). Equity financing was based 51% on listed shares, 8% on unlisted shares and notably 41% on other equity financing instruments.[18] [19]
- While significantly larger in size (7.8 times GDP), Japanese external financing needs featured a stronger debt basis as a consequence of the high public sector indebtedness (Chart 1 – Section c). Moreover, it relied almost equally on marketable financial instruments in general with a significant share of listed share equity financing (16%).
- The marginal role of debt issuances by US and Japanese credit institutions – commonly operating as subsidiaries of larger bank holding companies or financial groups – masks the fact that parent entities – classified as other financial intermediaries (OFIs) – issue debt securities to meet financing requirements and subsequently channel the funding received to the credit institutions via intra-company loans.
Box 1
Does financial structure affect the carbon footprint of the economy? [20]
The recent interest in the ability of green-finance initiatives to fund the decarbonisation of the global economy has laid bare our limited understanding of the link between traditional finance and environmental degradation. Are expanding financial markets detrimental to the environment because they fuel economic growth and the concomitant emission of pollutants, or do they steer economies towards sustainable growth by favouring “green” sectors over “brown” ones? And do credit markets and equity markets have a similar impact on the environment, or does it make economic sense to stimulate one segment of the financial system at the expense of the other in order to contribute to meeting high-level commitments on limiting global warming?[21] These important issues seem to be missing in the current policy discussion about how to de-carbonise advanced economies.[22]
Analysis of data on aggregate carbon emissions and financial structure reveals that the carbon footprint of the economy shrinks faster in economies that receive relatively more of their funding from equity investors than from banks. Chart A illustrates this result: during the quarter-century after 1990, per capita carbon emissions declined more in countries where stock markets were relatively larger in 1990. The statistical relationship between financial structure and carbon emissions is observed while holding the level of economic development, financial development, and environmental regulation constant, and when using policies promoting financial market deregulation and liberalisation as instruments for financial development and improving financial structure. It is also economically meaningful: lifting all countries to a ratio of total stock market capitalisation to the sum of total private credit and total stock market capitalisation of one-half (from a global mean of one-third) would result in an 11.5% reduction in global per capita carbon emissions.[23]
The aggregate effect is explained by two separate mechanisms at the sector level: relatively faster output growth in “green” sectors, and relatively faster declines in emissions per output in carbon-intensive sectors, in countries with deeper equity markets. The former mechanism is similar to one in which financial markets speed up the reallocation of productive resources towards sectors with better growth opportunities.[24] The latter mechanism is related to the ability of financial markets to finance the development and adoption of new technologies which increase within-sector productivity. Unlike most previous research, however, the evidence here suggests that one type of investment (equity) is superior to another (credit) in achieving both goals, i.e. growth in “green” sectors and technological progress in “brown” sectors, at least in the context of the economy’s carbon footprint.
Also strengthening the link between equity markets and green innovation is the fact that deeper stock markets are associated with more green patenting in traditionally carbon-intensive sectors. This is especially the case for patented inventions whose goal is to increase the energy efficiency of the production process. This mechanism is further strengthened when the analysis takes into consideration private equity investments, such as venture capital and angel investments, which are particularly effective in financing early-stage innovation.[25] Importantly, while some of the reduction in domestic carbon emissions is offset by those embedded in the production of imported goods, the “domestic-greening” effect dominates the “carbon-import” effect by a factor of ten.[26]
Firm-level evidence also supports the idea that higher equity investment is associated with faster decarbonisation. In 2006 Belgium introduced a notional interest deduction for corporate equity, in order to reduce the tax advantage of issuing debt. This policy shock provides an arguably exogenous source of variation in the cost of equity financing. Matched data from Orbis and from the European Emissions Trading System suggest that the reform caused Belgian non-financial firms to increase their equity ratio by about 5%, an adjustment similar to that of Belgian banks.[27] Subsequently, these same firms reduced the carbon intensity of their production, also in comparison to similar firms in the same sector in neighbouring countries (such as the Netherlands).
Chart A
Financial structure and carbon emissions
(y-axis: percentage change in country-specific carbon emissions per capita between 1990 and 2013; x-axis: total stock market capitalisation divided by the sum of total private credit and total stock market capitalisation, for each country, in 1990)
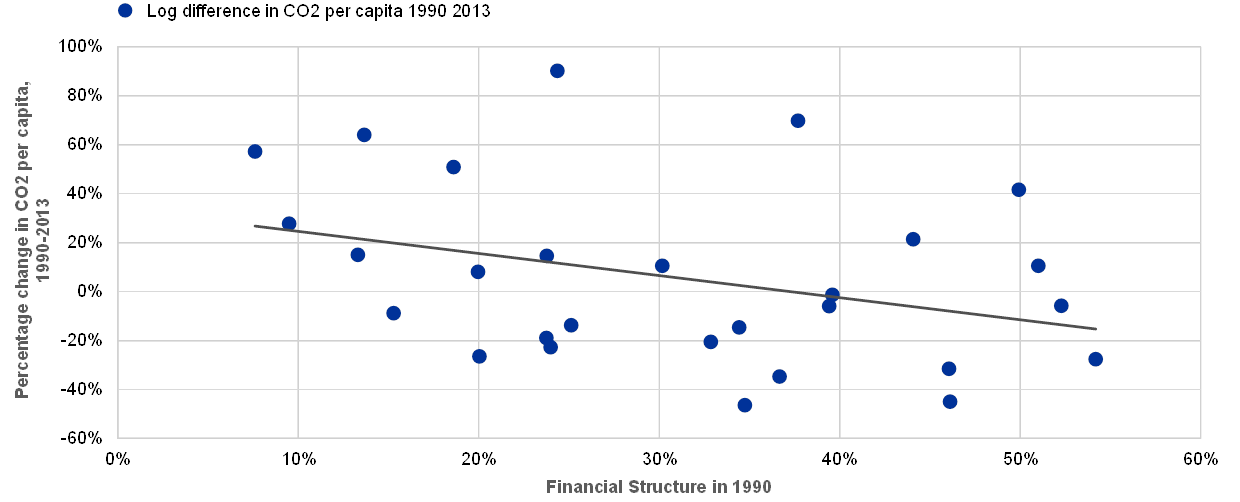
Notes: “Financial structure in 1990” is defined as total stock market capitalisation divided by the sum of total private credit and total stock market capitalisation, for each country, in 1990. Data on carbon emissions (kilotons of CO2 per capita) from the International Energy Agency. Data on private credit and stock market capitalisation from the Financial Structure Database.
The superiority of equity financing to debt financing in decarbonising the economy appears to stem largely from equity investors’ propensity to fund intangible projects and their higher aversion to litigation risk. Relative to carbon-intensive sectors, energy-efficient sectors tend to be more innovative and less rich in tangible assets. Innovative, R&D intensive sectors typically grow faster in countries with deeper stock markets. In contrast, sectors rich in tangible assets (which also happen to be more carbon-intensive) expand faster in economies that rely more on bank financing, for example because banks often take less risk and therefore tend to lend against tangible collateral.[28] Second, equity investors see green firms as less likely to suffer environmental disasters, and therefore less likely to be involved in litigation.[29] Thus, the technological “greening” of carbon-intensive sectors as stock markets develop is, to a large degree, explained by equity investors pushing such sectors to develop and adopt greener technologies in an attempt to reduce future litigation costs.
The evidence provided in this box illustrates the challenges implied in limiting the financing of the carbon transition in Europe to bank or debt-based initiatives, and instead suggests a strong emphasis on equity-based initiatives. A number of such initiatives can be embedded in a push to give a stronger equity dimension to the European Capital Markets Union (CMU) project, tapping the European capital markets’ potential to fund innovative, sustainable growth. One specific measure that is crucial in this regard is reducing or eliminating any tax benefits that favour debt over equity. The European Commission has already adopted a proposal on a common corporate tax base which will address the current debt-bias in corporate taxation by introducing an “Allowance for Growth and Investment” that will give companies tax benefits for equity equivalent to those they receive for debt.[30] Other initiatives already on the table that will arguably stimulate equity investment include measures to support the development of venture capital markets, and improving and harmonising insolvency regimes, among others.[31]
In parallel, countries should take measures to counterbalance the tendency of credit markets to finance relatively carbon-intensive sectors and firms. For example, banks can be asked to release information about the environmental performance of the firms they fund. Furthermore, countries can adopt green credit guidelines to encourage banks to improve their environmental performance and to lend more to firms that are part of the low-carbon economy.
Finally, a number of initiatives can be implemented to support the budding market for green bonds, such as improving risk-return profiles, boosting demand, introducing tax incentives, and enabling strategic issuance.[32] Practically non-existent a decade ago, green bonds (i.e. bonds issued by private or public entities and earmarked to be used for climate and environmental projects) have rapidly emerged as a popular way to finance the greening of the economy. Their global issuance stood at $255 bn in 2019, with the EU being the biggest issuer of green bonds in the world ($107 bn), ahead of the United States ($51 bn) and China ($30 bn). While the analysis of their effectiveness is constrained by the short historical window of their existence, recent evidence suggests that green bond issuance does not just improve companies’ value and performance, but also weakly stimulates patented innovation.[33] At the same time, green bonds are typically issued by large listed companies which tend to be much less constrained than smaller companies in their ability to invest in R&D, a fact that puts their usefulness in funding green innovation in question. In contrast, equity investors such as venture capitalists typically fund financially constrained young innovative companies seeking to place a radically new technology in the market. For this reason, measures aimed at stimulating equity investment in Europe are plausibly associated with higher benefits for climate mitigating technologies than measures supporting the market for green bonds.
1.2 By economic sector
The three main euro area economic sectors – households, non-financial corporations (NFCs) and the general government – have distinct funding structures. The following sections examine the evolution of the use of financial instruments by each sector as well as the main funding sources.
1.2.1 Euro area households
Euro area households finance themselves principally through loans from MFIs, (Chart 3). The presence of the non-banking sector is still limited in this segment of the market. OFI loans consist mainly of securitised loans originated by MFIs. The shares of bank and OFI loans in total loans to euro area households have remained practically unchanged over the past ten years.
The main reason households have recourse to MFI loans for financing is to purchase houses (75% of MFI loans) with the remaining share being equally distributed between consumer credit and loans for other purposes (Chart 4).
Chart 3
Loans to households and the economic sector providing the financing
(EUR trillions (left-hand scale); percentages (right-hand scale); annual data; 1999‑2019)
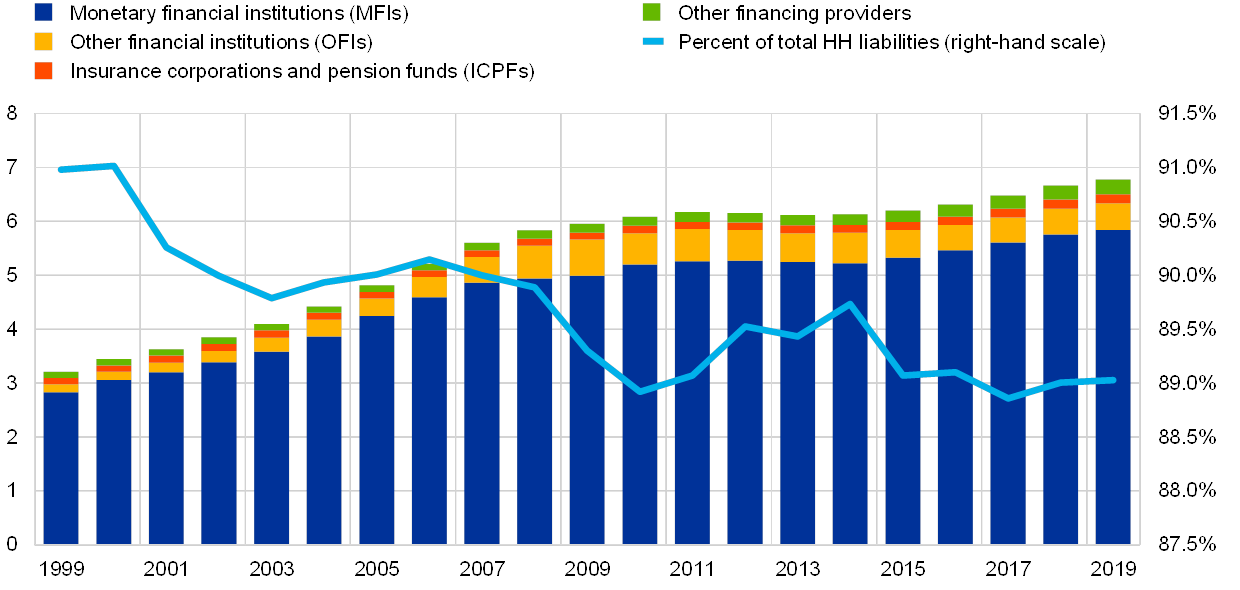
Source: ECB.
Notes: OFIs include other financial intermediaries (except insurance corporations and pension funds), financial auxiliaries as well as captive financial institutions and money lenders. OFI loans consist mainly in securitised loans originated by MFIs. 2019 data refer to end Q3 2019 data.
Chart 4
Composition of outstanding MFI loans to households by lending purpose
(percentages; annual data; 1999‑2019)
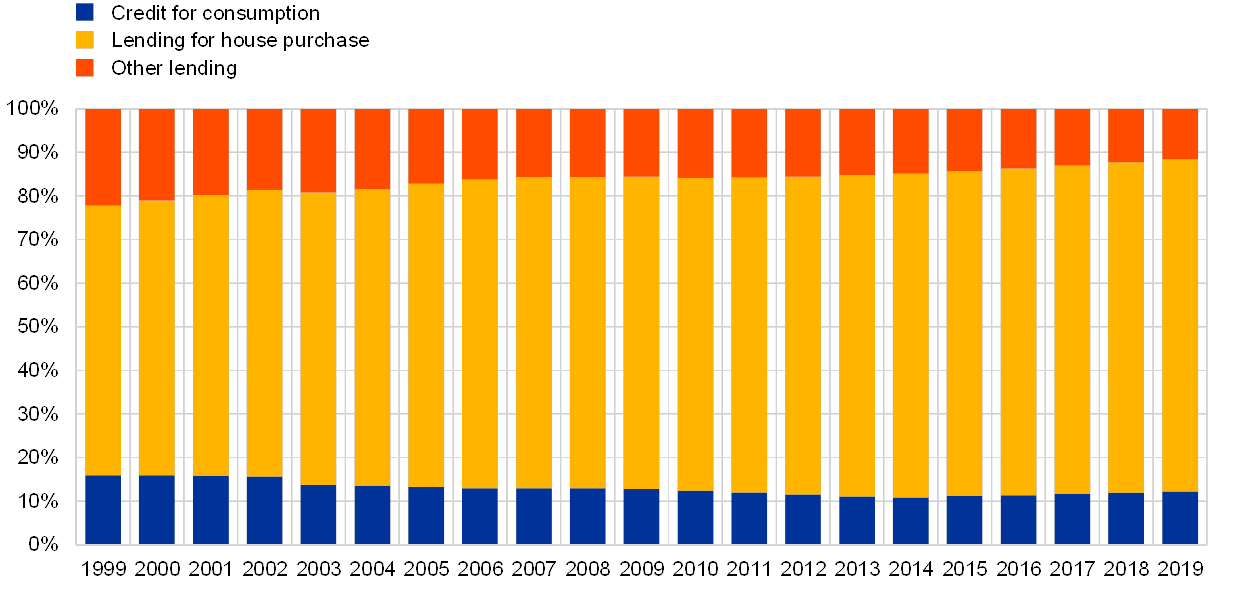
Source: ECB.
Notes: Loans consist of: (1) loans granted to households in the form of credit for consumption, i.e. loans granted primarily for the purpose of personal use in the consumption of goods and services; (2) lending for house purchase, i.e. credit extended for the purpose of investing in houses for own use or rental, including building and refurbishments; and (3) other, i.e. loans granted for purposes other than consumption and house purchase, such as business, debt consolidation, education, etc. (see Guideline ECB/2014/15).
1.2.2 Euro area NFCs
Euro area NFCs have relied principally on loans and unlisted shares for their financing over the last 20 years (Chart 5). These two funding sources currently represent around 60% of NFCs’ total non-consolidated liabilities. The observed low NFC reliance on market-based finance relative to other major international economies is partly due to the larger share of small and medium enterprises (SMEs) in the euro area.
Equity financing has provided the backbone of euro area NFC financing since 1999. In terms of stocks, equity financing (i.e. listed and unlisted shares and other equity issued by NFCs) represented 53.9% of NFC external financing in 2007, which was 4.5 percentage points higher than in 2003. At that time, this increase was supported by substantial positive valuation effects on the equity issued, reflecting the marked stock price increases, and by the high level of mergers and acquisitions (M&A) witnessed during that boom period. Thereafter, between 2007 and 2011, the share of equity in external financing declined significantly, following the global financial crisis and the euro area crisis as well as the ensuing marked drop in stock prices. Thereafter, it recovered and increased to stand at 55.3% in mid‑2019, mirroring the gradual recovery of the economy and a considerable increase in stock prices.[34]
A notable phenomenon is that since 2007 NFCs have gradually diversified their funding structure towards a combination of loan and market-based debt and equity financing (Chart 6). From a stock perspective, bank loans formed 63% of NFC debt financing in 2007, which was 5.7 percentage points higher than in 2003. Borrowing from banks was buttressed over this period by robust economic growth, construction and real estate booms and very favourable bank lending conditions in a number of euro area countries. Post‑2007 the share of bank loans in NFC debt financing has followed a declining trend. In mid‑2019, bank loans accounted for 46.3% of debt financing, while the share of financing through debt securities, loans from OFIs and from the rest of the world increased to 50.5%. Changes in the financing structure of large enterprises drove the decline in the share of bank loans, as these large enterprises increasingly reverted to capital markets for direct debt securities financing and to other financial institutions (OFIs) for indirect debt securities and loan financing. By contrast, small and medium-sized enterprises (SMEs), the backbone of the euro area economy, also reduced their reliance on bank credit.
Trade credits have traditionally played an important role in the financing structure of euro area NFCs and now represent close to 10% of euro area NFC liabilities.
Chart 5
Composition of NFC liabilities by type of financial instrument
(EUR trillions (left-hand scale); percentages (right-hand scale); annual data; 1999‑2019)
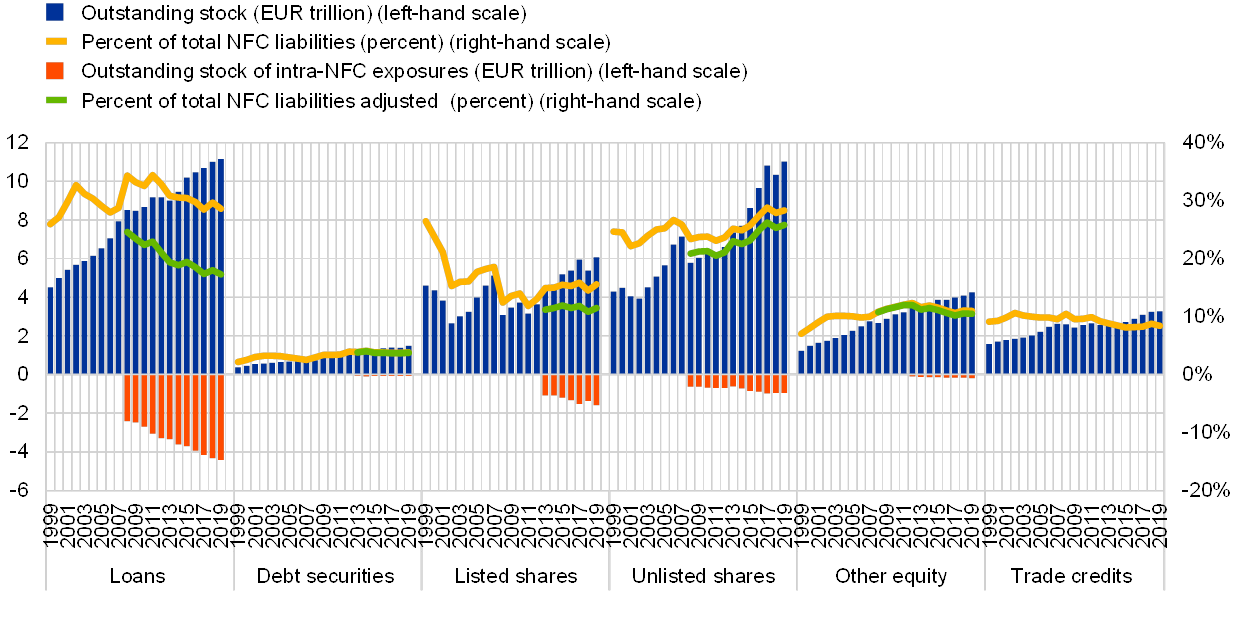
Sources: ECB and ECB calculations.
Notes: The outstanding stock of intra-NFC exposures is estimated based on financial accounts and balance of payments data. This explains the fact that a significant part of non-investment fund and non-FVC OFI loans are related to debt securities issued indirectly via NFC financing conduits. 2019 data refer to end Q3 2019 data.
Chart 6
External financing of euro area NFCs by instrument
(annual flows; EUR billions; 1999‑2019)
Sources: ECB (euro area accounts) and ECB calculations.
Notes: Non-MFIs include other financial institutions (OFIs) as well as insurance corporations and pension funds (ICPFs). "Other" is the difference between the total and the instruments included in the chart, and includes inter-company loans and the rebalancing between non-financial and financial accounts data. 2019 data refer to end Q3 2019 data.
NFCs have sourced their financing from different financial intermediaries or economic sectors. The role of the different financing providers via loans, debt securities and listed shares is characterised as follows (Chart 7):
- Intra-NFC financing is substantial. NFCs rely for approximately 13% of financing on other NFCs. One-quarter of euro area NFC listed shares are owned by other euro area NFCs and 32% of loans are inter-company (often intra-company) loans. The outstanding stock of intra-NFC exposures in Chart 5 provides an estimate for the broader relevance of inter-company exposures.
- MFIs remain an essential provider of debt financing to euro area NFCs. Since 2013 the role of MFIs in the stock of debt financing has declined by 5 percentage points to 36% and the composition of debt financing has shifted towards marketable instruments.
- The ICPF and investment fund (IF) sectors each finance around 27% of NFC debt issuance. IFs moreover provide around 17% of equity financing through listed shares. The ICPF sector has increased its portfolio allocation to IFs over recent years (see Section 3.2.1) and hence also contributes to NFC equity financing indirectly.
- The rest of the world holds close to 10% of NFC liabilities.
This characterisation is incomplete as suppliers of financing in the form of unlisted shares – the biggest component in euro area NFC funding structures – cannot currently be identified due to the limitations of the statistical data. This is an area in which further work is ongoing.
Chart 7
Role of financing-providing sectors in the stock of euro area NFC external financing
(percentages; annual data; 2013‑2019)

Sources: ECB (euro area accounts) and ECB calculations.
Box 2
The need to take the European Capital Markets Union (CMU) further
Well developed and integrated capital markets can make important contributions to economic growth and financial stability, in particular by improving funding access for firms and households and increasing private cross-border financial risk sharing (Section 4). Since the implementation of the CMU Action Plan in 2015 progress has been achieved on the legislative front, albeit to a varying extent across initiatives. While acknowledging that the actual impact on the real economy may take time to materialise, further and timely action is indispensable to drive this project forward.
Benefits of CMU
The Commission has been pursuing the CMU Action Plan in order to unlock more EU and global investment, better connect financing to investment projects, enhance financial stability and deepen financial integration and competition. A deeper and more harmonised CMU complements Europe’s strong reliance on bank financing and strengthens the link between savings and growth.
State of play of CMU
After announcing its CMU Action Plan in September 2015, the European Commission launched a series of initiatives to stimulate the development and integration of EU capital markets. These initiatives resulted in many pieces of legislation that addressed shortcomings in the area of securitisation, investment firms, covered bonds, pension products and restructuring legislation.[35] There were also measures related to fintech and sustainable finance. By the end of 2019, 11 out of 13 proposals included in the action plan had been adopted. While the adoption rate is relatively high, it has to be acknowledged that for some of the CMU-related legislative proposals the initial ambitions had to be scaled back significantly in order to reach an agreement among the co-legislators.[36]
So far, there is limited evidence that patterns in financial structures and markets have shifted so as to ultimately benefit the real economy. Retail participants have not yet embraced directly investing in capital market products and although the balance between banks and non-bank institutions has evolved in recent years, EU financing remains predominantly bank-based.[37] The report of the CEPS‑ECMI Task Force[38] on Rebranding CMU indicates that even though the amount of assets held by households in the EU has increased by 70% since 2003, the portion of retail investments channelled through equity markets amounts to only 21%, as compared to 41% in the United States.[39]
With regard to financial integration, volatile developments in the convergence of asset prices across the euro area during the last few years can be observed while post-crisis reintegration of cross-border asset holdings has broadly stalled.[40] This is also illustrated by the relatively small contribution by capital markets to smoothing a country-specific shock to GDP growth in the euro area.[41]
New geopolitical and economic challenges – such as Brexit, cyber risks and climate change – provide a fresh impetus for CMU. The relevance of CMU in the context of the broader Brexit discussions is highlighted in a dedicated special feature on the implications of Brexit for the EU financial landscape.[42] Furthermore, there are important synergies between the CMU agenda and other key European initiatives, such as the completion of the banking union, the Single Market agenda and initiatives to boost funding opportunities for the real economy.
Various parties’ recommendations for the next stage of developing CMU
In 2019, the CMU agenda continued to draw broad support from EU policymakers and market participants. A High Level Working group established by Germany, the Netherlands and France composed of different representatives of the private sector published proposals for relaunching CMU. These include recommendations for generating long-term savings opportunities, developing equity markets, enhancing cross-border financial flows, and developing debt, credit and forex financing tools with a view to increasing the international role of the euro.[43] The IMF had also recently published a Staff Note that identified three concrete priorities where further progress could be achieved: enhancing transparency by centralising and standardising reporting by all issuers, sharpening regulation and supervision, and improving solvency procedures.
Industry-led initiatives also produced recommendations on the future of CMU. For instance, the CEPS‑ECMI Task Force on Rebranding CMU put forward a Market Finance Action Plan in which it pleads for action on the core bond and equity markets, and on advancing the participation of individuals in capital markets.[44] In its report on Key Performance Indicators, the Association for Financial Markets in Europe (AFME) recommends renewing the ambition on CMU and unleashing the benefits of sustainable finance as well as digitalisation. Furthermore, work towards expanding the volume of and capacity for liquidity provision in EU markets and increased retail participation in public markets should continue. Finally, AFME is of the opinion that possible solutions for a European safe asset should be studied extensively in consultation with market participants.[45]
Way forward
The Commission intends to make CMU a centrepiece of the forthcoming legislative agenda, and has set up a High Level Forum composed of experts from different industry sectors, which has started work on proposals for the next CMU action plan.[46] The Finance Ministers of the Council of the European Union also indicated their interest in putting CMU high on the political agenda.[47] The main goals formulated for bringing CMU forward in this regard are: creating an ecosystem that enables more cross-border capital raising, developing European capital market architecture, greater retail investor participation, and the transition to sustainable and digital economies. The ECB strongly supports taking CMU to the next level with a second set of policy measures following the 2015 action plan.
1.2.3 Euro area general government
The euro area general government sector largely relies on debt financing instruments (Chart 8). Debt securities and loans represent 81% and 16% of total debt outstanding respectively. The relative composition of holders of general government debt has changed, certainly since 2013:
- the share held by residents has been growing, driven primarily by demand from resident financial corporations[48];
- the share held by non-residents remains generally significant, though it has been declining in relative terms; and
- the rest of the world holds around one-quarter of general government debt[49] [50].
Chart 8
Composition of general government liabilities by type of financial instrument and financing-providing economic sector
(EUR trillions; annual data; 1999‑2019)

Sources: ECB and ECB calculations.
Notes: Information on the financing-providing economic sector for debt securities and for intra-government exposure in the form of debt securities is only available since 2013.
2 Assets of financial intermediaries
The financial structure of a financial system can be understood as the mixture of financial markets and intermediaries operating within the economy of that system.[51]
Compared to the US and Japan, the euro area financial markets feature a smaller scale involvement of other financial intermediaries except insurance corporations and pension funds (OFIs) in the provision of loans (Chart 9). In spite of its increasingly large financial weight, the OFI sector has not yet managed to compete significantly against the MFI sector in the core business of issuing loans. The smaller role the OFI sector plays in loan supply contrasts with its large role in providing trade credit, which is much larger in volume in the euro area than in the United States or Japan. Trade credit being an instrument where the MFI sector is largely absent, the large use of this instrument by the OFI sector illustrates the fact that the MFI and OFI sectors do not necessarily compete in the same financial instruments. Other noteworthy differences between the three economic areas include the strong role of non- money market funds (MMFs) investment funds (IFs) in the United States in providing financing through listed shares, as well as the large demand from the government for debt securities in Japan.
The euro area financial system relies on three types of financial intermediaries (i.e. agents that channel funds between providers and recipients):
- Monetary financial institutions (MFIs) (excluding central banks): Credit institutions and money market funds had, until the end of 2014, represented the largest part of the financial system, financing households and NFCs principally through loans. While the MFI sector grew by roughly EUR 2 trillion over the period and is therefore the largest contributor to the overall short-term trend (closely followed by the OFI sector and the Eurosystem), the relative weight of this sector experienced a long-term decline. Specifically, its weight fell from nearly 50% of the size of the total financial sector in Q4 2009, to 35% in Q4 2016, and stabilised thereafter.
- Financial corporations except MFIs and ICPFs: non-MMFs investment funds, other financial intermediaries except ICPFs (including financial vehicle corporations (FVCs), financial auxiliaries and captive finance institutions and money lenders – experienced a steady long-term increase in their share of financing and have been the largest intermediaries of the total financial sector since the second half of 2014.
- Insurance corporations and pension funds (ICPFs): ICPFs have grown by approximately EUR 1.1 trillion since the end of 2016 with pension funds (PFs) – predominantly relevant in the Netherlands and Ireland – representing one-quarter of total ICPF assets.
Structural developments in key constituents of these three types of financial intermediary are presented in more detail in Section 3.
Chart 9
Composition of demand and supply in markets for financial instruments: an international comparison
(trillions of national currency; 2018 (for the euro area and United States) and 2017 (for Japan))

Sources: ECB for the euro area and OECD for the United States and Japan.
Notes: (1) Demand refers to liabilities of economic entities domiciled in the jurisdiction and to assets of those domiciled in the rest of the world. Supply refers to assets of economic entities domiciled in the jurisdiction and to liabilities of those domiciled in the rest of the world.
(2) Data for loans and debt securities markets include the participation of central banks in these markets.
(3) The charts aggregate for both the demand and the supply side the financial instrument position by economic sector. They show the relevance of the different financial instrument markets for the various economic sectors. It is a market view though, not a from-who-to-whom analysis.
(4) Other financial institutions (OFIs) include other financial intermediaries (except insurance corporations and pension funds), financial auxiliaries as well as captive financial institutions and money lenders
(5) Looking at listed shares, unlisted shares and other equity combined, the demand and supply match in US financial accounts data. Discrepancies at the instrument level are due to statistical reporting issues.
Aggregate assets of all financial intermediaries point to the following major developments over the over the period from the end of 2016 to mid‑2019 (Chart 10):
- Total euro area financial sector assets grew by EUR 6.5 trillion, recording an annual growth rate of slightly below 3.5%.[52] There was a dip in financial sector assets in 2018, and a rebound as from early 2019, associated with equity value changes predominantly affecting the non-money market fund investment funds sector (Chart 11). The lower equity market valuations were caused by geopolitical uncertainties, trade tensions, Brexit uncertainty (see the special feature on Brexit), as well as a short-lived tightening in the Federal Reserve’s monetary policy stance.
- The ratio of financial sector assets to GDP has contracted at the euro area level since 2015. Importantly, the aggregate picture given in Chart 10 masks some heterogeneity in national developments.
- Assets of non-banks (i.e. ICPFs, IFs and OFIs) have surpassed in size the euro area banking sector’s assets since mid‑2013.[53] Drivers of this development are a relatively slower growth of bank assets, further consolidation and concentration in the banking sector, the strong Eurosystem balance sheet expansion and increased reliance market-based intermediation.
- The euro area Financial Corporations except MFIs and ICPFs (FCs) sector has constituted the largest financial sub-sector since the second half of 2015. The euro area OFI sector is larger than the FCs sector of Japan, though smaller than that of the United States.[54]
Chart 10
Total assets of the euro area financial sector
(ratio to nominal GDP (left panel); percentages (right panel); March 1999‑June 2019)
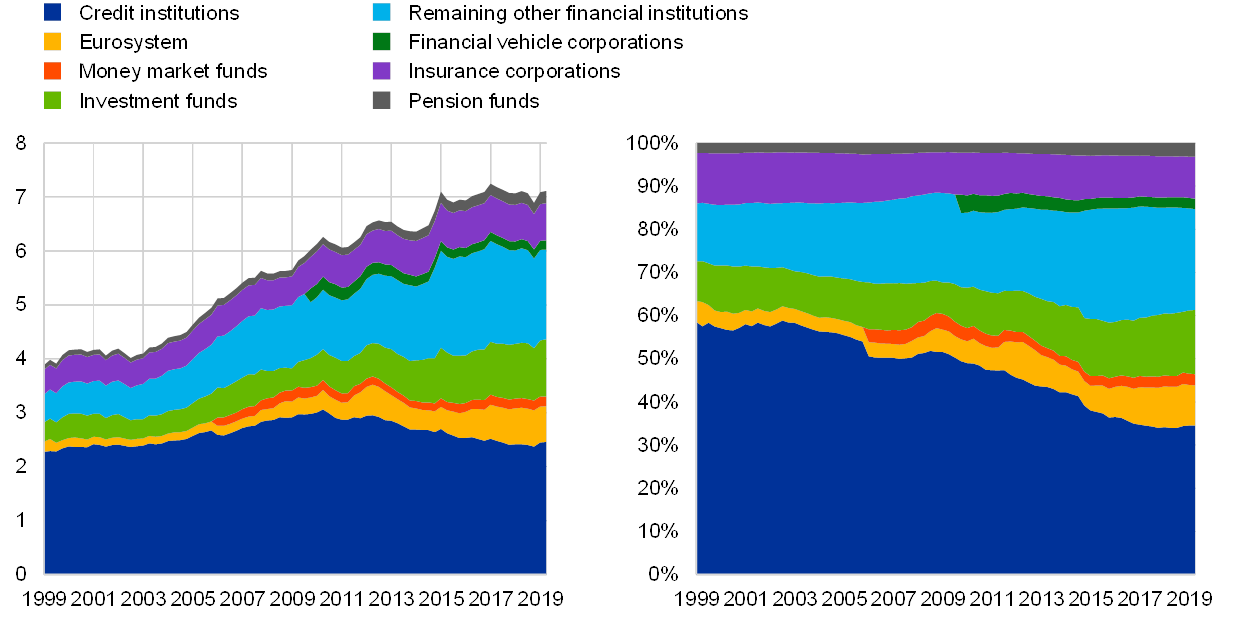
Source: ECB.
Notes: The aggregated (non-consolidated) assets of sub-sectors include financial assets and exclude non-financial assets Remaining other financial institutions include security and derivative dealers, financial corporations engaged in lending (such as leasing or factoring companies), specialised financial corporations (including venture capital companies, export/import financing companies or some central clearing counterparties), financial auxiliaries (including for example asset management companies, securities brokers, investment advisers, insurance brokers or exchanges) as well as captive financial institutions and money lenders (including for example financial holding companies, funding vehicles of non-financial corporations – e.g. supporting their debt securities issuance – and other entities that channel financial flows within non-financial corporations). Data on money market funds are reported separately from credit institutions only as of Q1 2006. Data on financial vehicle corporations, which are undertakings carrying out securitisation transactions, are reported separately from remaining other financial institutions as of Q4 2009.
Chart 11
Change in the total financial asset holdings of euro area financial corporations
(annual growth rates; percentage point contributions; quarterly; March 2000 – June 2019)

Source: ECB.
The strong growth of the euro area financial sector over the past two decades has affected the euro area financial structure and development.
The financial structure – defined as the ratio of stock market capitalisation to private credit through loans and debt securities (Chart 12) – reflects the predominant role of credit in the financing of the euro area economy, though it is also affected by valuation changes in the general level of stock prices. At the end of 2018, this indicator stood at a level even lower than in 1999 (Chart 12) and is lower than the same indicator for the United States or Japan.[55] The relative importance of stock markets declined rapidly during the first years of the euro, which coincided with the burst of the dot-com bubble, and once again during the global financial crisis. In the ensuing decade, the ratio of stock market capitalisation to total financial intermediation has increased mildly, to its 2002 level.
Financial development – measured as the sum of credit to the resident private sector through loans and debt securities plus stock market capitalisation as a ratio to GDP – shows a steady long-term trend growth in the size of euro area capital markets. The overall size of financial markets relative to GDP has increased marginally increased over the past two decades (from 2.7% in 1999 to 2.9% in 2018). Over the same period this indicator has however remained significantly below the corresponding US and Japanese indicators, reflecting a less developed public equity market in the euro area.
Chart 12
Financial development and financial structure in the euro area, the United States and Japan
(ratios; annual data: 1999‑2018)
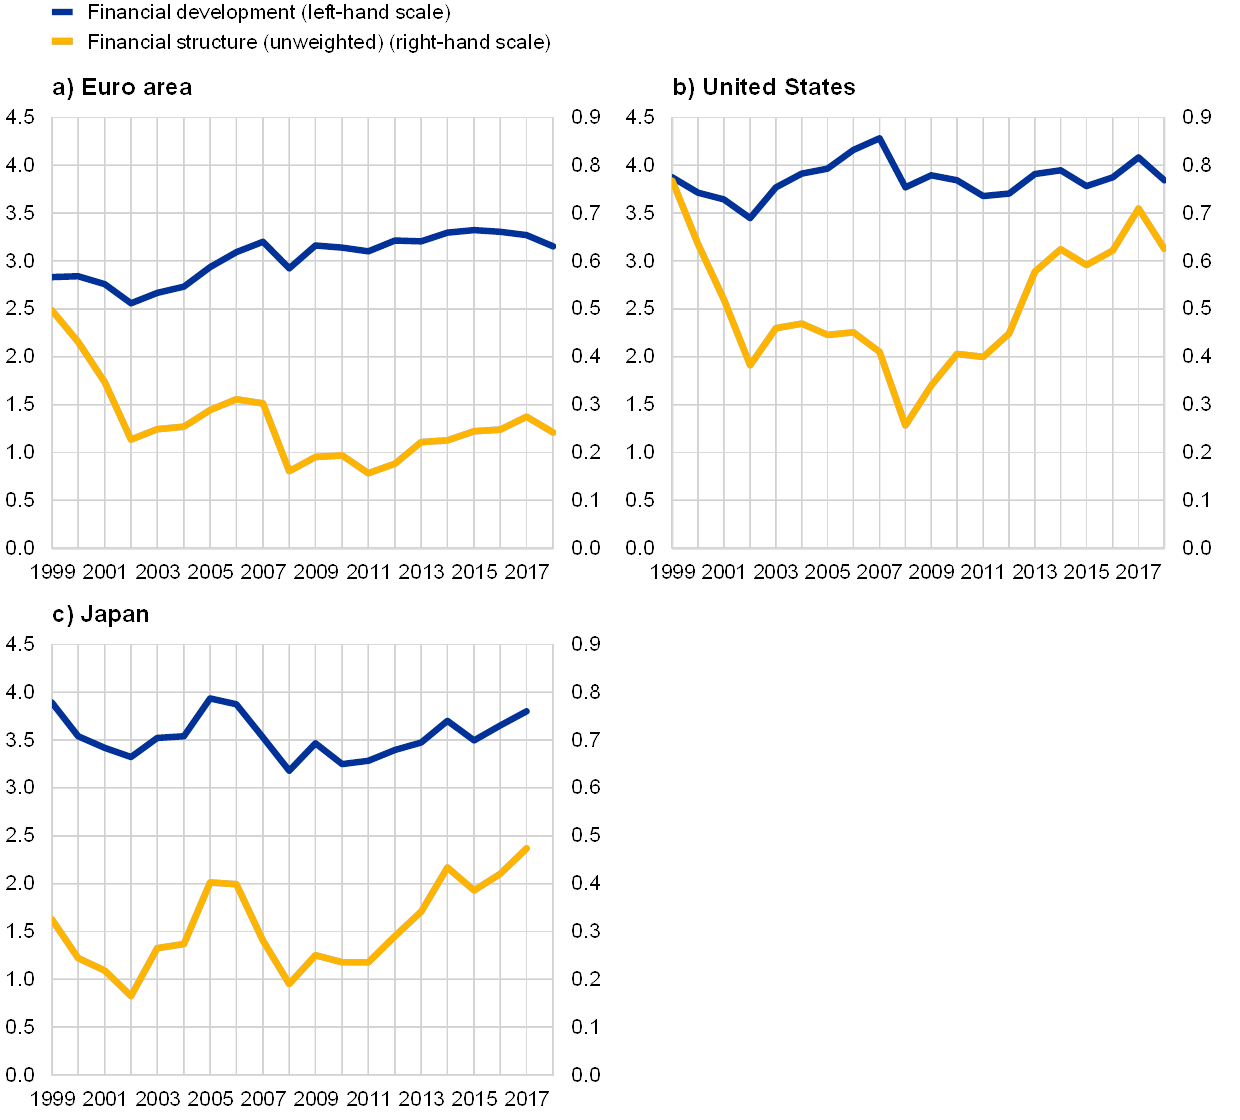
Sources: ECB, OECD and ECB calculations.
Notes: The chart plots for economic agents resident in the euro area, the United States and Japan the sum of credit to the private sector through loans and debt securities as well as listed shares (i.e. the stock market capitalisation), divided by GDP (“financial development”), and the ratio of euro area stock market capitalisation to credit to the private sector through loans and debt securities (“financial structure”). Loans exclude inter-company loans.
3 Euro area financial intermediaries
This section reviews the key structural features and the latest developments in the main euro area financial intermediaries.
3.1 Credit institutions
The euro area banking sector counted 3,900 credit institutions including 688 foreign branches in 2018. The number of credit institutions had decreased by 3% compared to 2016, while the number of branches stayed broadly the same. Across countries, the highest numbers of credit institutions were recorded in Germany, Italy, Austria, France and Ireland, while the highest number of foreign branches was in Belgium, Luxembourg, Portugal and Greece (Chart 13). Bank assets to GDP ranged from 0.6 in Lithuania to 14.4 in Luxembourg. Compared with 2016, assets in GDP had decreased by between 5% in France and 21% in Malta, with the exception of Austria and Finland, where the ratio of assets to GDP had increased.
Chart 13
Number of credit institutions and foreign branches and bank assets in GDP
(2008, 2016 and 2018)

Sources: Eurostat, ECB and ECB calculations.
Notes: Branches refer to the local units of credit institutions. In the case of Ireland, the ratio may be underestimated given the large impact of foreign-owned multinational enterprises in its GDP. The use alternative metrics, other than GDP, that are more related to the domestic economy, such as the Modified Gross National Income (GNI*), would yield considerably higher ratios for bank assets.
The composition of the euro area banking sector assets in 2018 was around 65% loans, 13% debt instruments, 8% cash and 3% equities. The asset mix changed between 2016 and 2018: total loans and cash with central banks increased somewhat while equity instruments, debt securities and other assets decreased (Chart 14, left panel). This was mirrored in the relative compositions of the banking and trading books; while loans in banking books had increased, trading book assets had decreased marginally in the same period. Regarding cross-border activity; in 2018 between 3% and 34% of syndicated loans to euro area NFCs by euro area banks were cross-border.
Chart 14
Breakdown by category of financial assets (left panel) and liabilities (right panel) of euro area MFIs left-hand
(percentage of total assets, end of 2008, 2016 and 2018)
Sources: Eurostat, ECB and ECB calculations.
Note: Branches refer to the local units of credit institutions.
Turning to liabilities, deposit financing stood at 55% in the euro area in 2018. Wholesale market funding stood at 23% of total liabilities (Chart 14, right panel). The share of deposits in total funding has increased by 3% since 2016 and by 15% compared to 2008, while the wholesale market funding share decreased by 1% in the same period (by 13% from 2008). Central bank funding decreased in the euro area from 3% in 2008 to 2% in 2018. Equity in total assets, by contrast, increased from 7% to 9.5% in the same period.
There are indications of an increasingly efficient use of resources in most euro area banking sectors – between 2008 and 2018 – on the basis of two key banking system capacity indicators. Population per local branch has increased in this period across all countries (it more than doubled in six countries), and population per banking employee has increased as well, although to a lesser extent (Chart 15).
Chart 15
Population per local branch (upper panel) and population per banking employee in euro area countries (lower panel)

Source: ECB (Structural Financial Indicators statistics), Eurostat and ECB calculations.
Notes: Figures for Cyprus report each co-operative credit institution as a separate MFI credit institution.
Box 3
Cross-border bank consolidation in the euro area: a global perspective
Global consolidation trends in banking since 2016
Since the publication of 2017 Financial Integration Report, global consolidation in the banking sector – as measured by mergers and acquisitions (M&As) – has remained at low levels. Over this period, global M&As have amounted to around EUR 100 bn annually, which is low compared with the pre-crisis period, but in line with the trends since 2010 (Chart A, left panel). The share of banking M&As in Europe has dropped to below 20% of global M&As since 2014. In contrast, M&As in the United States-Mexico-Canada Agreement area (USMCA – prev. NAFTA) area as well as in other areas have picked up somewhat since 2014 (see Chart A, right panel). Looking at cross-border versus domestic bank mergers, cross-border ones represented a relatively small share across all regions, accounting for between 15% and 30% of all bank mergers since 2010. For the EU, government-led bank mergers in the post-global financial crisis period [56]were also sizeable in 2008‑09, since some adjustment programmes were centred around bank consolidations.
Chart A
Bank M&As globally across free-trade areas and economic regions in EUR billions (left panel) and as a share of the total (right panel)
(left panel: y-axis: EUR billions; x-axis: years; right panel: y-axis: percentages; x-axis: years)

Source: Dealogic and ECB calculations.
Notes: Data for 2019 includes M&As up to November 2019. EU government bank mergers are those where government stepped into the ownership structure.
Bank mergers and acquisitions in the euro area and valuations
Bank M&As in the euro area remained subdued over the past couple of years, in line with the trends in the EU (Chart B, left panel). Despite generally low M&A activity, the share of outward EU and inward non-EU mergers over recent periods was somewhat larger compared to the period before, while cross-border euro area M&As continued to be low. Levels of cross-border consolidation remained low despite the introduction of the banking union, which can be traced to low valuations in the banking sector (see next paragraph) and also several other business, regulatory, supervisory and even political obstacles.[57] Some of the business obstacles have remained, including low growth, differences in language and business culture, although non-performing loan (NPL) levels have decreased since 2016. More structural reasons also continue to play an important role: (i) uncertainty about future regulatory developments; (ii) lack of harmonisation in the legal and regulatory basis governing M&A reviews; (iii) level playing field concerns between domestic and pan-euro area banks; (iv) differences in financial laws, tax systems and remaining regulatory diversity among euro area countries (e.g. resulting from national options and discretions); as well as (v) the incompleteness of the banking union. More details on these different practices are published in the recent World Bank survey on bank regulation and supervision.[58]
High and increasing bank valuations seem to be one of the essential drivers of M&A activity in general.[59] However, the correlation of these with M&As exhibited divergent paths across three world regions (Chart B, right panel). While from 2015 onwards, bank valuations decreased further in Europe, they increased in the USMCA region (former NAFTA) and remained at their previous levels in the rest of the world. In Europe this was coupled with decreasing numbers of domestic as well as cross-border mergers. In the USMCA region as well as rest of the world, increased valuations were not accompanied by increased M&A activity, which instead stayed at 2015 levels or even decreased slightly. Note that the size of M&As was much larger in the USMCA before the global financial crisis than afterwards, which indicates that besides valuations, global factors are also driving the sluggish levels of M&A activity.
Chart B
Bank M&As in the euro area – value of transactions (left panel); mergers and acquisitions and valuations: comparing five (3‑year average) points (2000, 2004, 2010, 2015 and 2018) (right panel)
(left panel: y-axis: EUR billions, x-axis: years; right panel: x-axis: equity valuations (EUROSTOXX index) normalised to 100 in 2000; y-axis: EUR billions)
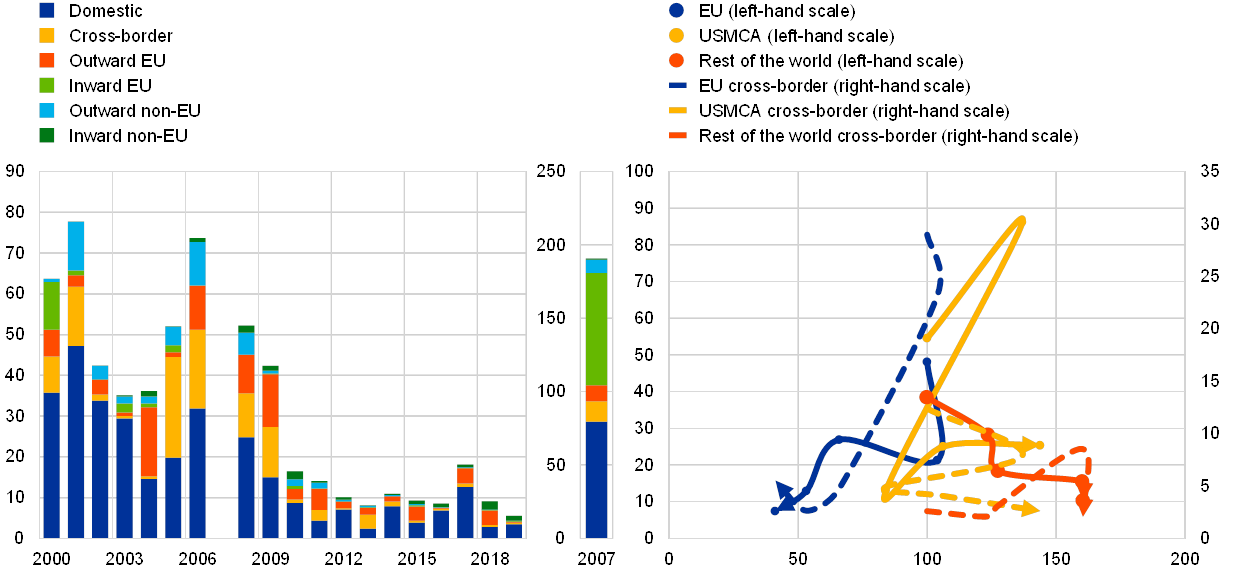
Source: Datastream and Dealogic.
Notes: Data for 2019 include M&As up to November 2019. Full lines in the right panel are domestic M&As, dotted lines are cross-border ones.
3.2 Non-bank financial entities
The non-bank financial sector amounted to 59% of total financial sector assets or EUR 48.7 trillion in June 2019. Its ratio has remained broadly stable in recent years (Chart 10). The non-bank financial sector consists of money market funds (MMFs), investment funds (IFs), insurance corporations (ICs), pension funds (PFs), financial vehicle corporations (FVCs), and a residual of remaining other financial intermediaries. This residual accounts for 40% of total non-bank financial sector assets. It mainly consists of holding companies and funding vehicles for NFCs or entities that channel financial flows within NFC groups.[60] The non-bank financial sector assets grew by 4.4% since June 2017 on account of strong growth of the investment funds sector (13.5%).
Box 4
Characterisation of the euro area fintech scene
In order to assess the impact of technological innovation used to support or provide financial services (fintech) on financial integration and structures in the euro area, it is necessary to consider – among other aspects – comprehensive data on fintech entities, their operations and ownership structures. The analysis presented in this box is based on an experimental dataset[61] for the euro area and aims to shed some light on both the fintech scene for the euro area as a whole and on differences in the fintech landscape across euro area countries. The box also provides some details on the incorporation of fintech shareholders (euro area and non-euro area countries) as well as their sectors of economic activity.
Chart A
Fintech entities in the euro area
(estimated number of entities by year of formation)
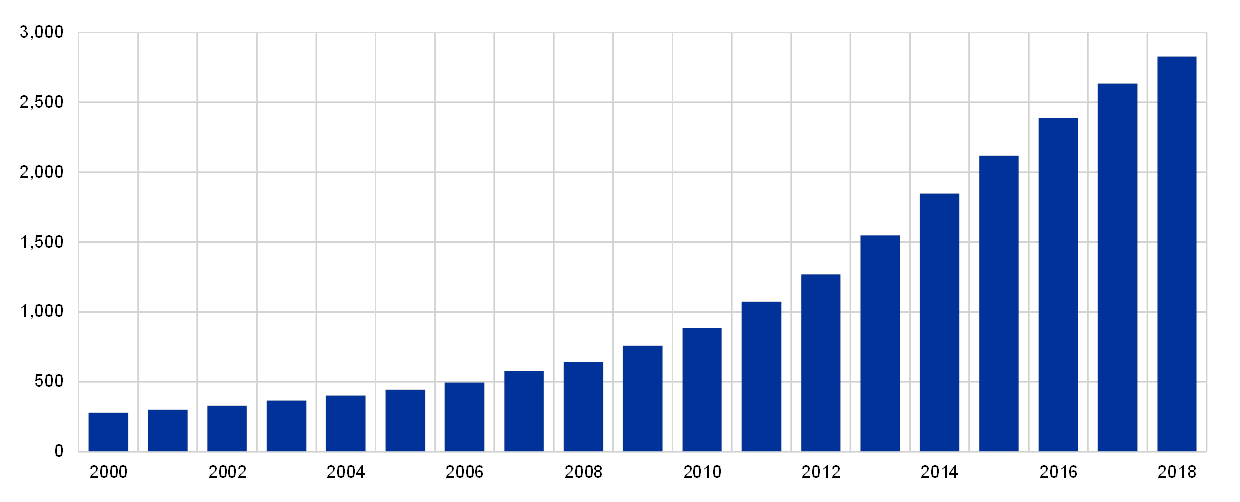
Source: ECB calculations and estimation based on experimental data collection and Bureau van Dijk (BvD) data.
Note: BigTech, InsurTech and PensionTech entities are not included.
Euro area countries currently host more than a fifth of the total number of fintech entities worldwide after dynamic growth over the past decade. For example, for 2018 around 2,800 fintech entities have been identified in the euro area, compared to less than 500 in 2006 (see Chart A). This number represents around 23% of the estimated number of fintech companies globally[62]. Looking at the year of incorporation (see Chart A), the second decade of 2000 saw a sharp acceleration in the number of entities set up, consistent with a favourable environment for fintech undertakings. The average length of operation of analysed entities stands now at somewhat longer than seven years.
Fintech entities can be divided into four clusters[63] in line with their distinctive business models and by analogy to the traditional value-adding areas of a universal bank (see Chart B). Fintech entities operating within clusters B (payments, clearing and settlement services) and A (credit, deposit and capital raising services) are the most numerous in the euro area. From a country perspective, large countries such as France, the Netherlands and Germany host the largest number of fintech entities. With the high number of entities, also in relation to population size, Luxembourg, Estonia, Lithuania, Ireland and Finland can be identified as the most densely covered – or “tech savvy” – countries. Initially fintech entities tended to first enter the sphere of activities in cluster B, which might explains the dominant position of this cluster with its high number of entities in many euro area countries. However, in many countries already other clusters are the most populated by fintech entities. In terms of cross-country heterogeneity and national specialisations, cluster A is the most populated in Germany, Spain and Italy. Cluster D covering technological services not classified elsewhere is the most populated in the Netherlands, Belgium, Ireland and Finland. Cluster C (Investment services and management) is well populated across the euro area however it is not dominant in any of particular countries. In general, the 10 euro area countries with the highest number of fintech entities account for 90% of the total number. A certain share of fintech entities operates cross-border, consistent with some contribution to euro area financial integration (see the lower left panel in Chart B). Based on the collected data, 8% of the euro area entities have a solid presence[64] in at least one other euro area country and many entities also offer services and products across euro area borders.
Chart B
Number of fintech entities by cluster of financial activity and by country
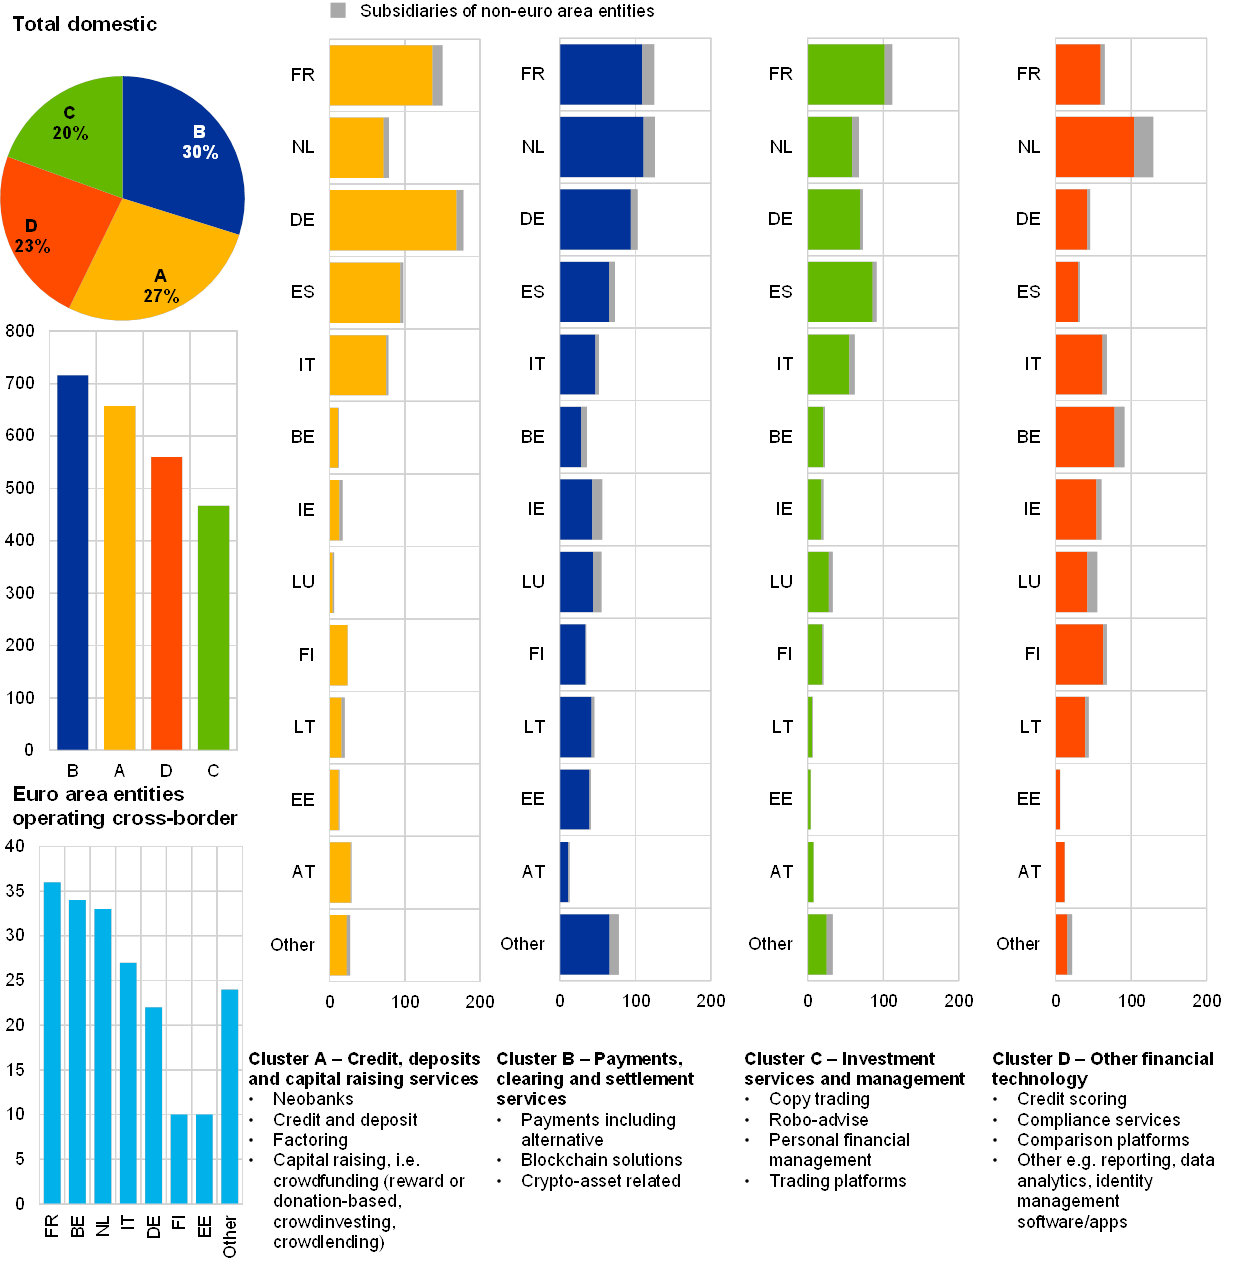
Source: ECB calculations based on experimental data collection.
Notes: Clusters of activities as in the discussion paper on the European Banking Authority’s (EBA’s) approach to fintech. One entity is allocated to one cluster only. Entities operating cross-border are entities with headquarters in one euro area country that feature also on the lists of fintech entities in other countries than the headquarter location.
In terms of ownership structure, the links between fintech entities and the traditional financial sector are close. The analysis of shareholders[65] points to strong euro area entities supporting the fintech entities as well as to close links between fintech and the traditional financial sector (see Charts C and D). Looking at the of shareholders’ countries of incorporation, the majority of fintech entities are domestic, with the lowest share of domestic shareholders recorded in Luxembourg and accounting to 55%. The vast majority of foreign shareholders are from the non-euro area countries; however, the part of the non-domestic euro area shareholders is significant. The analysis of shareholders by sector of economic activity points to strong links with the financial sector (K NACE Financial and insurance activities sector of economic activity). Unsurprisingly a quite significant proportion of shareholders were also registered as active in the J NACE information and communication sector of economic activity. The shareholders from the financial sector are dominant within activity clusters A, B and C, with on average 60%, 46% and 40% respectively. Shareholders from the information and communication sector constitute 24% and 34% of total shareholders in Clusters C and D respectively.
Chart C
Shareholders of fintech entities by geographical location

Source: ECB calculations based on experimental data collection and Bureau van Dijk (BvD) links information.
Chart D
Shareholders of fintech entities by sector of economic activity
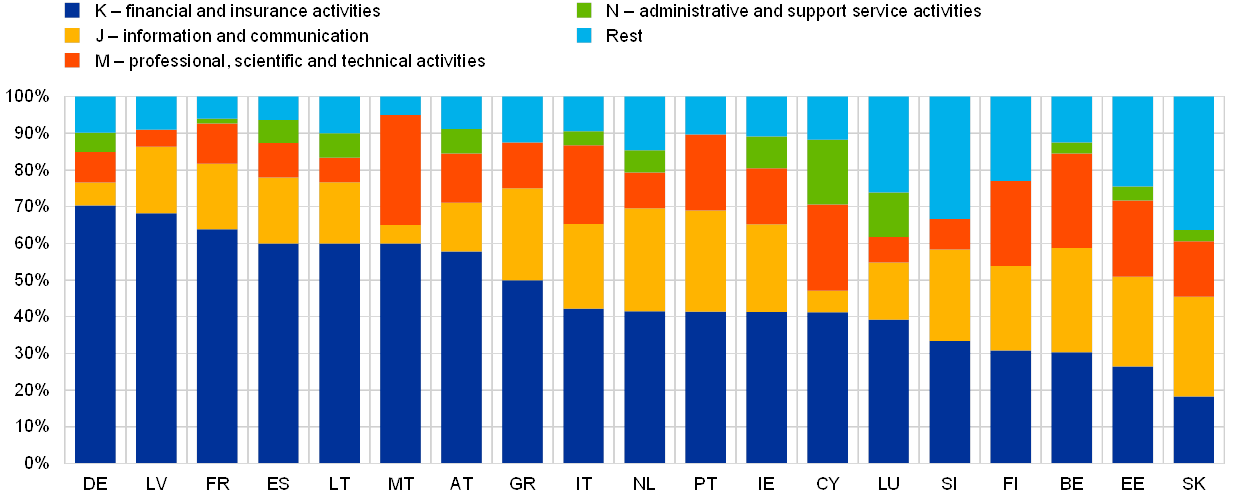
Source: ECB calculations based on experimental data collection and Bureau van Dijk (BvD) links information.
Note: Sectors of economic activity follow the NACE classification.
Well developed and reliable statistics on fintech undertakings are crucial for monitoring and assessing the benefits that fintech entities bring to the euro area financial system, for guarding against potential risks and for analysing their implications for the main central bank functions. With a view to gaining an insight into Fintech related transformation and risks, central bank statistical initiatives aimed at increased availability of information provide valuable input. In this context the ECB and national initiatives are to be highlighted, for example those associated with the Irving Fisher Committee (IFC) on Central Banking Statistics[66]. Specifically, the IFC Working Group on fintech data has analysed and made recommendations on central bank fintech statistics[67]. Finally, prospective fintech-related adaptation of the International Standard Classification of All Economic Activities[68] (ISIC) as well of the statistical classification of economic activities in the European Community (NACE[69]) would facilitate adequate monitoring of fintech developments by requiring the identification of fintech activities as a separate class or set of classes.
3.2.1 Insurance corporations and pension funds
The total assets of euro area insurance corporations (ICs) are concentrated in a small number of countries (Chart 16). ICs’ assets in France, Germany, Italy, and the Netherlands make up 81% of the sector’s total assets in the euro area. The total number of ICs was stable between Q3 2017 and Q2 2019 (1,985 versus 1,930 corporations), with the highest number of institutions in Germany, Spain, Luxembourg, and Ireland. This concentration points to a relatively high integration of insurance markets across the euro area, with corporations domiciled in a small set of countries also offering insurance services for the remaining euro area countries.
Chart 16
Total number and total assets of insurance corporations by country
(left-hand scale: number of firms; right-hand scale: EUR trillions)
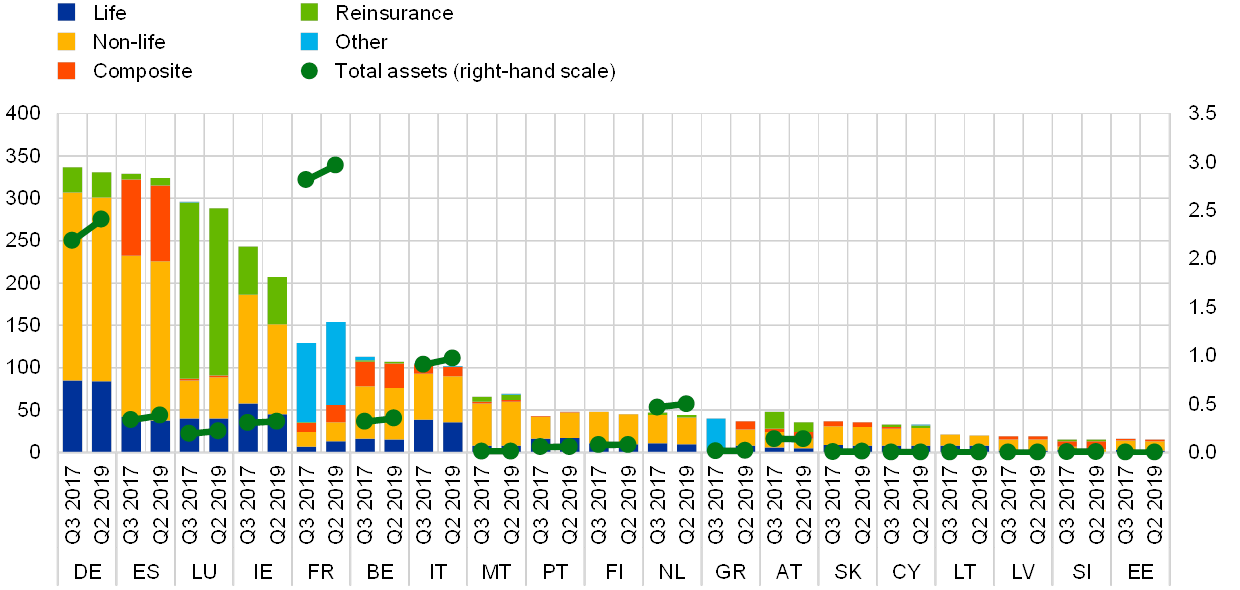
Source: ECB (insurance corporation balance sheet data).
Insurance corporations and pension funds have continuously shifted their portfolio towards higher-yielding, but more diversified assets in recent years (Chart 17). The portfolio share of investment fund shares in total financial assets increased from 18% in 2008 to 32% at the end of 2018, while the proportion of direct investments in equity shares, debt securities, and lending either remained stable or decreased.[70] This shift towards indirect asset holdings via investment fund shares was mainly for accounting reasons. According to some sources, it also led to a better geographical portfolio diversification, which is fostering financial integration in the euro area.[71] Holdings of highly liquid assets, such as currency and deposits decreased from 13% in 2008 to 6.8% in 2018.
Chart 17
Breakdown of financial assets – euro area ICPFs
(2008, 2016, 2018; percentage of financial assets)
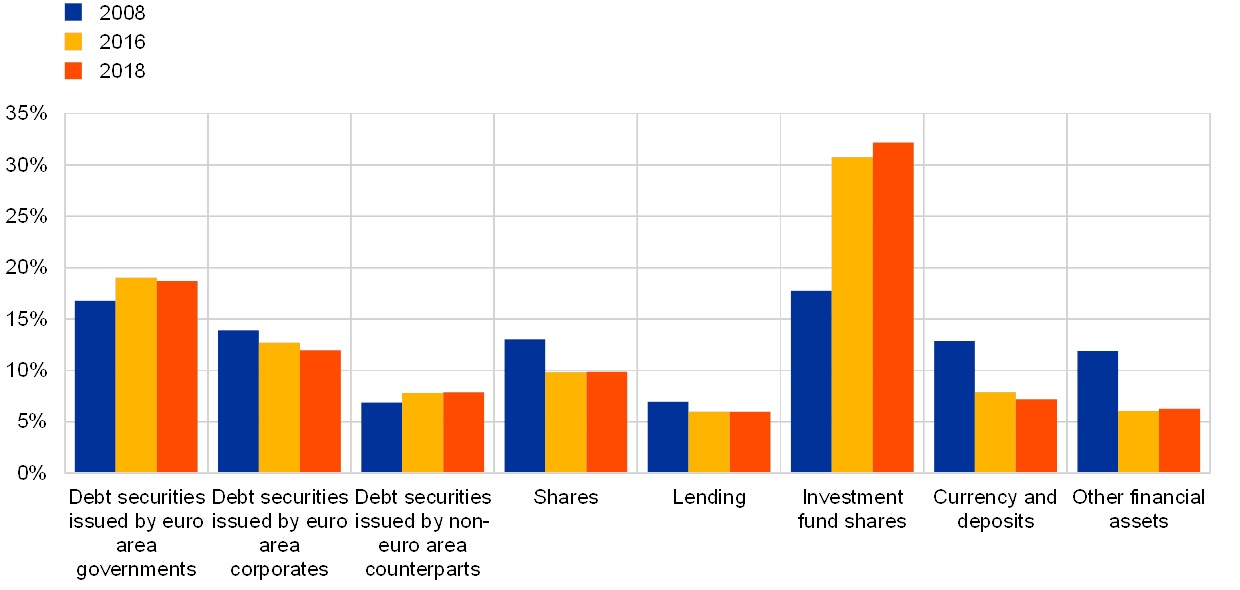
Source: ECB (euro area accounts).
Note: Investment fund shares exclude MMF shares.
3.2.2 Investment funds
The investment fund sector grew continuously in recent years with total assets standing at almost EUR 14 trillion in June 2019. Investment funds are primarily domiciled in Luxembourg, Ireland, Germany, and France, from where they offer services to the whole euro area (Chart 18). In total, there are about 60,000 funds registered in the euro area, of which about one-quarter are located in Luxembourg.
Chart 18
Total number and total assets of investment funds
(left-hand scale: number of funds; right-hand scale EUR trillions)

Sources: ECB investment statistics and ECB calculations.
Note: Number of funds includes sub-funds.
Chart 19
Euro area investment funds’ balance sheets
(December 2016; June 2019; EUR trillions)

Sources: ECB (investment fund balance sheet statistics) and ECB calculations.
The asset class composition of euro area investment funds remained broadly constant in recent years. The proportions of assets invested in bonds and equity stood at 37% and 46% respectively in June 2019, almost unchanged compared to December 2016 (Chart 19). Within their debt securities portfolios, investment funds partially rebalanced towards non-euro area securities and away from euro area government debt. The investor base of the investment fund sector consisted 71% (73%) of investors from within the euro area in June 2019 (December 2016).
4 Financial integration
This section presents empirical evidence on financial integration and resilience and then analyses the state of integration in specific financial market segments, such as the money market, retail banking market, securities markets, bond markets and equity markets. This section is structured so as to take three perspectives on integration. First it looks at the quantified degree of aggregate financial integration based on a rich set of composite indicators. This makes it possible to synthesise a vast array/range of empirical evidence on various strands of financial integration. Second, the section looks at several indicators of overall financial resilience in order to check that financial progress is less prone to unravel – and the financial system become a source of instability – in the face of large shocks to the financial system. Box 5 discusses the current state of cross-country risk sharing in the euro area. This is an important economic benefit of genuine financial integration in a monetary union. Better integrated asset markets should help smooth income and consumption growth, and hedge against country-specific sources of risk through the contribution of the capital, fiscal and credit channels. Together these indicators make it possible to gauge changes in the quality of financial integration in the euro area. Third, the section analyses the specific financial market segments.[72]
4.1 Aggregate developments
4.1.1 Quantified degree of integration through the lenses of composite indicators
According to the ECB’s composite financial integration indicators, the state of intra-euro area financial integration has been rather volatile in recent years. Two composite indicators of financial integration underlying the analysis combine information from the most important financial markets (Chart 20). They capture cross-border price differentials (the price-based indicator in yellow) and cross-border investment (the quantity-based indicator in blue) respectively. Following the financial and sovereign debt crises both composite indicators recovered until 2015. Instead, in recent years these two financial integration indicators displayed some discrepancies.
In recent years, the price-based indicator showed sizeable fluctuations, with the latest reading being only slightly above the 2015 peak. This volatility resulted in particular from changing cross-border bond yield differentials, related to emerging and dissipating political uncertainties in various euro area countries among other factors. Underlying these dynamics in the price-based composite indicator were heterogeneous developments in its four market-specific subcomponents[73]. While cross-country interest rate dispersion in the retail banking loan and deposit markets was broadly stable, the price-based measures of the state of equity market integration deteriorated sharply between the end of 2017 and September 2019. The dispersion in price-based equity market integration could be related to differences in the business cycle, country-specific shocks to certain industries or other factors not investigated here. At the same time, the large drop in price-based equity market integration over recent quarters was accompanied by diverging trends in the three other markets. The interest rate convergence slightly declined in the unsecured money market[74], it stagnated in the banking markets and it increased in government and corporate bond markets.
Chart 20
Price-based and quantity-based composite indicators of financial integration
(quarterly data; price-based indicator: Q1 1995 – Q3 2019; quantity-based indicator: Q1 1999 – Q2 2019)
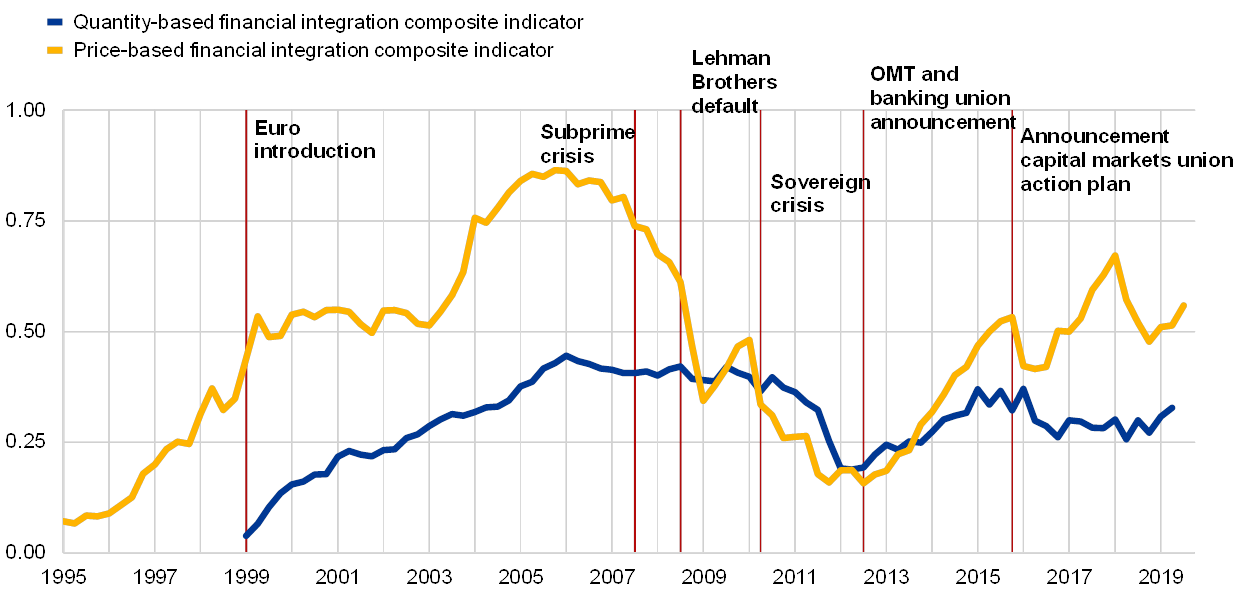
Source: ECB and ECB calculations.
Notes: The price-based composite indicator aggregates ten indicators for money, bond, equity and retail banking markets, while the quantity-based composite indicator aggregates five indicators for the same market segments except retail banking. The indicators are bounded between zero (full fragmentation) and one (full integration). Increases in the indicators signal greater financial integration. From January 2018 onwards the behaviour of the price-based indicator may have changed due to the transition from EONIA to €STR interest rates in the money market component. OMT stands for Outright Monetary Transactions. For a detailed description of the indicators and their input data, see the Statistical Web Annex to this report and Hoffmann, P., Kremer, M. and Zaharia, S. (2019), “Financial integration in Europe through the lens of composite indicators”, Working Paper Series, No 2319, ECB, September.
The quantity-based composite indicator – which aggregates various measures of relative portfolio shares of intra-euro area cross-border asset holdings – also recorded a minor overall increase during the same period (Chart 20). However, the broad stability in this second composite indicator of financial integration masked rather heterogeneous developments across the different market segments. In particular, a rather strong decline in the measured degree of equity market integration (also picked up by the price-based indicator) was overcompensated for by increasing cross-border holdings in money and bond markets.
On balance, financial integration within the euro area – based on combining a broad range of price-based and quantity-based indicators – exhibits discrepancies and its progress has not been very satisfactory in recent years. We see relatively uneven developments across the market segments considered in this report. We also find notable discrepancies between price-based and quantity-based indicators.[75]
4.1.2 Quality of integration
From the point of view of a monetary union, it is important to look not only at the above-mentioned price-based and quantity-based indicators of financial integration, but also at the “quality” of financial integration. As discussed in the Financial Integration Report 2016, the economic literature has come to the conclusion that that financial integration through equity instruments (either foreign direct investment (FDI) or portfolio equity holdings) is more resilient (e.g. to idiosyncratic shocks) than financial integration through debt instruments.[76] In a similar vein, financial integration based on debt instruments of longer maturities is more stable (e.g. less prone to sudden reversals/outflows), especially during financial tensions or crises, than financial integration based on debt instruments of shorter maturities. Moreover, it is believed that liquidity crises have often been triggered by sudden halts in short-term debt investment.
Against this background, we turn to several indicators of the resilience of financial integration in the euro area. Charts 21, 22 and 23 illustrate the quality of equity, long-term debt and FDI, respectively. Chart 21 presents the first indicator of the resilience of financial integration in the euro area by looking at intra-euro area foreign equity holdings versus foreign debt holdings. Equity integration has experienced stagnation and exhibited a subsequent decline since Q4 2017; thus echoing the negative evolution in the composite indicators reviewed above. In the long run though, equity investments are increasingly becoming more relevant debt investments (representing around 70% of intra-euro area debt holdings), but their level remains low. This evolution has been driven by two concurrent phenomena: a gradual increase and subsequent levelling-off in intra-euro area equity holdings and a gradual decline and subsequent levelling-off of intra-euro area debt securities holdings. While the long-term trend of equity integration is encouraging, the adverse current trend and the low level of equity integration leave room for further improvement.
Chart 21
Equity integration, though stagnant, is increasingly becoming more than debt investments
(left-hand scale: EUR trillions; right-hand scale: ratio; Q1 2008 – Q2 2019)

Source: ECB and ECB calculations.
Notes: The blue line shows the total amount of equity holdings by euro area investors (all sectors) issued by residents of other euro area countries. The yellow line shows the total amount of debt securities holdings by euro area investors (all sectors) issued by residents of other euro area countries. The orange line shows the ratio of the two. For both equity and debt investments, the total refers to the sum of intra-euro area cross-border and domestic asset holdings
Chart 22
Cross-border holding of short-term debt is on the rise and is coupled with a broadly stable trend in long-term debt integration
(left-hand scale: EUR trillions; right-hand scale: ratio; Q1 2008 – Q2 2019)
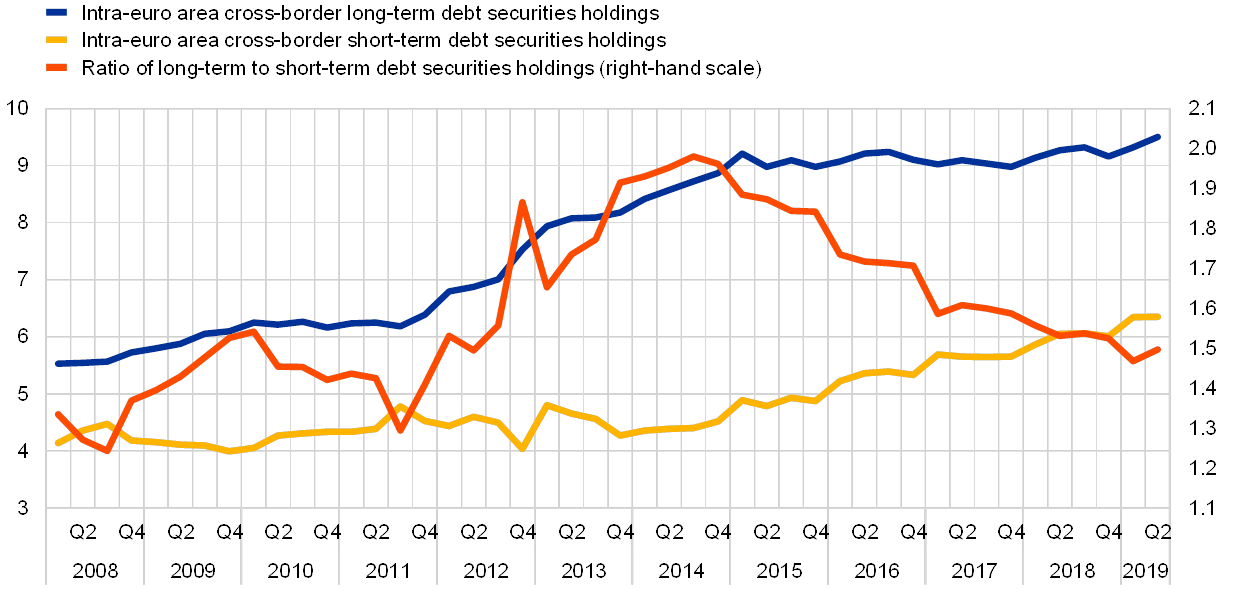
Sources: ECB, ECB calculations based in particular on balance of payments data, and Eurostat.
Notes: The blue line shows the total amount of long-term debt (with a maturity of more than one year) issued by euro area countries and held by residents of other euro area countries. The yellow line shows the total amount of short-term debt (with a maturity of less than one year) issued by euro area countries and held by residents of other euro area countries. The orange line shows the ratio of the two.
Since late 2014, we note an increase in cross-border holdings of short-term debt, which is reminiscent of the recent increase in money market integration picked up by the composite indicators. This is shown in Chart 22 which looks at intra-euro area foreign long-term debt holdings versus foreign short-term debt holdings. This trend combined with a broadly stable trend in long-term debt resulted in a decrease in the ratio of intra-euro area exposures to long-term debt relative to short-term debt, currently standing at roughly 1.5. The trend may be affected somewhat by the asset purchase programme (APP) implemented in a decentralised fashion by the Eurosystem. Since the recent trend in short-term debt integration has eroded part of the positive trend witnessed since 2008, further developments should be monitored.
As short-term flows are thought to be more volatile, it is important to look at the maturity of the intra-euro area capital flows. Chart 23 presents the share of FDI in total foreign investment, given its long-term and relatively fixed nature. One stark observation is the falling role of FDI since Q2 2017, to a level close to that of Q3 2011. At the same time, it should be noted that the repatriation of foreign earnings by US multinationals affected FDI flows over this period.[77] Against this background, the share of intra-euro area FDI in total foreign investment increased only modestly over the entire period considered in Chart 17; thus contrasting with the substantial increase between 2008 and Q2 2017. Overall, the evolution of FDI integration should be monitored, considering the sharp decline over the past three years.
Chart 23
The share of FDI in total foreign investment has been declining in recent years
(left hand scale: EUR trillions; right-hand scale: ratio; Q1 2008 – Q2 2019)
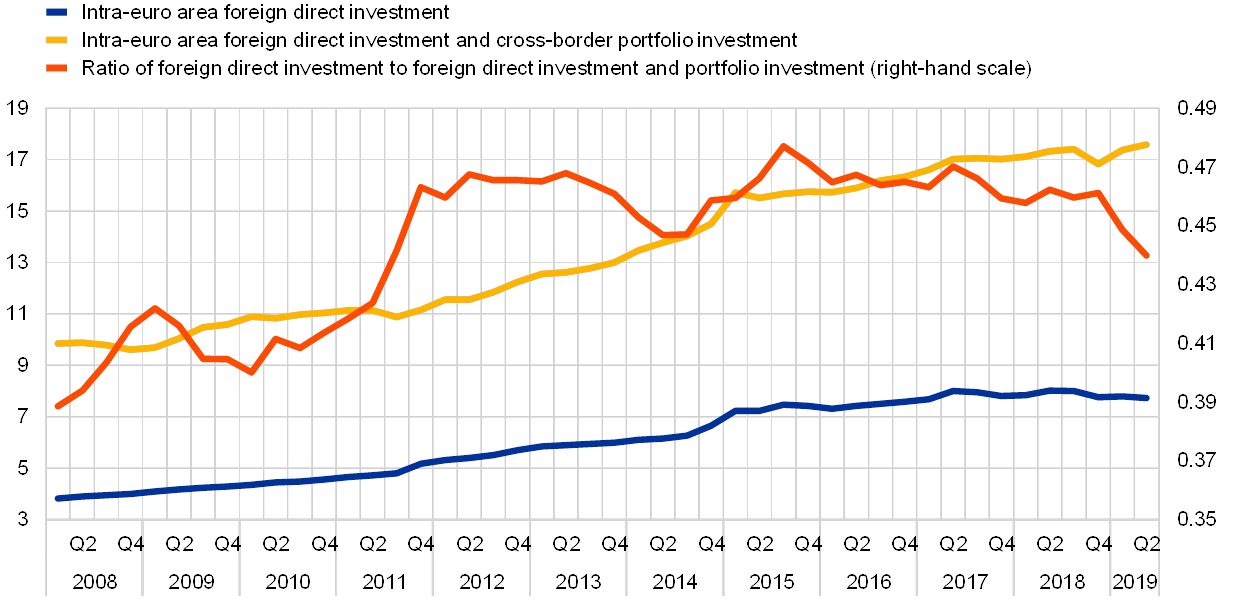
Source: ECB.
Notes: The blue line shows the total amount of intra-euro area foreign direct investment. The yellow line shows the evolution of the sum of intra-euro area foreign direct investment and intra-euro area cross-border portfolio investment. The red line shows the ratio of the two.
Finally, the composition of intra-euro area foreign bank lending remains skewed towards wholesale lending. As shown in Chart 24, cross-border direct lending to households and NFCs (excluding lending by local branches and subsidiaries of foreign banks) still accounts for a small share of total foreign bank lending in the euro area. Although foreign bank lending has been rising overall, it is still below 1% and a decrease is visible over the past few quarters.
Chart 24
Direct foreign bank lending to households and NFCs still plays a very limited role
(left-hand scale: EUR trillions; right-hand scale: ratio; Q1 1999 – Q2 2019)

Source: ECB.
Notes: The blue line shows the total amount of intra-euro area cross-border bank lending to households and NFCs, i.e. retail bank lending. The yellow line shows the total amount of intra-euro area cross-border lending between MFIs, i.e. interbank lending. The orange line shows the ratio of the two. For more discussion on the interpretation of these indicators, see Special Feature A “Financial integration and risk sharing in a monetary union” in the 2016 ECB report on “Financial integration in Europe”.
Ultimately, a high “enough” degree of financial integration and financial resilience, in terms of both quantity and quality, will be required to pursue more genuine finance-based risk sharing in the euro area (see next Box 5).
Box 5
On the measurement of risk-sharing in the euro area
There is a rich literature investigating the benefits of developed and integrated financial markets for, among other things, insulating private consumption from shocks to domestic income, referred to as “risk sharing”. In an international context, this is denoted as cross-country risk sharing, although this stabilisation property is also relevant for federations and monetary unions. Starting from the two seminal papers by Lewis (1996)[78] and Asdrubali et al. (1996)[79], the literature has over time crystallised two distinct but complementary approaches for assessing the extent of risk sharing, i.e. the extent to which private consumption is decoupled from aggregate output dynamics. The first approach by Lewis (1996) is operationalised by Sorensen et al. (2006) who estimate the degree of risk sharing by regressing changes in consumption on changes in GDP and test whether a country's consumption growth is uncorrelated with its GDP growth. The second approach by Asdrubali et al. (1996) – later refined in Sorensen and Yosha (1998)[80] – relies instead on a decomposition of the cross-sectional variance of shocks to GDP that closely follows the structure of national accounts. This approach makes it possible to investigate the various channels through which consumption can be smoothed inter-temporally, i.e. via capital markets, credit markets, and international transfers.
Enhancing risk-sharing is particularly important for the European EMU. As EMU is still incomplete, though advancing in terms of governance, it suffers from distinct frictions and fragilities. Early papers on risk sharing in the euro area have shown that risk sharing increased considerably following the launch of the euro (see Demyanyk et al., 2008).[81] After the recent financial crisis, many authors have re-investigated the matter with rather mixed results. Cimadomo et al. (2018)[82] find that following the launch of the euro only about 40% of country-specific output shocks were smoothed, while in the aftermath of the euro area crisis this share increased to about 65%. According to the authors, the main drivers of such higher shock-absorption capacity were higher overall financial integration, but also the financial support provided by new European tools like the European Stability Mechanism (ESM) to countries undertaking an adjustment programme, which allowed these countries to achieve a higher degree of public risk sharing. Based on a similar set of countries, Milano (2017)[83] also finds that lending by European tools like the ESM has a positive effect on consumption risk sharing in the euro area. Contrary to these studies, Kalemli-Ozcan et al. (2014)[84] show that risk sharing turned negative during the crisis because (conditional on world consumption growth) the decline in GDP in 2010 was accompanied by a more than proportional decline in consumption in euro area countries. Similarly, Alcidi et al. (2017)[85] also find only very limited cross-country risk-sharing capacity in the euro area (due to a high and heterogeneous persistence of shocks, combined with systematic under-performance and over-performance of certain euro area countries).
Against the background of such differential results about the extent of risk sharing in the euro area, this box provides an initial investigation of several factors at play. The preliminary nature of the findings warrants further investigations as to whether differences in country samples, time windows, and methodological approaches affect these estimates. Overall, the initial findings presented in this box suggest that the risk sharing in the euro area is currently rather limited, as pointed out in previous editions of the ECB Financial Integration Report.
As a start, we consider a quarter-by-quarter cross-sectional regression of consumption growth on output growth. Using a similar methodology to that followed in the Financial Integration Reports for 2016 and 2018, based on the Lewis (1996) approach, Chart A (left-hand side) plots the contemporaneous correlation between domestic GDP growth and domestic consumption growth for a panel of EA12 countries, over rolling 12‑quarter windows.[86] Based on this analysis, we fail to reject the hypothesis of perfect risk sharing in the euro area in the most recent period: even though the correlation between domestic consumption and GDP growth is slightly above zero for the most recent period, it is statistically indistinguishable from zero at the 95% confidence level. This is a visible reversal of the trend during the period of the global financial crisis and the sovereign debt crisis: i.e. when the data soundly rejected the null hypothesis of perfect risk sharing in the euro area. Arguably, the data sample used is limited (also due to the exclusion of Ireland, given the large GDP revisions in 2016 and large impact on GDP developments of a limited number of big economic operators)[87], but it still makes it possible to measure the extent of risk sharing in the EMU consistently, without being influenced by new countries joining the monetary union. When considering all current countries in the EMU (18, still excluding Ireland) over the same period, the correlation is still slightly above zero but appears to be statistically distinguishable from zero at the 95% confidence level for most of the time period in question (see Chart A, right-hand side). While further analysis is needed to understand the drivers of these differences, the conflicting results are not so surprising considering the impact that adopting the euro had on countries’ financial and trade flows.
Chart A
Correlation of consumption and output in euro area countries
(quarterly data; Q3 2004 – Q1 2019)
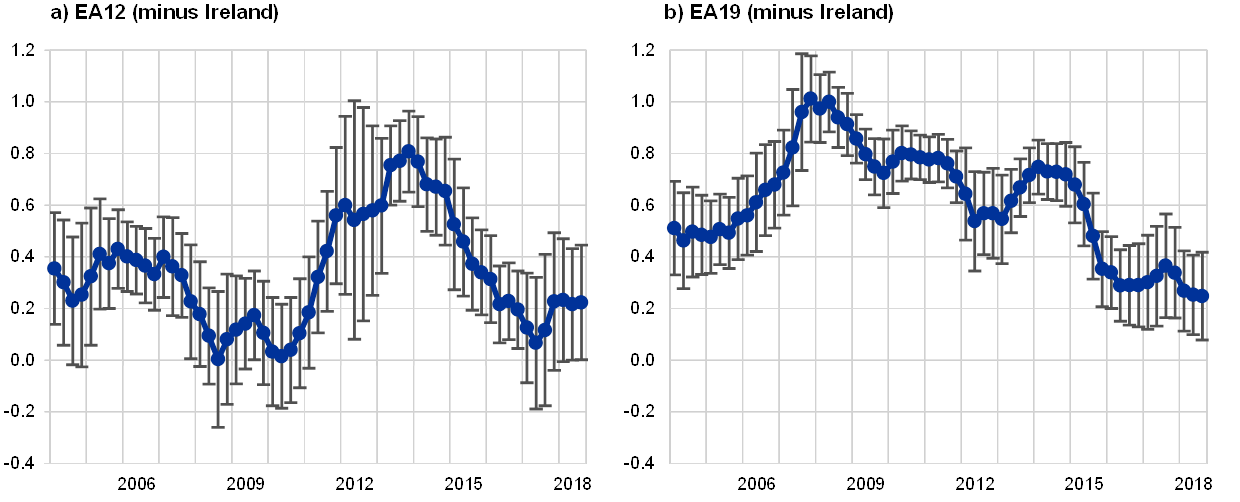
Sources: ECB and ECB calculations.
Notes: The chart plots point estimates (dots) and confidence intervals (whiskers) from a panel regression of changes in country per capita consumption on changes in country per capita GDP. Each dot and whisker is estimated for data from the twelve quarters preceding the time indicated on the horizontal axis (rolling window).
Against this background, it is important to analyse which factors support or hinder risk sharing when looking at the cumulative effect of the various underlying channels. Given the transformations and shocks in the euro area economy and financial system, and the paucity of observations, it is essential to proceed with caution. Following the approach developed in previous Financial Integration Reports, we first provide updated results using the framework by Asdrubali and Kim (2004) enhanced for relative price adjustments and applied to a panel of EA12 countries (again, excluding Ireland), over rolling 10‑year windows. The results are reported in Chart B and suggest that the contribution of each channel to the risk sharing in the euro area has remained broadly stable over the past several years. The capital channel – primarily via the cross-border ownership of productive assets and labour income from abroad (cross-border wage payments) – cumulatively smooths around 15% of a shock to country-specific GDP (see dark blue bar). The contribution of the fiscal channel – via cross-border transfers to both individuals and governments, such as remittances and EU structural funds – is negligible (red bar). As for the contribution of the credit channel – via cross-border borrowing and lending by both individuals and governments – it is negative, albeit less so than during the period of the financial crisis (yellow bar).[88] Last, a price channel (green bar) is also at work to support the smoothing of idiosyncratic shocks (as discussed in the Financial Integration Reports 2016 and 2018, and in Asdrubali et al., 2018). This channel also smooths around 15% of a country-specific shock to GDP. At the same time, a separate analysis shows complex interactions between the price channel and the other risk-sharing channels, suggesting the need for further investigation.
Chart B
Consumption risk-sharing in the EA12 (minus Ireland) and its channels
(percentages)
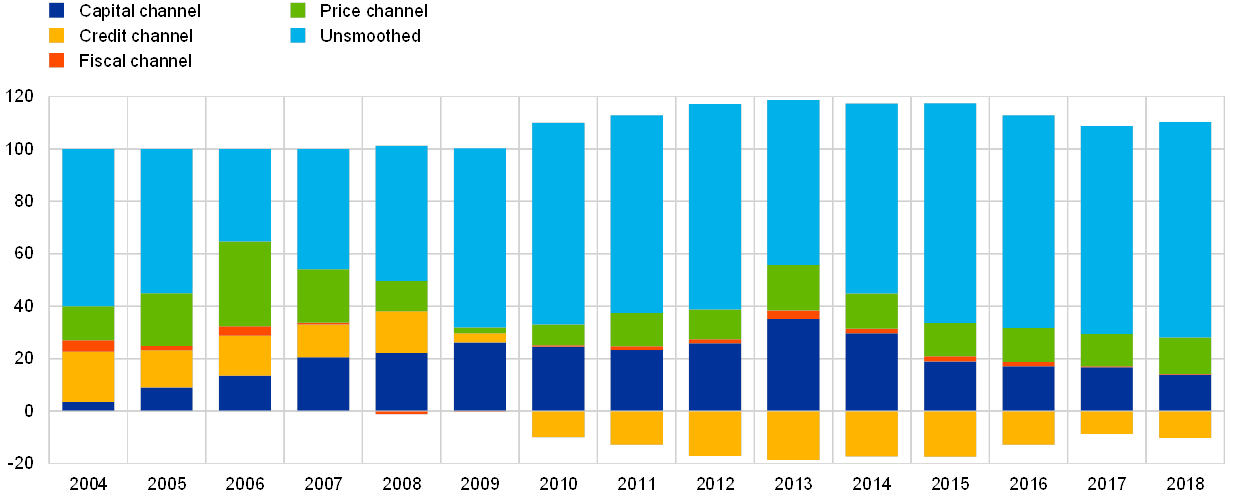
Source: ECB calculations.
Notes: The chart displays, by year, the contribution of capital markets (via cross-border ownership of productive assets), credit markets (via cross-border borrowing and lending), fiscal tools (via public cross-border transfers), and relative prices (via changes in the domestic consumer price index relative to the euro area average index) to the smoothing of country-specific shocks to real GDP growth. The respective contributions are calculated using a vector-autoregression (VAR) model whose parameters are estimated over a ten-year rolling window of annual data, applying the Asdrubali and Kim (2004) approach enhanced for relative price adjustments. The bars display the share of a one-standard-deviation shock to domestic GDP growth that is absorbed by each respective risk-sharing channel. The shares are computed on the basis of the cumulative impact of the shock on the variables capturing each risk-sharing channel over a five-year horizon. Year-to-year variations in the shares reflect changes in the re-estimated model parameters. The remaining portion represents the portion of the shock to country-specific real GDP growth that remains unsmoothed and is fully reflected in country-specific consumption growth. The individual bars may fall below 0% if one or more of the channels involved has a dis-smoothing effect on country-specific consumption growth. All bars together total 100%.
Slightly changing the specification of the above approach and enlarging the set of countries in the sample affects the results. When the sample is enlarged to include all current euro area countries, while still excluding Ireland, and the price channel is removed, a slightly different picture emerges. While this specification benefits from an increased sample size, it considers euro area countries and countries jointly before their actual adoption of the euro. Chart C shows that a large part of the shocks still remains unsmoothed, although the unsmoothed component is higher than in the previous chart. The capital channel smooths around 8‑10% of a shock to country-specific GDP cumulatively over the five years following the shock. The contribution of the fiscal channel remains negligible. The contribution of the credit channel is above 12% and rises in the most recent sub-period.
Chart C
Consumption risk-sharing in the EA19 (excluding IE) and its channels
(percentages)
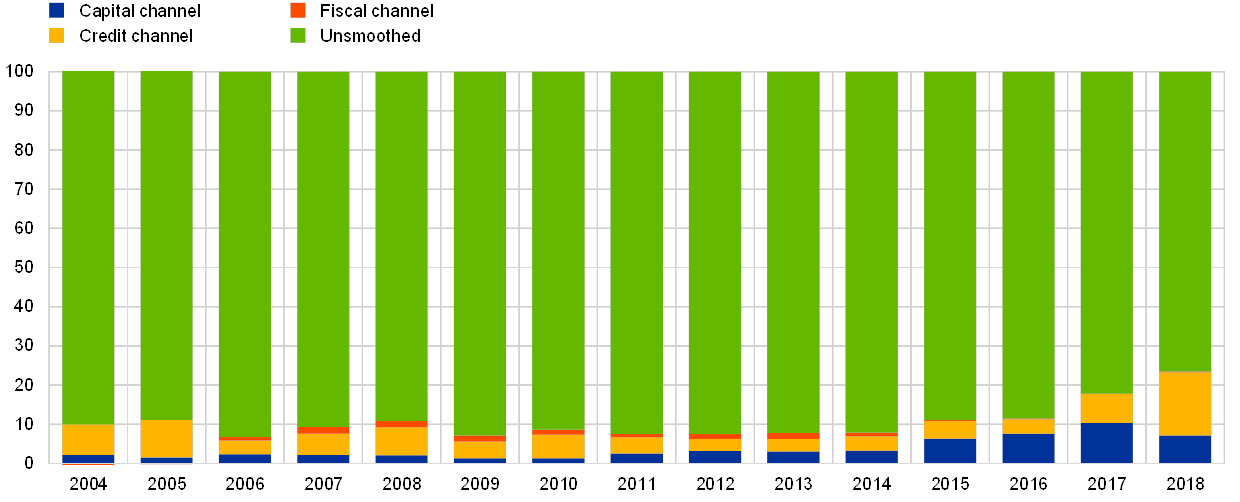
Sources: ECB and ECB calculations.
Notes: The chart displays, by year, the contribution of capital markets (via cross-border ownership of productive assets), credit markets (via cross-border borrowing and lending), and fiscal tools (via public cross-border transfers) to the smoothing of country-specific shocks to real GDP growth. The respective contributions are calculated using a vector-autoregression (VAR) model whose parameters are estimated over a ten-year rolling window of annual data, applying the Asdrubali and Kim (2004) approach enhanced for relative price adjustments. The bars display the share of a one-standard-deviation shock to domestic GDP growth that is absorbed by each respective risk-sharing channel. The shares are computed on the basis of the cumulative impact of the shock on the variables capturing each risk-sharing channel over a five-year horizon. Year-to-year variations in the shares reflect changes in the re-estimated model parameters. The remaining portion represents the portion of the shock to country-specific real GDP growth that remains unsmoothed and is fully reflected in country-specific consumption growth. The individual bars may fall below 0% if one or more of the channels involved has a dis-smoothing effect on country-specific consumption growth. All bars together always total 100%.
Given the important differences in the findings presented, some caution is needed in interpreting them and in distilling the messages from the risk-sharing literature. A better understanding of the underlying set of data and the nuances of the two approaches is required. Despite the fact that the above approaches constitute the state of the art in the academic literature, they still have various shortcomings. The approach by Lewis (1996), for instance, ignores many interfering factors and the approach by Asdrubali et al. (1996) is rather inflexible given its strong reliance on the structure of national accounts. These problems seem to lead to robustness issues in the measurement of risk sharing. Moreover, the last ten years have been momentous for the euro area and the role of exceptional policies also needs to be better understood. Therefore, care should be taken in interpreting the diverse risk-sharing channels and further robustness analyses are needed.
All in all, risk sharing in the euro area remains at relatively low levels and is unstable over time. Most studies assessing the current extent of risk sharing among euro area countries conclude that it is rather low – at least compared with the risk sharing typically observed across regions or states within a single country or federation. As documented in this section, intra-euro area cross-border lending is modest and cross-country asset ownership is rising – but slowly. Moreover, discussions on establishing a genuine fiscal capacity for the euro area have stalled and the limited size of the EU budget does not allow scope for playing a meaningful stabilisation role. All this poses challenges for macroeconomic stabilisation in the euro area. While further work is needed to develop and refine the methodologies for estimating risk sharing, the evidence gathered in this section and the overall low and unstable level of risk sharing in the euro area clearly indicates the need to complete the banking union as well as to advance the European CMU.
4.2 Credit markets
4.2.1 Money markets
The increased supply of reserves by the Eurosystem had mixed effects on the integration of money markets. On the one hand, the asset purchase programme (APP) contributed to the contraction of interbank trading activity between euro area banks as the injection of excess reserves reduced counterparties’ need for cash. On the other hand, the targeted longer-term refinancing operations (TLTROs) and the securities lending programme helped to ease funding conditions and support repo market activity. Hence, while unsecured trading volumes decreased, funding rates converged. This means that although banks are less connected, they face more analogous conditions across the euro area.[89]
The unsecured and secured segments of money markets have not uniformly responded to an environment characterised by excess liquidity and regulatory changes. The decline in turnover in the unsecured segment was driven by the ample liquidity injection, reducing the need for interbank cash funding, as well as aversion to counterparty credit risk and regulation, further disincentivising risk-taking. A new development over the review period is that the share of non-banks lending cash to euro area banks has increased, which does not indicate a recovery of money market activity or a sign of financial integration, but rather the joint effect of a mechanical redistribution of liquidity caused by the APP and the fact that these non-banks are not allowed to deposit cash at the Eurosystem (Chart 25). With regard to prices observed in the unsecured segment, downward pressure on rates and spread compression continue to be observed. The spread between the three-month EURIBOR and overnight index swap (OIS) rates is a particularly relevant parameter for financial integration, as it is an indicator of how credit and liquidity risks are perceived and therefore of tensions in money markets[90]. Since 2017 it has returned in pre-crisis levels, illustrating how the provision of long-term central bank funding may have strengthened the confidence of investors and depositors and helped banks to regain access to financing (Chart 26). The favourable rate for TLTROs supported mostly the non-core banks with higher take-ups, thus favouring a convergence in funding costs for all banks in the euro area.
Chart 25
Other sources of funding in the euro area
(sources of unsecured borrowing; in percentages)
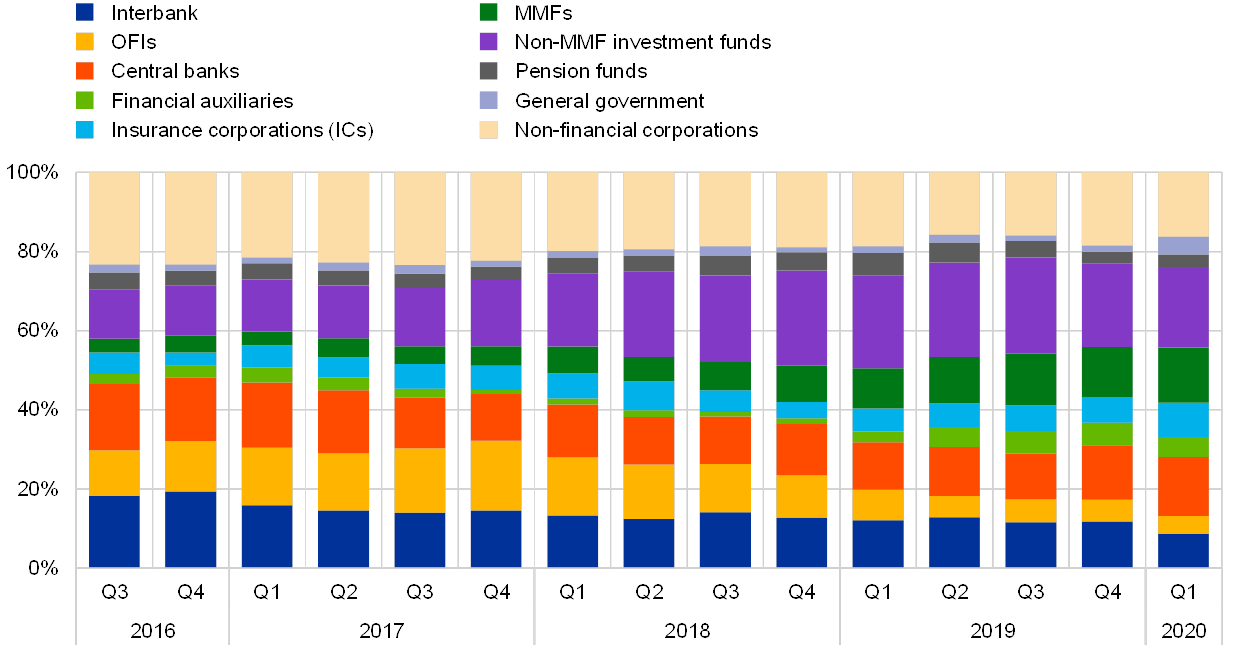
Sources: MMSR, ECB calculations.
Chart 26
3‑month EURIBOR and three-month OIS rates
(three-month EURIBOR, three-month OIS rates and their spread)
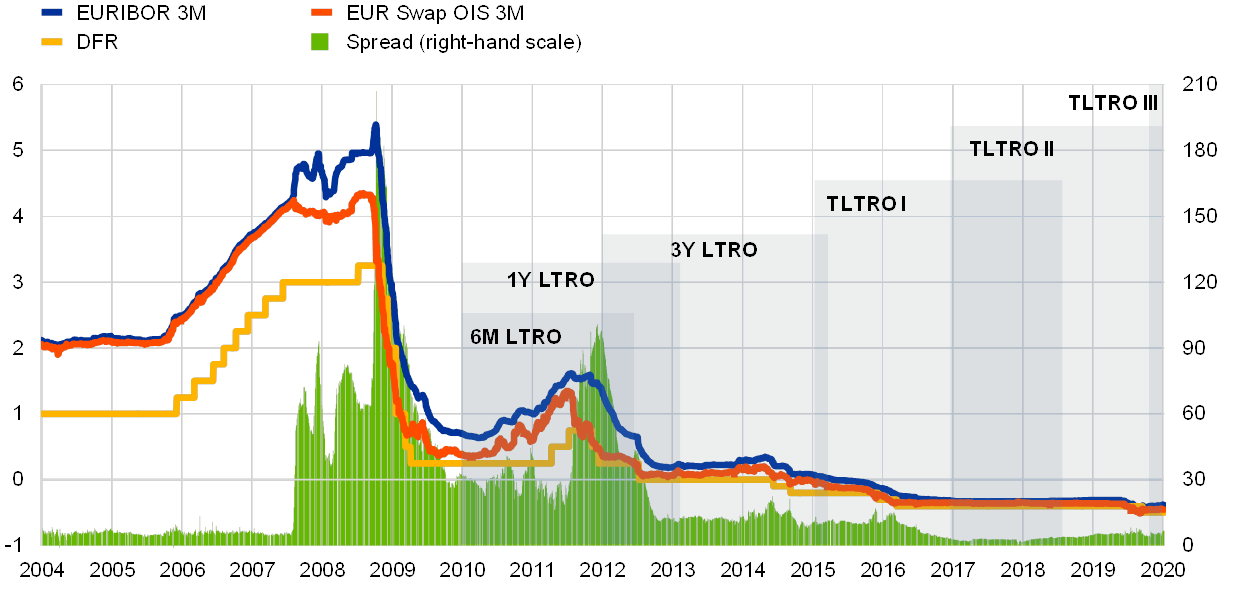
Sources: Bloomberg, ECB calculations.
In the secured segment, the ample liquidity situation has also reduced the need for cash funding, while regulation has increased demand for high quality liquid assets (HQLA). This has transformed the repo market from a platform for cash exchange to one for collateral exchange. Chart 27 illustrates how the reduced need for short-term funding in an environment of excess liquidity implies that banks have fewer incentives to conduct general collateral (GC) repo transactions, which are frequently used for cash management.[91] Simultaneously, due to regulatory requirements, the demand for HQLA government bonds has grown significantly, amid lower availability of marketable HQLA due to the APP. As a result, counterparties seeking a specific security (special collateral – SC) agree on a repo rate that is well below the deposit facility rate (DFR), pricing in its scarcity.
Prices in the secured segment exhibit differentiation depending on the collateral issuer, especially for the highest quality and most liquid assets, which should not, however, be attributed to fragmentation. For the ECB, the interbank market would continue to be considered fragmented if potential participating banks were not treated equally when active in the market, despite having similar risk profiles. Chart 28 shows that the overnight borrowing costs for repo transactions backed by collateral issued in core countries with better ratings and macroeconomic outlooks (like Germany, the Netherlands and France) are lower than for non-core countries (such as Italy or Spain). As a result, the ongoing dispersion in rates should be seen as reflecting different pricing for risk differentiation based on collateral parameters, such as ratings or macroeconomic outlook. Moreover, in the period under review, a modest narrowing of the spread between repo rates and the ECB’s DFR, in particular for core country collateral, was observed in a stable rating outlook environment. By increasing the effective supply of securities that are in high demand, the securities lending programme helped to address potential collateral shortages in the system.
Chart 27
Excess liquidity and the transformation of the secured market
(y-axis: GC secured volumes (left-hand scale); SC secured volumes (right-hand scale); x-axis: excess liquidity; EUR billions)

Sources: Bloomberg, ECB calculations.
Chart 28
Weighted average borrowing rates by location of collateral issuer
(cash borrowing against collateral in percentages)

Sources: MMSR, ECB calculations.
Notes: One-day rates (overnight, spot/next, tomorrow/next). Spain and Italy are depicted jointly to comply with confidentiality rules.
The introduction of the two-tier system for the remuneration of excess reserve holdings had so far not had a material impact on money market rates, despite a redistribution of excess reserves between euro area banks aimed at exploiting their exemption allowances. When the two-tier system became effective on 30 October 2019[92], it triggered some swift cross-border liquidity flows in the repo segment, especially towards Italy, but no material impact was observed on rates except on isolated dates. In the unsecured segment, additional lending was predominantly provided by domestic counterparties. This might suggest a lack of willingness to lend cross-border and therefore money market integration still being imperfect. All in all, the upward pressure on the overnight rates remained small.
Box 6
What payment systems reveal about financial integration[93]
The intertemporal analysis of payment networks in Europe provides an interesting perspective for monitoring financial integration. Payment networks arise when financial institutions, and in particular banks, make payments to each other.
The core of the euro-denominated payment networks is the TARGET2 system,[94] which went live in 2007 with the stated objective of enhancing European financial integration. By creating seamless and direct links among all of the main European banks, TARGET2 has made it possible to settle payments with the same ease, whether they are among domestic entities or between domestic and cross-border entities.
Payment system networks are characterised by nodes and links. In TARGET2, the nodes are the banks participating in the system. A link exists between two nodes if the two banks exchange payments. In any network, groups of nodes labelled “communities” may be identified according to various criteria. One criterion consists in clustering the nodes (i.e. the banks) by their nationality, and then focusing on “national communities.” For example, groups of German banks or groups of French banks. Another criterion consists in identifying communities that maximise “modularity” which measures how intensely the nodes of the community interact with one another (i.e. exchange payments) as opposed to the rest of the network. In “modularity communities” the density of the links (i.e. the number of links) among the nodes of the same community is greatest. Financial integration may be monitored by contrasting developments in modularity communities with developments in national communities.
The analysis of the developments observed from 2008 to 2018 in the structure of such networks confirms that financial integration across TARGET2 banks has materially increased over the past ten years. Chart A depicts TARGET2 payment networks in 2008 (left panel) and in 2018 (right panel). The nodes are represented by the coloured dots, the national communities are represented by the groups of coloured dots, and the modularity communities are made of dots of the same colour. If all the dots in a group have the same colour, e.g. a group of green dots, and there are no dots of that colour outside that network, e.g. all green dots are in that group, it means that the national community and the modularity community coincide, so that the banks of that green national community exchange payments primarily with each other. From the visual comparison of the left and right panels it can be seen that in 2008 national communities largely overlapped with modularity communities. By contrast, in 2018 the mix of colours within most national communities – stemming from a higher density of links among the nodes of different nationalities – reflected increased financial integration. This is formally confirmed by the results shown in Chart B.
Chart A
TARGET2 bank network in 2008 and 2018
2008

2018

Sources: TARGET2 and ECB calculations.
Chart B, in the left panel, shows two measures characterising the networks among TARGET2 bank communities. The dotted yellow line depicts the intertemporal evolution of national communities’ modularity (reflecting the density of interactions among banks within the same national community) compared with the density of the interactions the same banks have with the rest of the network. The fact that it trends downwards means that the relevance of the interactions within the same national community has been diluted over time to the benefit of increased interactions across national communities. The dotted blue line depicts the intertemporal evolution of an index gauging the similarity between national communities and modularity communities. The fact that it too trends downwards indicates that these two types of communities have become increasingly dissimilar over time. Whereas in 2008 the modularity communities characterising the structure of TARGET2 were primarily nationally anchored, in 2018 those modularity communities included banks of different nationalities as a result of the progressive integration of banks located across borders.
Over the past ten years, the number of relationships that TARGET2 banks maintain with banks within the same national community has steadily decreased, while the number of relationships they have with banks of other national communities has increased. This is shown in the right panel of Chart B by the blue dotted line – reflecting the degree of link density within communities – which declines as a result of the progressive decline in the density of relationships within national communities. Instead, the yellow dotted line – reflecting the degree of link density across communities – trends upwards as a result of the expansion in the density of relationships across national communities.
Chart B
Measures of TARGET2 bank networks (left panel) and density of national versus cross-border relationships among TARGET2 banks (right panel)
(y-axis: indices; x-axis: years)
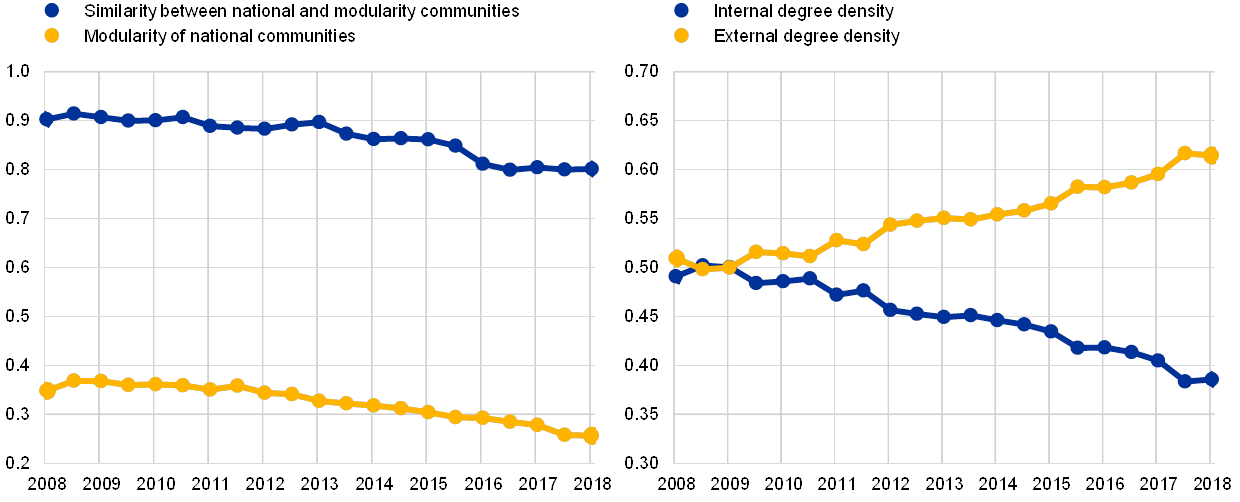
Sources: TARGET2 and ECB calculations.
Notably, the rise in the number of payment relationships across European banks occurred independently of national consolidation processes, which may have reduced the number of relationships within the affected national communities. It is also independent of new subsidiaries that banking groups may have in different countries. In fact, banking groups have progressively consolidated the management of their payments so that the TARGET2 accounts originally opened by subsidiaries abroad have been closed in favour of directly using the TARGET2 account of the parent company.
An open question for future research is how the robustness of today’s TARGET2 payment networks to adverse shocks and contagion compares with pre-crisis network structures. At this stage, the decline in the modularity of today’s bank communities can already be considered a sign of increased resilience.
4.2.2 Retail banking markets
The integration of retail banking markets is characterised by three contrasting developments. First, while domestic intra-euro area loans still represent the bulk of loans granted, the share of cross-border intra-euro area loans has risen over the review period (Chart 29). Second, the stock of total loans, as a share of nominal GDP, has somewhat declined since 2014, though posting a small rebound in 2019. Third, the dispersion of MFI interest charged on new loans, where a two different pictures emerge for NFCs and for households. The dispersion of MFI interest on new loans to NFCs has declined to pre-crisis levels since 2013 and has wavered at low levels over the review period. No doubt this pricing is benefiting from accommodative non-standard monetary policy measures (especially TLTROs and especially for banks in non-core countries). The dispersion of MFI interest on new loans to households is more nuanced however (Chart 31). While dispersion of mortgage loans has been declining, that of consumer credit has not and remains at high levels.
Chart 29
Stock of loans in the euro area and domicile of financing provider
(left-hand scale: EUR trillions; right-hand scale: %; 1999 to 2019)
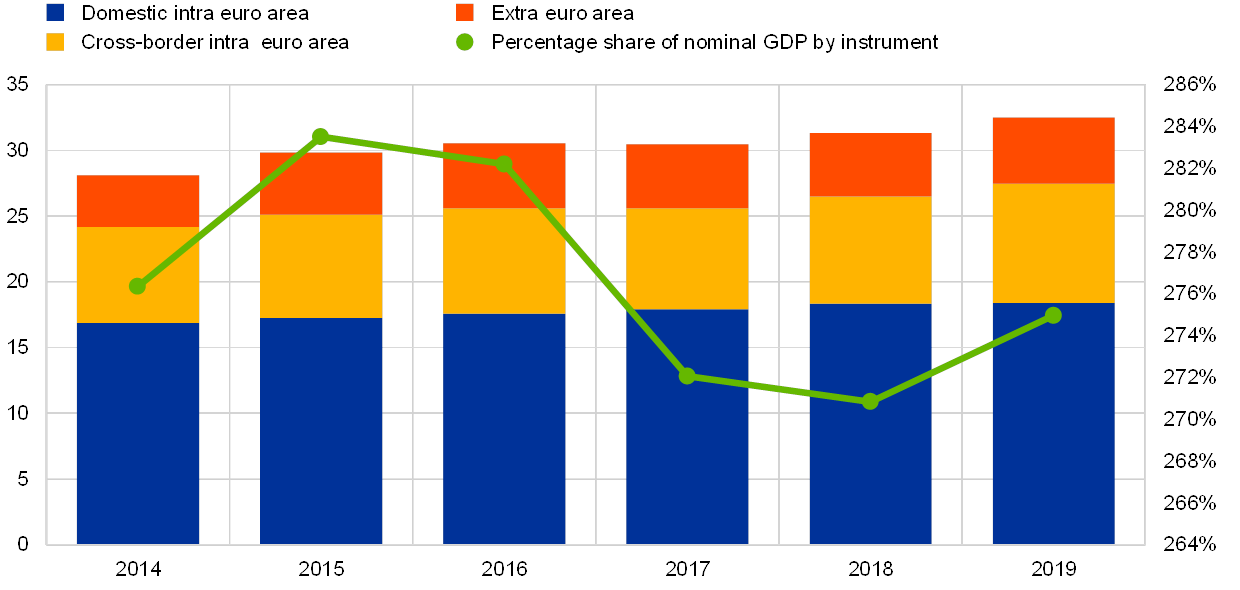
Source: ECB.
Note: The stock of loans for year 2019 refers to Q3 2019 values. Annual GDP for the year 2019 is calculated as the sum of quarterly nominal GDPs from Q4 2018 – Q3 2019.
Chart 30
Cross-country standard deviation of MFI interest rates on new loans to NFCs
(basis points, monthly data, January 2003 – November 2019)
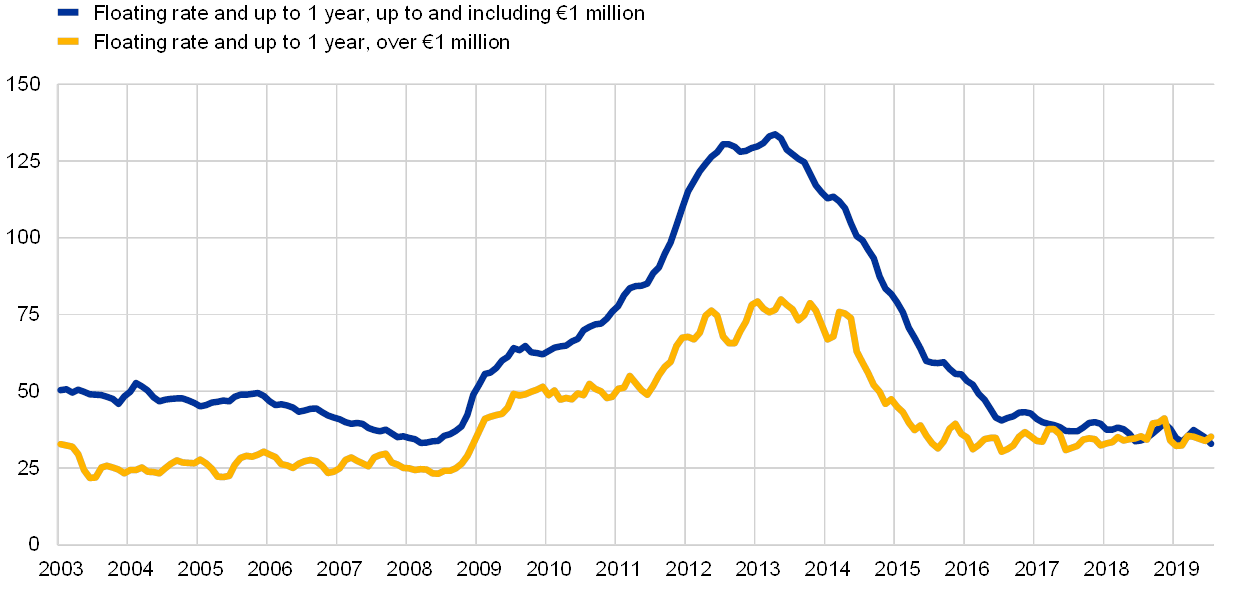
Source: ECB.
Chart 31
Cross-country standard deviation of MFI interest rates on loans to households
(basis points, monthly data, January 2003 – November 2019)

Source: ECB.
The latter may be the result of loans for consumer credit, which are less secure than mortgages, reflecting differences in domestic credit standards of both lenders and recipients. Hence, low integration in this segment might reflect some heterogeneous developments across countries. On the household side, the balance sheet strength of households remains dispersed and substantial cross-country differences in unemployment rates exist. On the banking side, since mid‑2017 banks in most countries have witnessed a moderation in the balance sheet repair process that started in 2014. This was due to a slowdown in improvements in asset quality, largely attributable to remaining legacy issues regarding NPLs. Differences across countries can also be partly explained by the uneven phasing-in of regulatory requirements, as well as a slowdown in the balance sheet repair process.[95]
Another development is that banks themselves use direct market financing: conditions in euro area bank bond markets have continued to improve significantly since the beginning of 2019, making debt security issuance a viable funding alternative to central bank financing in several jurisdictions. Structural challenges related to low profitability and weak market valuations are likely to constrain banks’ intermediation capacity should economic conditions deteriorate. Yet normative and regulatory pressures are biting, and profitability is still low. Clear signs of deleveraging, with a rise in direct financing, are also a noteworthy development. Banks are among the intermediaries of this process. Finally, considerable heterogeneity remains across euro area countries, also in the ability of their banks to pass on negative rates to NFC depositors.
4.3 Securities markets
4.3.1 Bond markets
The stock of debt securities in the euro area, as a percentage of GDP, continued on its declining trend in 2017 and 2018, but rebounded over the course of 2019 (see Chart 32).
Chart 32
Stock of debt securities in the euro area and domicile of financing provider
(left-hand scale: EUR trillions; right-hand scale: percentages; 2014‑2019)

Source: ECB.
Notes: The stock of debt securities for year 2019 refers to Q3 2019 values. Annual GDP for the year 2019 is calculated as the sum of quarterly nominal GDPs from Q4 2018 – Q3 2019.
In terms of remuneration, euro area government bond markets showed a continued convergence of yields for most countries over the reference period. The dispersion of government bond yields also declined in 2019 (Chart 33) as the spread between the sovereign bond yields of most non-core euro area countries and German government bond yields narrowed substantially, in particular for Portuguese government bonds. Greece increasingly regained market access, which was reflected in more issuances and the continued narrowing of its sovereign spreads. Spreads between Italian and German government bond yields widened in May 2018 and showed heightened volatility over the following months, leading to a temporary increase in the dispersion of euro area government bond yields (see Chart 33). Spillovers to other euro area countries’ bond spreads were limited. Subsequently, Italian spreads retrenched somewhat.
Euro area sovereign bond yields fell between Q3 2018 and Q3 2019 in the context of a weakening economic outlook. This decrease has been a generalised global phenomenon and not limited to Europe. Protracted weakness of the euro area economy and persistence of low inflation as well as downside risks justified further monetary easing, including a re-activation of net asset purchases by the ECB as from 1 November 2019. Concerns about a possible hard Brexit and increased global trade tensions, in particular between the United States and China, also contributed to the uncertainty and the decline in yields.
The fiscal outlook for several euro area countries improved and was followed by rating upgrades. The upgrade of credit ratings generally went along with a decrease in risk premia. Rating upgrades for Spain, Portugal and Greece were reflected in the narrowing of yield spreads with German government bonds. For example, Standard & Poor’s upgraded the ratings of Spain (to A from A‑ with a stable outlook) and of Portugal (to BBB from BBB‑ with a positive outlook) in 2019. Portugal was also upgraded by Moody’s in 2018 and by Fitch in 2017.
Chart 33
Dispersion of euro area ten-year sovereign bond yields
(percentages; monthly data, January 1990 – January 2020; left panel: 1990‑2020; right panel: 2017‑2020)
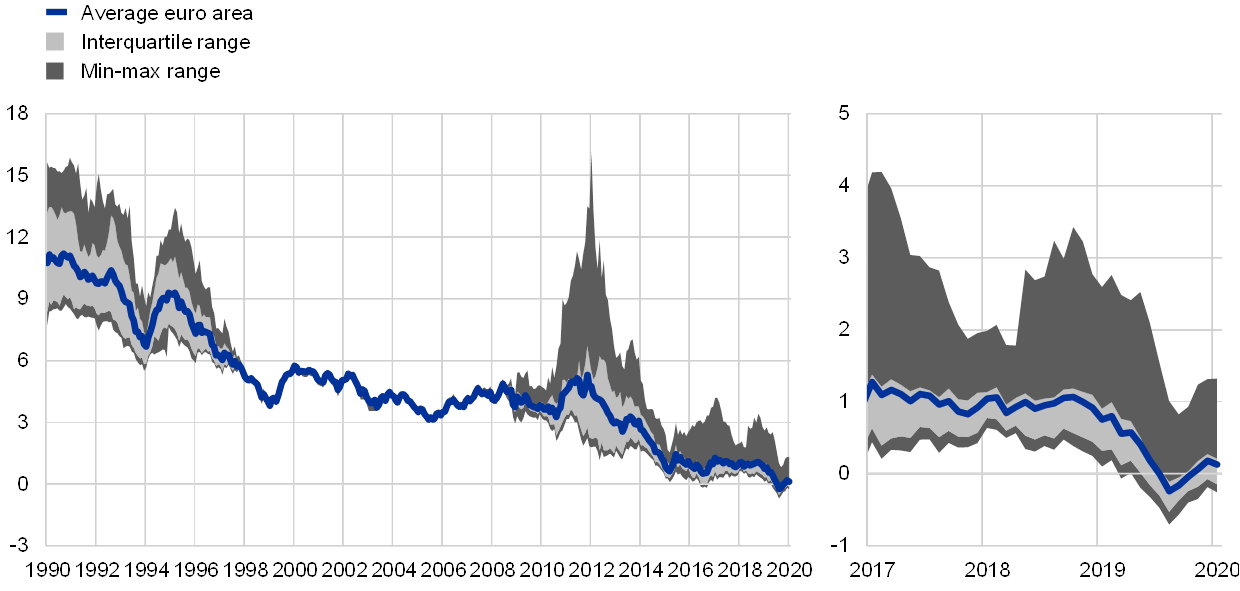
Source: ECB.
Notes: The stock of debt securities for year 2019 refers to Q3 2019 values. Annual GDP for the year 2019 is calculated as the sum of quarterly nominal GDPs from Q4 2018 – Q3 2019.
Within a monetary union, financial market integration is generally associated with resilience to country-specific idiosyncratic shocks. Resilience to idiosyncratic shocks reduces risk for investors, and therefore generally leads to lower risk premia. Instead, the continued dispersion of euro area government bond yields (see Chart 33) points to heterogeneity between countries, and possibly also to some degree of market fragmentation remaining.
The indicator depicted in Chart 34 provides a measure of integration in the euro area government bond markets, harnessing the explanatory power of common factor portfolios. For each calendar year, these portfolios are formed on the basis of a principal component analysis and used in a simple regression framework to explain bond market returns for each country. The measure is then computed as an average (median) R-squared across countries. In general, a higher figure indicates a more integrated market, where 1 implies perfect integration and 0 implies no integration. As shown in Chart 34, the indicator increased for both groups of countries in 2019 compared to its 2018 value. However, its value is still below the level observed during 2002‑07 (although these two periods are not directly comparable).
Chart 34
Equity and government bond market integration based on common factor portfolios
(annual data, 1989‑2017, as at September 2019)

Sources: Thomson Reuters and ECB calculations.
Note: The indicators are based on “Global market integration: An alternative measure and its application” by Kuntara Pukthuanthong and Richard Roll (Journal of Financial Economics, Volume 94, Issue 2, November 2009). The indicator measures integration in the euro area equity and government bond markets, harnessing the explanatory power of common factor portfolios. For each calendar year, these portfolios are formed on the basis of a principal component analysis and are used in a simple regression framework to explain equity and bond market returns for each country. The measure is then computed as an average (median) R-squared across countries. In general, a higher R-square figure indicates a more integrated market as the same factors are indeed able to explain returns across countries, where 1 implies perfect integration and 0 implies no integration or fragmentation.
MFIs’ holdings of debt securities are predominantly invested in domestic government and corporate bonds, at around 60% of total debt securities held by the MFIs in the euro area. The share of domestic government and corporate bonds has declined from its peak in 2013 (at 67%), as depicted in Chart 35, but remains high, indicating a continued strong preference for holding domestic assets. The shares of other euro area corporate bonds and other euro area government bonds remained broadly unchanged at 12% and 14%, respectively, while the share of debt securities from non-euro area EU countries was also stable at around 5%.
Chart 35
Share of MFI holdings of debt securities issued by euro area and EU corporates and sovereigns
(percentages of total holdings, excluding the Eurosystem, quarterly data, Q3 1997 – Q3 2019)
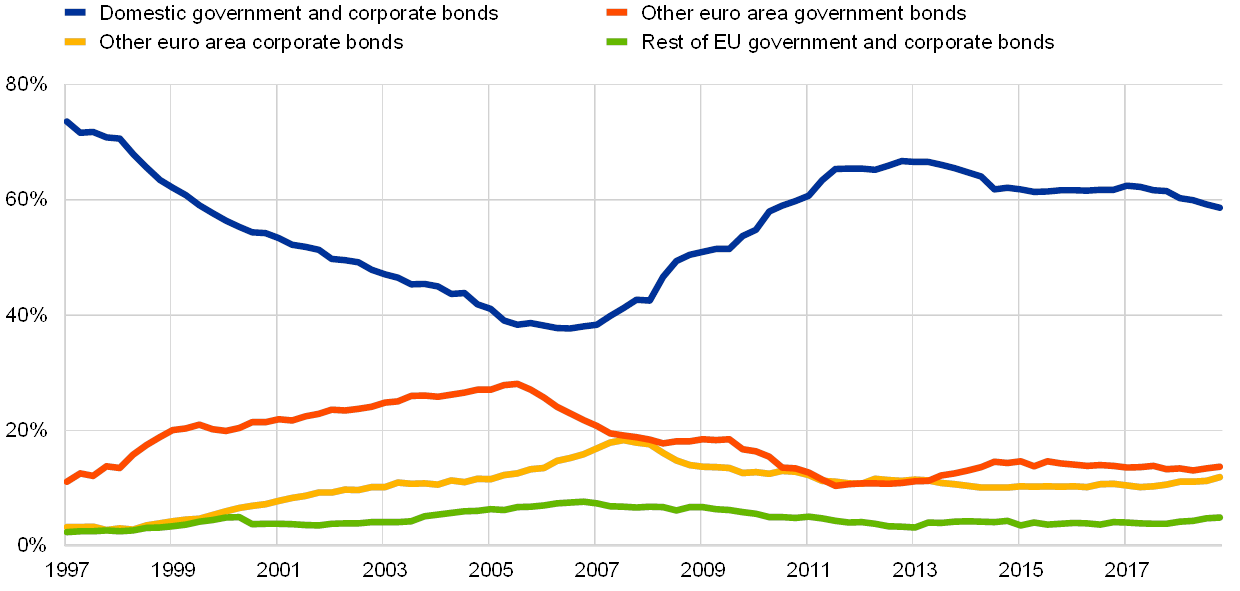
Source: ECB.
Over the past decade, investment funds located in the euro area have increasingly allocated funds to extra euro area debt securities, as shown in Chart 36. The increase in the share of investment funds’ portfolios allocated to extra euro area debt securities took place in the context of the low-yield environment in the euro area. Investment funds gradually reduced the share of euro area debt securities holdings from about 24% in Q1 2009 to about 11% in Q4 2017; this may be also seen in the context of the euro area sovereign debt crisis. Since Q4 2017, the share of domestically issued debt securities in investment fund portfolios has remained broadly unchanged at 11%. Similarly, the share of debt securities issued in other euro area countries declined from 48% in Q1 2009 to 33% in Q2 2019. The share of debt securities issued outside the euro area increased from 28% in Q1 2009 to 56% in Q2 2019. The changes in relative allocations in the last three years have been negligible.
Chart 36
Investment funds holdings of debt securities
(percentages of total holdings of debt securities, quarterly data, Q4 2008 – Q3 2019)
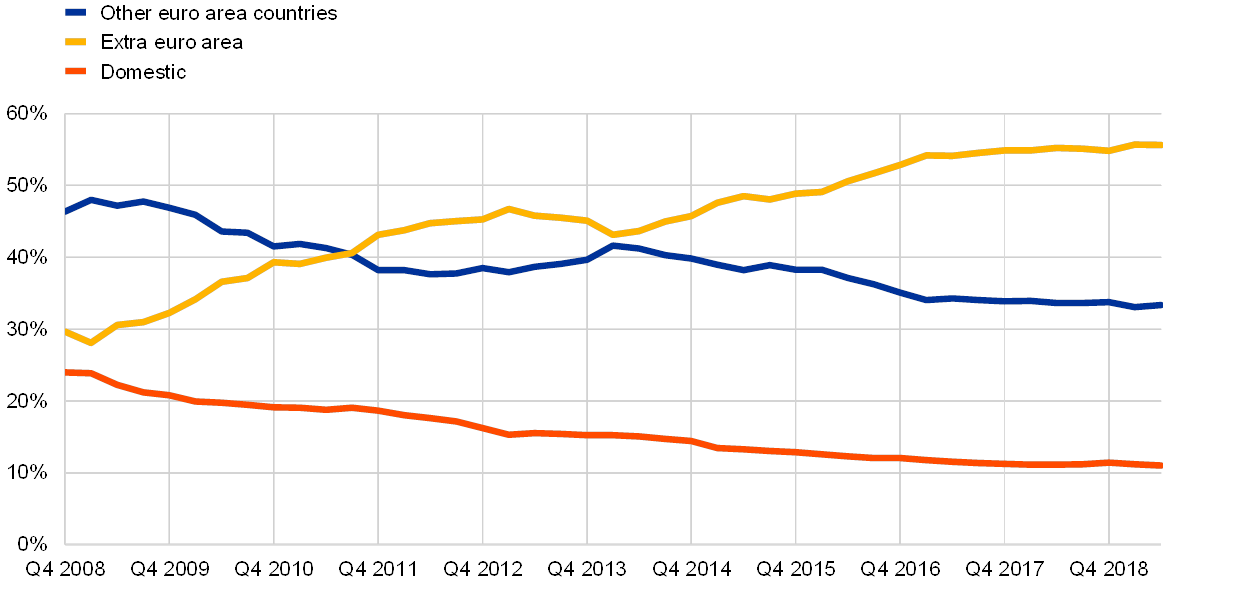
Source: ECB.
Notes Debt securities exclude shares and include money market paper held by investment funds located in the euro area. A complete list of investment funds is available from the ECB website.
Newly adopted European legislation aims to remove remaining cross-border barriers for investment funds. In April 2019, the European Parliament formally adopted the trilogue agreement on the European Commission's initiative to remove cross-border barriers to the residence of investment funds. In particular, the European Commission adopted two legislative proposals in early 2019; the first one on regulation aimed to align national requirements for the marketing of funds, regulatory fees, and the harmonisation of the requirements for the verification of marketing material by national competent authorities. The second legislative proposal was a directive aimed at harmonising the conditions under which investment funds may exit a national market and allowing European asset managers to engage in pre-marketing activities.
4.3.2 Equity markets
In terms of prices, euro area equity market returns appear to have become less dispersed across countries, also reflecting the prominent role of international drivers over the last years (Chart 37). Equity market dispersion, as measured by the absolute deviation of returns across national indices, has continued to decline on a country level and now stands close to pre-crisis readings. The reason for the decline in cross-country equity market dispersion – which is a sign of integration – may partly lie in the prominent role of international drivers that have impacted euro area equity markets across the board over the past two years. In particular, this period of time coincided with large and relatively significant fluctuations in economic and policy uncertainty, mainly driven by the ongoing US‑China trade negotiations and Brexit. The second indicator, pictured in yellow, is a sectoral indicator. It does not look at sector level equity price returns by country, but only at sector returns for the euro area overall index (e.g. it looks at euro area industrials as compared with all other euro area sectors, and it does not compare prices changes for Italian industrials to those for German industrials). This sectoral-level, euro area equity market dispersion remained rather flat, but also close to its pre-crisis lows. While a comparison of the absolute levels of both indicators is difficult, both should be tracked over time in comparison to each other.
Chart 37
Dispersion of returns in euro area Country and Sector equity price indices
(percentages, monthly data, January 1999 – August 2019)
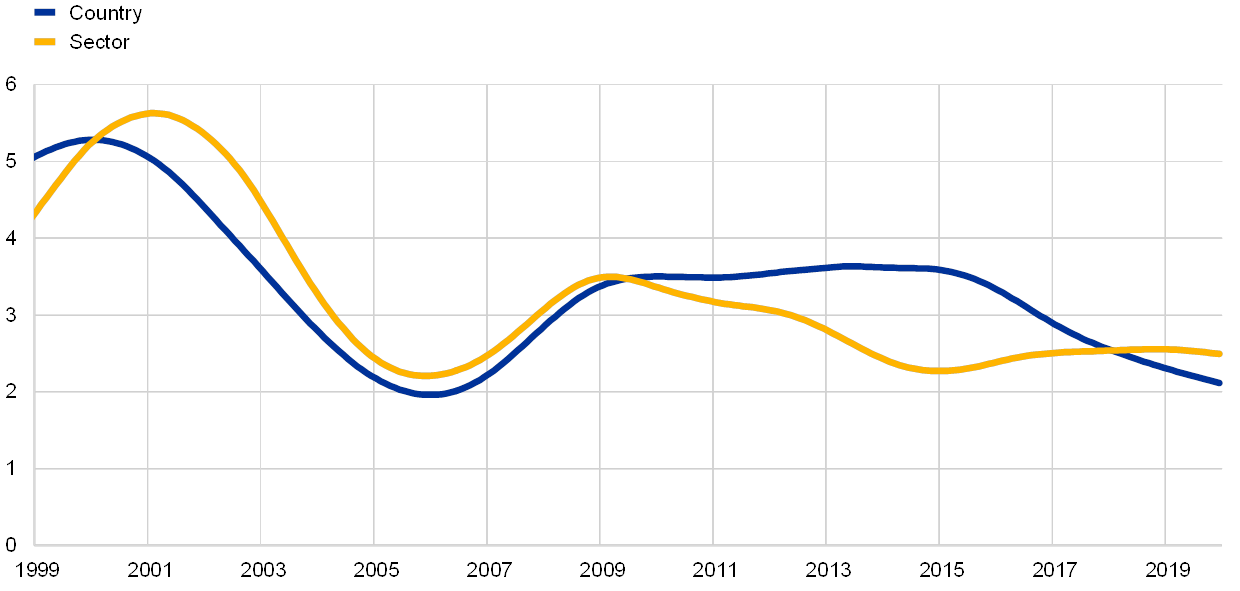
Sources: Thomson Reuters and ECB calculations.
Note: Euro-denominated (reinvested) dividends are included.
However, from a valuation perspective, euro area segmentation has increased (Chart 38). Equity market segmentation, as measured by the dispersion between the inverse of price-to-earnings ratios (rather than returns) across euro area countries, remained relatively low and stable during 2017, but increased thereafter. Much of the increase in segmentation reflects a deterioration of equity prices relative to earnings in Italy, i.e. an increase in the risk premia required by investors for holding Italian equity rather than equity listed in other euro area countries.
Chart 38
Segmentation in euro area equity market valuations
(monthly data, January 1995 – December 2019)
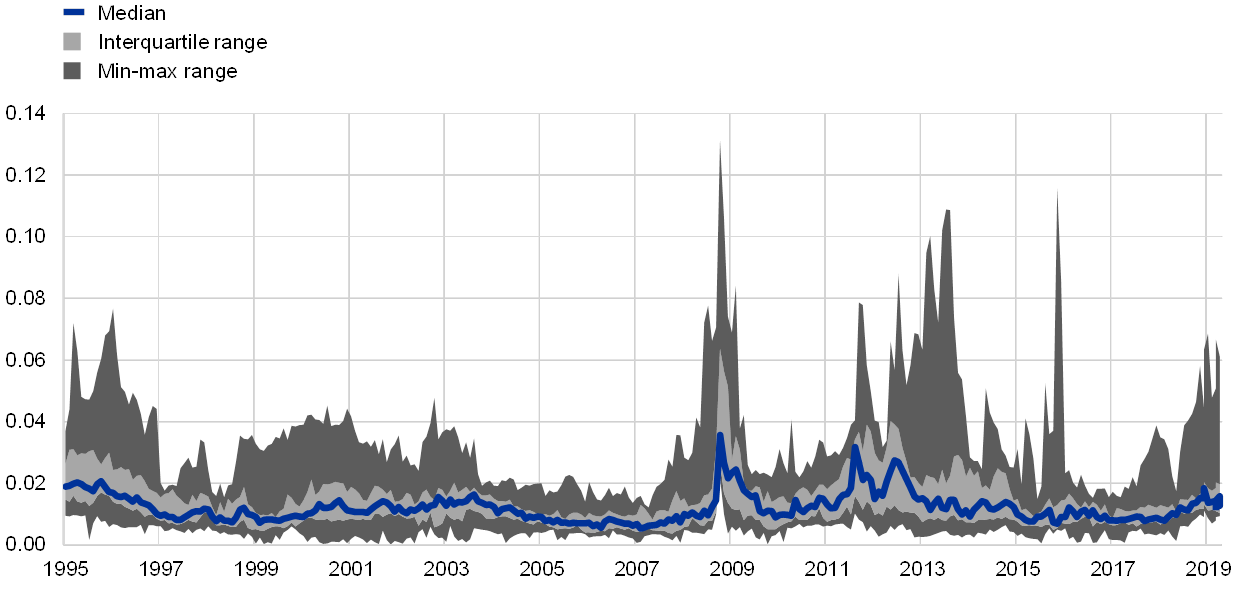
Sources: Thomson Reuters and ECB calculations.
In terms of cross-border holdings of equities, which are at the core of integration, a slight trend towards fragmentation started to emerge in 2019. Euro area holdings of equity were characterised by a rising share in domestic equity holdings (Chart 39). The split between domestic and non-domestic holdings (both inside euro area and outside the euro area) remained stable from 2016 to 2018, after the prolonged and slow integration that had taken place since 2008. However, at the beginning of 2019 signs started to emerge that integration was going backwards. This was most likely linked to uncertainty surrounding trade wars and Brexit.
Chart 39
Euro area holdings of equity (including investment fund shares and other equity) by geographical issuer
(percentages of total euro area holdings of equities, quarterly data, Q1 2008 – Q3 2019)
Source: ECB.
Note: Equity holdings include listed and unlisted shares, investment fund shares (of any type of investment fund) and other equities including, among other things, participations in international organisations (e.g. the ECB or the European Stability Mechanism) and holdings of real estate outside the domestic economy.
In terms of publicly listed equities, more recent developments regarding euro area listed shares were marked by the 2018 contraction and subsequent recovery in 2019. From a somewhat longer perspective, since 2014 we have observed a significant increase in total issuance supported by strong equity markets. Issuance grew at the domestic level, as well as at the cross-border intra-euro area and extra-euro area. Despite these developments, in relative terms, the share of domestic financing over the total remained the same between 2014 and 2019, which can be seen as a sign of stagnation in the level of market integration. However, these numbers have been strongly influenced by a relatively large increase in domestic issuance in France. For most euro area countries, cross-border intra-euro area and extra-euro area flows have become relatively more significant since 2014.
Chart 40
Euro area issued listed shares by domicile of financing provider
(EUR trillions (left-hand scale); percent (right-hand scale); end-of-year data; 2014 – 2019)

Source: ECB.
Note: Total financing received includes listed shares. The stock of shares in year 2019 refers to Q3 2019 values. Annual GDP for the year 2019 is calculated as the sum of quarterly nominal GDPs from Q4 2018 – Q3 2019.
Special Features
A Implications of Brexit for the EU financial landscape
Brexit will result in a substantial structural change to the EU’s financial architecture over the coming years. It could be particularly significant for derivatives clearing, investment banking activities and securities and derivatives trading as the reliance on service provision by UK financial firms is more pronounced in these areas and the provision of such services is currently linked to the EU passporting regime. At the same time, the precise overall impact of Brexit on the EU’s future financial architecture in general – and on these specific areas in particular – is difficult to predict at this stage, and may change over time.
This special feature makes a first attempt at analysing some of the factors that may affect the EU’s financial architecture post-Brexit. It focuses on areas which currently show strong reliance on the UK and are of particular relevance for the ECB under its various mandates.
MoreB How could a common safe asset contribute to financial stability and financial integration in the banking union?
This special feature discusses how a common sovereign safe asset in the euro area could benefit financial stability by fostering financial integration and development, and by changing the structure of asset markets. The discussion focuses on the potential benefits of a well-designed common safe asset that has certain desirable characteristics, while it does not provide an assessment of specific design options. This special feature should be viewed as part of a broader discussion on how to complete the banking union, which also includes considerations regarding a European deposit insurance scheme and changing the regulatory treatment of sovereign exposures.
MoreC Is the home bias biased? New evidence from the investment fund sector
This special feature analyses euro area investment preferences in the investment fund sector and discusses the implications for financial integration. We investigate the traditional perception that investors tend to hold a disproportionate share of domestic assets in their portfolio, a phenomenon generally known as “home bias”. We argue that measures of home bias that neglect fund holders’ countries of origin are biased, in particular when investments are concentrated in financial centres. By taking into account fund holders’ country of origin rather than assuming the fund’s domicile as investment origin, this study revisits and corrects measures of home bias in the euro area.
MoreStatistics
Statistical annex© European Central Bank, 2020
Postal address 60640 Frankfurt am Main, Germany
Telephone +49 69 1344 0
Website www.ecb.europa.eu
All rights reserved. Reproduction for educational and non-commercial purposes is permitted provided that the source is acknowledged.
For specific terminology please refer to the ECB glossary (available in English only).
PDF ISBN 978-92-899-4241-6, ISSN 1830-7159, doi:10.2866/926041, QB-AJ-20-001-EN-N
HTML ISBN 978-92-899-4235-5, ISSN 1830-7159, doi:10.2866/501, QB-AJ-20-001-EN-Q
- ECB (2018), “Financial integration in Europe”, May.
- ECB (2017), “Report on financial structures”, October.
- Baele, L. et al. (2004), “Measuring financial integration in the euro area”, Occasional Paper Series, No 14, ECB, April.
- Hartmann, P., Maddaloni, A. and Manganelli, S. (2003), “The euro area financial system: structure, integration and policy initiatives”, Oxford Review of Economic Policy, Vol 19(1).
- See also Special Feature A entitled “Financial development: concepts and measures” in ECB (2008), “Financial integration in Europe”, April. This structural process of financial development should not be confused with general financial market developments, such as cyclical fluctuations in asset prices or credit.
- In Chart 1.1 the total set of other financial institutions (OFIs) is the sum of financial vehicle corporations (dark green area), which deal with securitisations, and of remaining other financial institutions (light blue area).
- Regulation (EU) 2019/1156 of the European Parliament and of the Council of 20 June 2019 on facilitating cross-border distribution of collective investment undertakings and amending Regulations (EU) No 345/2013, (EU) No 346/2013 and (EU) No 1286/2014 and Directive (EU) 2019/1160 of the European Parliament and of the Council of 20 June 2019 amending Directives 2009/65/EC and 2011/61/EU with regard to cross-border distribution of collective investment undertakings.
- Financial Stability Board (2017), “Policy Recommendations to Address Structural Vulnerabilities from Asset Management Activities”, January, and European Systemic Risk Board (2018), “Recommendation on leverage and liquidity in investment funds”, 14 February.
- Association for Financial Markets in Europe (2019), “Capital Markets Union: Key Performance Indicators”, October, chart 7.3.
- However, part of this movement may have been caused by US multinationals repatriating foreign earnings, a phenomenon that took place at around the same time and could also have affected measures of intra-euro area FDI flows.
- The ECB has previously analysed structural and integration developments in dedicated reports, most recently in the October 2017 Report on Financial Structures (RFS) and the May 2018 Financial Integration in Europe report (FIR) respectively.
- Non-bank financial intermediaries comprise Insurance corporations and pension funds (ICPFs), non-MMF investment funds (IFs), financial auxiliaries, captive financial institutions and money lenders, and other financial intermediaries (except ICPFs).
- The five mutually exclusive domestic institutional sectors that make up the total domestic economy are: (i) non-financial corporations (NFCs); (ii) financial corporations; (iii) general government; (iv) households; and (v) non-profit institutions serving households.
- Total liabilities and loans are adjusted for loans by NFCs as these are interpreted as intra-company loans. A representation of “pure” external financing requirements would build on consolidated economic sector balance sheets as well as net out financing requirements intermediated through banks and securitisation activities.
- Financial accounts in national accounts are unconsolidated. The analysis in this chapter excludes financial liabilities by the rest of the world economic sector. In addition to the positions considered in this analysis – i.e. loans and trade credits, debt securities and equity – total financial liabilities include monetary gold and special drawing rights (SDRs), currency and deposits, investment fund shares/units insurance, pension and standardised guarantee schemes, financial derivatives and employee stock options, and other accounts payable.
- The European system of accounts – ESA 2010 defines the instruments included in Chart 1 as follows:Equity is a financial asset that is a claim on the residual value of a corporation, after all other claims have been met.Listed shares are equity securities listed on an exchange. Such an exchange may be a recognised stock exchange or any other form of secondary market. Listed shares are also referred to as quoted shares. The existence of quoted prices of shares listed on an exchange means that current market prices are usually readily available.Unlisted shares are equity securities not listed on an exchange.Other equity comprises all forms of equity other than those classified in the sub-categories listed shares and unlisted shares. In particular, it includes all forms of equity in corporations which are not shares, including the following:(1) the equity in incorporated partnerships subscribed by unlimited partners;(2) the equity in limited liability companies whose owners are partners and not shareholders;(3) the capital invested in ordinary or limited partnerships recognised as independent legal entities;(4) the capital invested in cooperative societies recognised as independent legal entities.
- As shown in Chart 10 and discussed in Section 2, by mid‑2019 the increase amounted to EUR 3.7 trillion, as the negative valuation effects observed in 2018 reversed in early 2019, in particular for listed shares. The trend was not uniform in 2019Q1 and 2019Q2. Non-bank financial intermediaries mainly hold listed shares issued by NFCs. For investment funds, the increase in assets in 2019H1 reflected both increased inflows and valuation gains from falling yields. As for other financial intermediaries and financial vehicle corporations (FVCs), the valuation losses depicted in 2019Q2 were lower than the valuation gains in 2019Q1. As a result, assets in this category increased in 2019H1.
- The System of National Accounts 2008 provides the following definitions of unlisted shares and other equity respectively:Listed shares are equity securities listed on an exchange. They are also referred to as quoted shares.Unlisted shares are equity securities not listed on an exchange. Unlisted shares can also be called private equity; venture capital usually takes this form. Unlisted shares tend to be issued by subsidiaries and smaller scale enterprises and typically have different regulatory requirements.Other equity is equity that is not in the form of securities. It can include equity in quasi-corporations (such as branches, trusts, limited liability and other partnerships), unincorporated funds and notional units for ownership of real estate and other natural resources. (…)
- Financing in the US economy through other equity instruments is particularly relevant for NFCs (representing 77% of the outstanding other equity instruments) and to a lesser extent for MFIs (12%) and OFIs (9%).
- This Box is based on De Haas, R., and Popov, A. (2019), “Finance and carbon emissions,” Working Paper Series, No 2318, ECB, Frankfurt am Main.
- See for example the 2015 Paris Climate Conference Agreement, and the European Commission’s long-term vision for a climate-neutral economy by 2050, COM (2018) 773.
- Krogstrup, S., and Oman, W. (2019), “Macroeconomic and Financial Policies for Climate Change Mitigation: A Review of the Literature”, IMF Working Papers, No 185, September.
- The evidence presented in this chart is supported by parametric analysis. See De Haas and Popov (2019) as referenced in footnote 10 for more details.
- Wurgler, J. (2000), “Financial Markets and the Allocation of Capital”, Journal of Financial Economics, Vol. 58, pp. 187‑214; Fisman, R. and Love, I. (2007), “Financial Dependence and Growth Revisited”, Journal of the European Economic Association, Vol. 5, pp. 470‑479; Hartmann, P., Heider, F., Papaioannou, E., and Lo Duca, M. (2007), “The Role of Financial Markets and Innovation in Productivity and Growth in Europe”, ECB Occasional Papers, No 72.
- Kortum, S., and Lerner, J. (2000), “Assessing the Contribution of Venture Capital to Innovation”, RAND Journal of Economics, Vol. 31, pp. 674‑692. In contrast, the effects of corporate bond financing seem to be more like bank loan financing than like equity financing, when it comes to their overall impact on carbon emissions.
- This result is related to the work of Levinson, A. (2009), “Technology, International Trade, and Pollution from US Manufacturing.” American Economic Review, 99 (5): 2177‑92, who shows that the clean-up of US manufacturing since the late 1980s mainly reflects technological progress and only to a limited extent the shifting of polluting industries overseas.
- See Schepens, G. (2016), “Taxes and Bank Capital Structure”, Journal of Financial Economics, Vol. 120, pp. 585‑600.
- Kim, W. and Weisbach, M. (2008), “Motivations for Public Equity Offers: An International Perspective”, Journal of Financial Economics, Vol. 87, pp. 281‑307; Hsu, P.-H., Tian, X., and Xu, Y. (2014), “Financial Development and Innovation: Cross-Country Evidence”, Journal of Financial Economics, Vol. 112, pp. 116‑135; Brown, J., Martinsson, G., and Petersen, B. (2017), “Stock Markets, Credit Markets, and Technology-led Growth”, Journal of Financial Intermediation, Vol. 32, pp. 45‑59.
- See Klassen, R., and McLaughlin, C. (1996), “The Impact of Environmental Management on Firm Performance”, Management Science, Vol. 8, pp. 1199‑1214.
- See Capital Markets Union. Arguably, this proposal is not driven by environmental considerations, but is part of an overall plan to create a more neutral and investment-friendly tax environment.
- See for example “Capital markets Union: Commission reports on progress achieved ahead of Europe Council”, and “Report Next Capital Markets Union High-Level Group: The next CMU”.
- See Policy areas supporting the growth of a green bond market.
- See Flammer, C. (2018), “Corporate Green Bonds”, Global Economic Governance Initiative Working Papers, No Paper 23.
- Improvements in data collection also contributed to the increase in the recorded share of equity financing in total outstanding liabilities since 2015. Earlier data in the series have not been corrected backwards.
- See for instance, Regulation (EU) 2019/1238 of the European Parliament and of the Council of 20 June 2019 on a pan-European Personal Pension Product (PEPP) and the 2019 Directive on preventive restructuring frameworks, on discharge of debt and disqualifications, and on measures to increase the efficiency of procedures concerning restructuring, insolvency and discharge of debt, and amending Directive (EU) 2017/1132 (Directive on restructuring and insolvency).
- This was namely the case for the review by the European Supervisory Authorities (ESAs).
- See Capital Markets Union – Key Performance Indicators (Second Edition), report by AFME dated October 2019.
- This is a joint task force of the Centre for European Policy Studies and the European Capital Markets Institute, two European think-tanks.
- See Rebranding Capital Markets Union – A market finance action plan, report by the CEPS‑ECMI Task Force of June 2019. See the World Bank’s Financial Structure Database. See the ECB’s Household Finance and Consumption Survey. Hsu, P., Tian, X., and Y. Xu (2014), “Financial development and innovation: Cross-country evidence,” Journal of Financial Economics, Vol. 112, pp. 116‑135. See 2016 Financial Integration in Europe Report, Special Feature A “Financial integration and risk sharing in a monetary union.”
- See section 4.1.
- See Box 5 in this section
- [See the dedicated special feature on the implication of Brexit for the EU financial landscape – specific reference to be added later]
- See Savings and Sustainable Investment Union The Next CMU High-Level Group, Report to Ministers and presented to the Finnish Presidency October 2019.
- See Rebranding Capital Markets Union – A market finance action plan, [TBD]
- See Capital Markets Union – Key Performance Indicators (Second Edition).
- See Press release on High-Level Forum on capital markets union, European Commission. The ECB is participating in the High-Level Forum on Capital Markets Union (HLF) as an observer.
- See Council conclusions on the deepening of the capital markets union, Outcome of Proceedings, adopted at the Council of the European Union on 5 December 2019.
- As regards the non-MMF investment funds sector, the “home bias” is discussed in a special feature in this report.
- The share ranges from 13% of general government debt in Malta to above 50% in Germany, Spain, Italy, Luxembourg, France and the Netherlands.
- “Under ESA 2010, the ESM will be classified, in the accounts of all EU countries, as a non-domestic euro area resident, within the sector rest of the world S.2, under the sub-sector S.21 (the European Union) and among the institutions of the EU (S.212). In the accounts of the European Institutions (seen as a separate "Member State"), the ESM is classified as other financial intermediary (S.125 in ESA 2010).” (see: Manual on Government Deficit and Debt – Implementation of ESA 2010)
- See Hartmann, Maddaloni and Manganelli (2003), “The euro-area financial system: Structure, integration, and policy initiatives”, Oxford Review of Economic Policy, 19(1), pp. 280‑313. For related discussions see also Allen and Gale (2000), “Comparing Financial Systems”, Cambridge, MA: MIT Press, Demirguc-Kunt and Levine (2001), “Financial Structure and Economic Growth”, Cambridge, MA: MIT Press, and the ECB Report on Financial Structure (2002).
- Over the period from the end of 2016 to mid‑2019, the MFI sector grew by EUR 2.3 trillion or 3.4%, while the OFI sector grew by EUR 1.9 trillion or 2.4%.
- Non-bank financial intermediaries comprise insurance corporations and pension funds (ICPFs), non-MMF investment funds (IFs), financial auxiliaries, captive financial institutions and money lenders, and other financial intermediaries (except ICPFs).
- FSB Global Monitoring Report on Non-Bank Financial Intermediation 2018.
- See also Graph 1 in Gambacorta, L., Yang, J. and Tsatsaronis, K. (2014), “Financial structure and growth”, BIS Quarterly Review, March.
- In the context of an adjustment programme and or resolution procedures.
- Hartmann, P. et al. (2017), “Special feature: Cross-border bank consolidation in the euro area”, 2017 Financial Integration Report, Andreeva D. et al. (2019), “Euro area bank profitability: where can consolidation help?” Financial Stability Review, November.
- In the 2019 version of the World Bank – Bank Regulation and Supervision Survey different practices were reported among individual euro area countries where no common SSM policy was reported, in particular in the areas of entry/licencing, ownership, external auditing and internal management or governance.
- N. Aydin (2017), “Mergers and Acquisitions: A Review of Valuation Methods”, International Journal of Business and Social Science, Vol. 8(5): “One of the most critical elements in M&A is the valuation of companies as the success of an M&A is closely related to determining the fair value of the companies.” Evanoff et al. (2009), “Mergers and Acquisitions of Financial Institutions: A Review of the Post‑2000 Literature”, Journal of Financial Services Research, Vol. 36(2), pp. 87‑110.
- See Report on financial structures, ECB, October 2017.
- The experimental dataset is based on the data collected from publicly available internet sources on a “best efforts”. The dataset might not fully cover fintech entities (neither in terms of number of entities in a country, nor in terms of entities’ market share or relevance). Entities with a significant internet footprint, largely based on results in English language, were more likely to be picked up than the others. BigTech, InsurTech and PensionTech entities are not covered by the analysis. The one-off data collection exercise, covering entities regardless their regulatory status, was carried out in August and September 2019.
- Based on statista.com.
- Discussion paper on the EBA’s approach to fintech.
- Based on a rather conservative measure which identifies such entities if they feature on the lists of fintech entities in countries other than the location of headquarters.
- Based on Bureau van Dijk (BvD) links data and ECB estimates and calculations.
- See the BIS website.
- See “2018 IFC Annual report”, Irving Fisher Committee on Central Bank Statistics (IFC), Bank for International Settlements (BIS), March 2019 and “Central banks and fintech data issues”, IFC, BIS, February 2020. The final report of the IFC WG on Fintech data is to be published in the first half of 2020.
- See the UN website.
- See the Eurostat website.
- See Financial Stability Review, ECB, November 2019, Chapter 4.
- See, for example, Financial Stability Review, Deutsche Bundesbank, November 2018.
- As from January 2018 MiFID II strengthens investor protection and improves the functioning of financial markets, making them more efficient, resilient and transparent. This recent reform is not addressed in this section. New reporting requirements and tests are also increasing the amount of public information available.
- For details see the Statistical Web Annex to this report.
- The price-based money market indicator reflects developments in the unsecured segment using (pre-€STR data as of March 2017. The dispersion of €STR is less volatile than the one of EONIA in the last 2 years. First, unlike for EONIA, the calculation of €STR involves significant trimming (-50% in total, 25% extremes at each tail of the rates distribution are excluded), implying that operations at most dispersed rates end up being trimmed. Second, €STR has a much broader coverage than EONIA (around EUR 30 bn total underlying volume versus just EUR 2 bn for EONIA), diluting the impact of outliers. Third, €STR does not just encompass the interbank market (like EONIA does) but also non-bank financial institutions which makes it more representative of the bulk of money market transactions. Non-bank financial institutions do not have an allowance from the two-tier system assigned to them and do not have access to the deposit facility. Therefore, they cannot exploit the arbitrage in the same way as euro area banks and are still willing to lend/deposit at rates below the deposit facility rate.
- See also AFME Capital Markets Union – Key Performance Indicators (Second Edition), October 2019, which provides a set of complementary indicators.
- See Financial integration in Europe, April 2016.
- See European Central Bank (2019), “Euro area foreign direct investment since 2018: the role of special purpose entities”, Economic Bulletin, Issue 5. The Bureau of Economic Analysis (BEA) reported around USD 300 billion of repatriated earnings in the first quarter of 2018 and about USD 170 billion in the second quarter. See Bureau of Economic Analysis (2018). See “Effects of the 2017 Tax Cuts and Jobs Act on Components of the International Transactions Accounts” US International Transactions Third Quarter 2018, December. According to the United Nations Conference on Trade and Development (UNCTAD), these amounts largely correspond to the contraction in Europe-United States liabilities. See United Nations Conference on Trade and Development (2019), “Global foreign investment flows dip to lowest levels in a decade”, Global Investment Trends Monitor, No 31, January.
- Lewis, K. (1996), “What Can Explain the Apparent Lack of International Consumption Risk-sharing?” Journal of Political Economy, Vol. 104 (2), pp. 267‑297.
- Asdrubali, P., Sorensen, B. and Yosha, O. (1996), “Channels of interstate risk sharing: United States 1963‑1990”, Quarterly Journal of Economics, Vol. 111(4), pp. 1081‑1110.
- Sorensen, B. and O. Yosha (1998), “International risk sharing and European monetary unification”, Journal of International Economics, Vol. 45(2), pp.: 211‑238.
- Demyanyk, Y., Ostergaard, C. and Sorensen, B.E. (2008),) "Risk Sharing an Portfolio Allocation in EMU," Economic Papers, No 334, European Commission Directorate General Economic and Financial Affairs.
- Cimadomo, J., Fortuna, O. and Giulidori, M. (2018), “Private and public risk sharing in the euro area”, Working Paper Series, No. 2148, ECB.
- Milano (2017),) “Risk sharing in the euro zone: the role of European institutions”, CeLEG Working Paper Series, No. 01/17.
- Kalemli-Ozcan S., Luttini, E. and Sørensen, B. (2014) "Debt Crises and Risk-Sharing: The Role of Markets versus Sovereigns," Scandinavian Journal of Economics, Wiley Blackwell, Vol. 116(1), pp. 253‑276.
- Alcidi, C., D’Imperio, P. and Thiron, G. (2017), “Risk-sharing and consumption-smoothing patterns in the US and the euro area: a comprehensive comparison”, CEPS Working Document, No. 2017/04.
- For simplicity the control for changes in relative prices (the ratio of the respective country consumer price index to the euro area consumer price index) is excluded in this analysis. The overall results are only partially affected by this decision, i.e. the inclusion/exclusion has no impact on the statistical relevance of the correlation.
- See Irish GDP revision – European Commission, 12 December 2016.
- An important caveat is that credit channel captures both cross-border and domestic saving and dissaving (both private and public).
- This is, however, not a necessarily an indication of increased integration of money markets. TLTRO rates do not take the risk profile of banks into account. Therefore banks with higher credit risk might get a lower TLTRO rate than they would get in a well-integrated market, in which risk differentiation is applied.
- Such a spread provides an implicit comparison between two alternative strategies available to any bank willing to lend funds on the interbank market: a one-shot strategy (OS) versus a roll-over strategy (RO). In an OS strategy, funds are lent for three months to one bank at the three-month EURIBOR rate. In a RO strategy, over three months, funds are lent each day until the next day at the overnight rate. The borrower bank is not necessarily the same on each day. In the OS strategy, the lender is more exposed to credit risk, as the RO strategy can only generate a credit loss if the borrower bank defaults overnight. The lender is also more exposed to liquidity risk as the contract is illiquid for three months while the RO strategy can be interrupted on any given day and the released funds be diverted to other uses.
- However, due to higher liquidity demands and increased fragmentation of the money markets funding stress can emerge even in an environment of excess liquidity. This was the case during the September 2019 funding stress in the United States, which however did not affect euro area money market functioning.
- The two-tier system remunerates part of banks’ excess holdings with the Eurosystem at zero: the so-called exempt tier for reserve remuneration applies for the maintenance period starting on 30 October 2019 and exempts part of credit institutions’ excess liquidity holdings (i.e. reserve holdings in excess of minimum reserve requirements) from negative remuneration at the rate applicable on the deposit facility. This provides new incentives for cross-border trading as some banks need inflows from other jurisdictions to fully utilise their exempt tier.
- This Box is based on Vacirca, F., Kahros, A. and Rosati, S. (2019), “Detecting community critical participants in payment networks: an application to TARGET2,” Proceedings of the 17th Simulator Seminar, Suomen Pankki.
- TARGET2 is the real-time gross settlement system provided and operated by the Eurosystem for the settlement of euro-denominated payments in central bank money. TARGET2 replaced the TARGET system that went live in 1999, a few days after the launch of the euro, to support monetary policy operations and to settle euro payments across national borders in the EU.
- As of 2019, capital requirements increased due to the completion of the phase-in of the capital conservation buffer and of the globally systemically important institution (G‑SII) buffer. Also, an increase in the countercyclical capital buffer will be implemented in various euro area countries, while further and larger adjustments will be required for the finalisation of Basel III.
- We would like to thank Sonja Dobkowitz for her valuable contributions.
-
3 March 2020