
Is the home bias biased? New evidence from the investment fund sector
Is the home bias biased? New evidence from the investment fund sector
Published as part of Financial Integration and Structure in the Euro Area, March 2020.
This special feature analyses euro area investment preferences in the investment fund sector and discusses the implications for financial integration. We investigate the traditional perception that investors tend to hold a disproportionate share of domestic assets in their portfolio, a phenomenon generally known as “home bias”. We argue that measures of home bias that neglect fund holders’ countries of origin are biased, in particular when investments are concentrated in financial centres. By taking into account fund holders’ country of origin rather than assuming the fund’s domicile as investment origin, this study revisits and corrects measures of home bias in the euro area.
Our main finding shows that, in the euro area, the home bias in fund holdings is significantly lower than the literature often suggests. When taking into account investors’ country of origin, the average home bias across euro area countries is nearly three times lower than if the fund domicile is taken as investment origin. The main reason for this is that euro area investors put the majority of their assets in funds domiciled in financial centres, namely in Luxembourg and Ireland. We find that these funds invest in more diversified portfolios than funds domiciled in other euro area countries, contributing to a lower home bias across euro area investors. We provide corroborating evidence suggesting a lower equity “euro area bias” when taking into account the fund holders’ countries of origin, relative to using the fund’s domicile as investment origin.
Overall, our findings suggest that investment funds, in particular those domiciled in financial centres, facilitate the diversification of asset holdings across euro area countries. From a policy perspective, measures that support the cross-border distribution of funds in the euro area can help develop more vibrant financial markets and contribute to greater diversification across countries, which can improve financial risk sharing in the euro area.
1 Home bias in fund holdings – critique and other geographical preferences
Empirical evidence traditionally suggests that investors tend to hold a disproportionate share of domestic assets in their portfolio, a phenomenon known as “home bias”. Cross-border diversification of portfolios can benefit investors and facilitate risk sharing across countries (see Grubel (1968), Grauer and Hakansson (1987), Obstfeld (1992), DeSantis and Gerard (1997), among others). Empirically, however, investors do not seem to exploit potential gains from portfolio diversification, as they allocate a relatively large fraction of their wealth to domestic securities (see Lewis (1999), Karolyi and Stulz (2003), and Cooper et al. (2012), among others).[2] Sørensen et al. (2007) find that there is a negative correlation between home bias and risk sharing, suggesting that home bias can be regarded as an obstacle to financial integration.
Investment funds play an important role in financial integration of the euro area since they tend to hold diversified portfolios. The euro area investment fund sector has grown substantially since the global financial crisis, from €4.2 trillion in total assets at the end of 2008 to €12.0 trillion at the end of 2018.[3] According to the ECB’s Financial Integration Report (2018), euro area equity and bond funds tend to hold relatively diversified portfolios, investing less than a quarter of their assets in securities issued in their own domicile.
Using the fund domicile as investment origin may provide biased estimates for identifying home bias given the important role of financial centres in the euro area. Studies investigating home bias in investment funds typically connect a fund’s domicile with the issuer country of its holdings (Chan (2005) and ECB (2018), among others). However, these studies do not take into consideration the distinct role of financial centres, which tend to distort cross-border statistics.[4] In the euro area, the majority of investment funds are domiciled in financial centres such as Ireland and Luxembourg, while investors in these funds are often domiciled in other euro area countries. Euro area fund domiciles are thus not representative of investors’ countries of origin. Home bias measures that take the fund domicile as investment origin may therefore also be estimated in a biased manner.
Euro area investment allocations in geographical areas outside the euro area may also be biased when taking the fund domicile as investment origin. A number of studies find that, since the introduction of the single currency, euro area investors have switched from home to euro-area securities – a trend which is sometimes referred to as “euro area bias” (Lane and Milesi-Ferretti (2005), Schoenmaker and Bosch (2008) and Balli et al. (2010), among others). Floreani and Habib (2018), however, find that the euro area bias could be overstated due to a measurement error driven by the presence of euro area financial centres.
2 Home bias in fund holdings: empirical evidence for the euro area
A large number of euro area investors buy funds in countries that are domiciled outside their own domicile, highlighting the need to correct home bias measures. Column 2 of Table C.1 shows the share of non-domestic euro area investors as a percentage of all euro area investors, for funds domiciled in euro area financial centres and funds domiciled in other euro area countries. Column 3 shows the size of the fund sector relative to total euro area fund sector assets. In funds domiciled outside financial centres, investments by non-domestic euro area investors are low (4.5%). However, a large share of euro area investors investing in financial centres - Luxembourg and Ireland - are in fact domiciled in other countries (91.7%). Given that the majority of euro area assets are held in financial centres, using the fund domicile as investment origin may not be representative of most investors’ countries of origin. Consequently, there is a need to correct for this when measuring the home bias in euro area countries.[5]
Share of non-domestic euro area investors and fund size
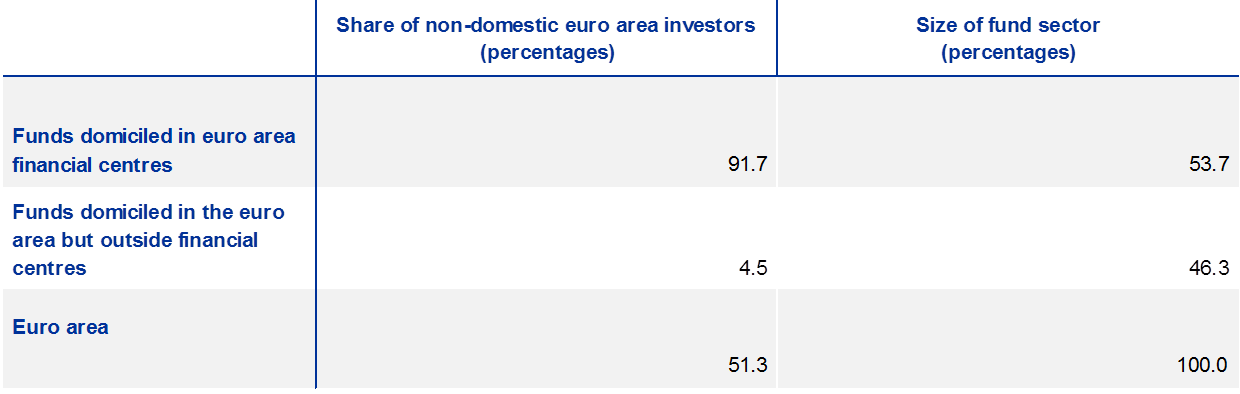
Sources: SHS and ECB Investment Fund Statistics.Notes: Column 2 shows the share of non-domestic euro area investors as a percentage of all euro area investors, for funds domiciled in euro area financial centres and funds domiciled in other euro area countries (weighted by the countries’ fund sector size). Column 3 shows the total assets of the fund sector relative to total euro area total assets, for funds domiciled in euro area financial centres and funds domiciled in other euro area countries, based on Q4 2018 data.
We construct a novel dataset that links fund investors’ country of origin directly with their fund-specific holdings based on a “look-through approach”. To determine the fund holders’ countries of origin, we use end-of-year ISIN-level security holdings from the Securities Holdings Statistics (SHS) between Q4 2013 and Q4 2018. Fund holder sectors include households, banks, insurance corporations and non-financial corporations that are domiciled in the euro area. We exclude investment funds as original fund holder sectors to avoid double-counting.[6] ISIN-level investment fund holdings are retrieved from Lipper IM. We merge the investors’ countries of origin with the fund-specific holdings, “looking through” the fund domicile (see Box C.1). Due to limited data availability we exclude Cyprus, Estonia, Malta, Portugal, Slovakia and Slovenia from the calculations of domestic investments and home bias. Given that some euro area investors also invest directly in funds domiciled outside the euro area, the look-through approach includes a number of funds that would not be captured when taking the fund domicile as investment origin.[7] In Q4 2018, our dataset covers €1.7 trillion of euro area investor equity holdings and €0.7 trillion of euro area debt holdings via investment funds.
Euro area investor fund holdings of domestic equity (left panel) and domestic debt securities (right panel)
(y-axis: percentages; x-axis: year)
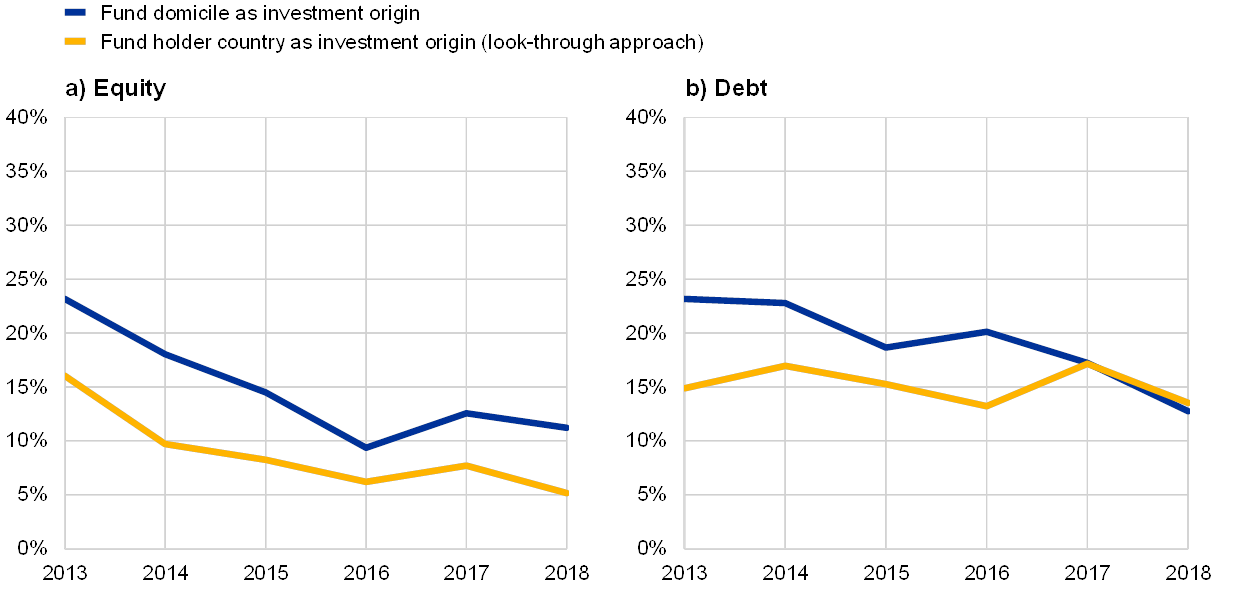
Sources: SHS and Lipper IM.Notes: The blue line uses fund domicile as investment origin, following ECB (2018). The yellow line uses investor domicile as investment origin, following the look-through approach. The sample of reporting countries includes Austria, Belgium, Germany, Spain, France, Greece, Ireland, Italy, Lithuania, Luxembourg, Latvia and the Netherlands.
Applying the look-through approach, the relative share invested in domestic assets is lower for most periods compared with taking the fund domicile as investment origin. Following ECB (2018), Chart C.1 shows investments in domestic equity (left panel) and domestic debt investments (right panel) relative to total investments through investment funds. We show domestic investments using both the fund domicile as investment origin (blue lines) and the investors’ country of origin (yellow lines). When taking into account investors’ country of origin, we find that, except for debt securities in Q4 2018, the share invested in domestic securities is lower compared with the use of the fund domicile as investment origin. For equity securities, the share of investments in domestic securities has declined over the past five years. In Q4 2018, domestic equity securities were only 5.2% of total assets when using the look-through approach and 11.2% when taking the fund domicile as investment origin.
To investigate the extent to which euro area investors overweight domestic holdings, we compare fund holdings with a benchmark following standard practice in the literature. Chan et al. (2005) assess the deviation of the share of a country in its mutual fund holdings from the world market capitalisation weight of the country. Following this approach, we use the market capitalisation of total equity and debt holdings by country as the benchmark based on the full fund holdings available. We first apply the home bias measure by Chan et al. (2005) using the investment fund domicile as investment origin. We then adjust these home bias measures by taking fund holder countries as investment origin based on the look-through approach. Box C.1 describes the differences between the two methodologies in more detail.
Home bias by euro area country: fund domicile vs. fund holder country as investment origin
(home bias measures)
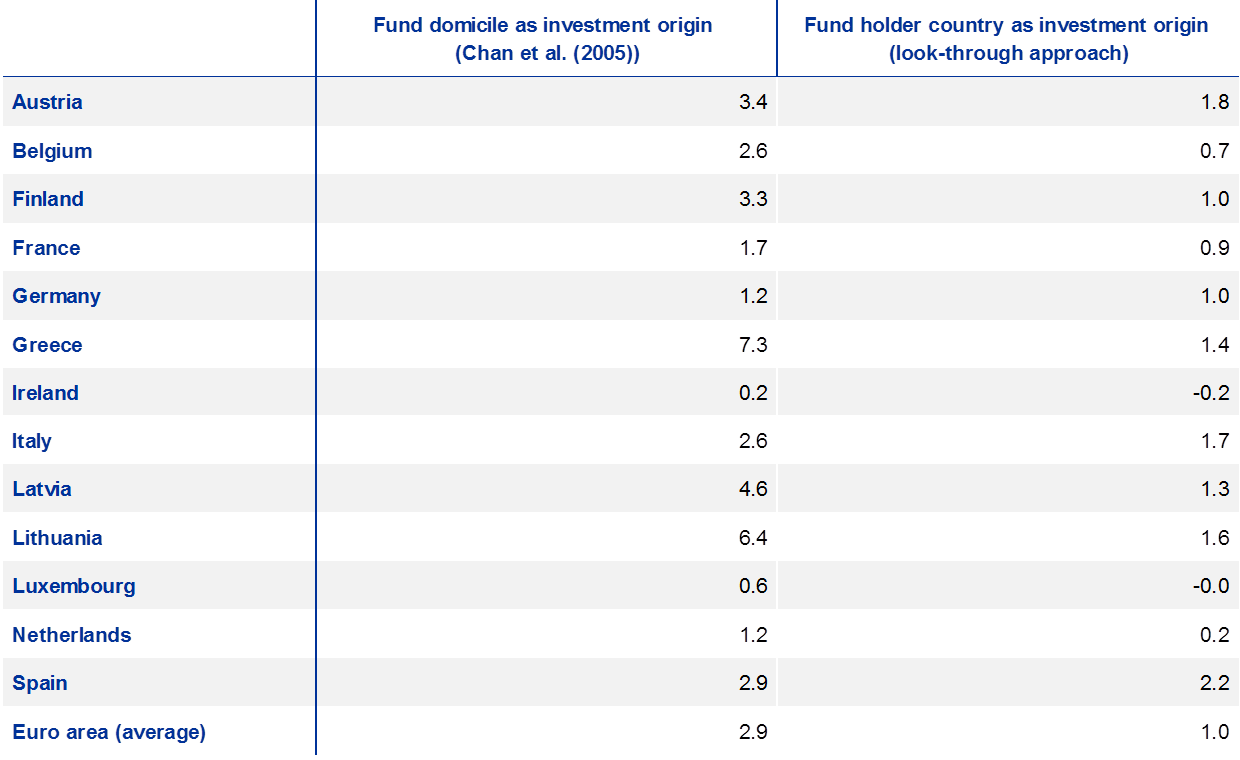
Sources: SHS and Lipper IM.Notes: The table shows the average home bias across euro area countries between 2013 and 2018, based on total equity and bond holdings. The home bias for country j reflects the deviation of the share of country j in its mutual fund holdings from the world market capitalisation weight of country j. Column 2 shows country j’s home bias using fund domicile as investment origin, closely following Chan et al. (2005). Column 3 shows country j’s home bias using fund holders’ country as investment origin, following the “look-through approach”. The two methodologies are explained in more detail in Box C.1.
When taking into account investors’ countries of origin we find a lower home bias throughout the euro area, compared with home bias measures that use the fund domicile as investment origin. Column 2 of Table C.2 shows the results using fund domicile as investment origin, while column 3 shows the results using the look-through approach. Similar to Chan et al. (2005), we find evidence for home bias in all 13 euro area countries in our dataset when using the fund domicile as investment origin. When applying the look-through approach, however, we find a substantially lower home bias. While there still is a positive home bias for most countries (except for Ireland and Luxembourg), the euro area average is only one-third of the home bias measure that uses the fund domicile as investment origin.[8]
The lower home bias is particularly pronounced for countries with small fund sectors whose investors are to a large extent active in euro area financial centres. Austria, Belgium, Finland, Greece, Italy, Latvia, Lithuania and Spain show a relatively high home bias when taking the fund domicile as investment origin (see Table C.2, column 2). These countries have small investment fund sectors, each holding less than 4% of total euro area assets. Investors domiciled in these countries invest a considerable share of their assets in funds domiciled outside of their jurisdiction, in particular in euro area financial centres. For instance, in 2018, Italian investors put only 37% of their assets in funds domiciled in Italy, with 57% of Italian investments held by funds domiciled in Ireland and Luxembourg.[9] For these countries, investments in funds domiciled in financial centres would not be accounted for when taking the fund domicile as investment origin. Therefore, the home bias measure changes considerably for countries whose investors put a large share of their assets outside their own country’s fund sector.
Home bias in funds domiciled in euro area financial centres
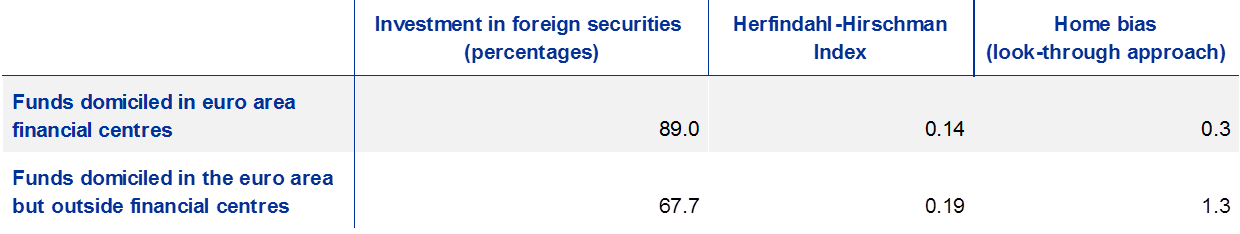
Sources: SHS and Lipper IM.Notes: The first column shows investment in foreign securities for funds domiciled in financial centres (i.e. Ireland and Luxembourg) and funds domiciled outside financial centres. The second column shows the average Herfindahl-Hirschman Index for funds domiciled in financial centres and funds domiciled outside financial centres. The third column shows the average home bias across euro area countries between 2013 and 2018, using the “look-through approach” (see Box C.1 for explanation). The reported home bias measure provides the average across all 13 euro area holder countries for the two different samples (i.e. funds domiciled in euro area financial centres and funds domiciled in other euro area countries), respectively.
The lower home bias can be explained by investments in funds domiciled in financial centres, which invest in more diversified portfolios relative to funds domiciled in other euro area countries. According to column 2 of Table C.3, funds domiciled in financial centres invest 89% of assets in non-domestic securities, while other euro area funds only invest 68% of their assets in non-domestic securities. Furthermore, funds domiciled in financial centres tend to hold less concentrated portfolios than funds domiciled outside financial centres. The Herfindahl-Hirschman Index, which proxies for portfolio concentration, is 0.14 for funds domiciled in financial centres and 0.19 for funds domiciled in the euro area but outside financial centres (column 3). Because funds in financial centres tend to have more diversified portfolios than funds outside financial centres, the home bias across euro area countries is lower when using the look-through approach. The rationale is that this approach also considers investments in funds domiciled outside their own jurisdiction, which are not considered for that country when taking the fund domicile as investment origin. Column 3 shows that, using the look-through approach, the average home bias across euro area holder countries is only 0.3 for the subsample of funds domiciled in Ireland or Luxembourg. This is less than four times the home bias observed when excluding funds domiciled in financial centres (column 4). Funds in financial centres thus contribute to a lower home bias across euro area countries through a more diversified portfolio compared with funds domiciled in other euro area countries.
Box C.1 Methodology: home bias and the “look-through approach”
This box describes the look-through approach and how our methodology differs from home bias measures which take the fund domicile as investment origin, in particular referring to the approach taken by Chan et al. (2005). In a first step, we replicate Chan et al. (2005) by linking a fund’s domicile with the fund’s investments, based on our dataset. To do so, we calculate the percentage allocation of fund holdings for each of the fund domiciles (i.e. host countries):
where is the share of country j in the fund holdings for domicile country i and is the market value of fund holdings of country j for host country i. We then compute the weight of country j in the world market portfolio as follows:
where is the share of country j in the world market portfolio and is the market capitalisation of country j, based on our dataset. The value of the home bias is defined as the log ratio of the share of country j’s fund holdings in the domestic market ( ) to the world market capitalisation weight of country j ( .[10] If country j has a domestic bias, the value is positive. This would suggest that funds overweight home markets in their fund holdings, relative to the country’s holdings in the world market portfolio.
Using the look-through approach, we adjust Chan et al.’s measure by taking into account investors’ actual country of origin. To do so, we re-estimate (i). But instead of taking the fund domicile as investment origin, we use the fund holders’ country of origin. We link the investor origin country directly with the country of the securities held by a particular fund. Figure A illustrates the differences in methodology. By applying the look-through approach, we may also consider investments through non-euro area domiciled funds, if euro area investors invest directly in these funds. Because the entire universe of holdings through funds by euro area investors is taken into account, this approach allows for a more representative assessment of home bias. For the analysis, investments in funds are taken from the Securities Holdings Statistics (SHS) at the country-sector level, while funds’ security-level holdings are taken from Lipper IM.
Figure A
Home bias methodology
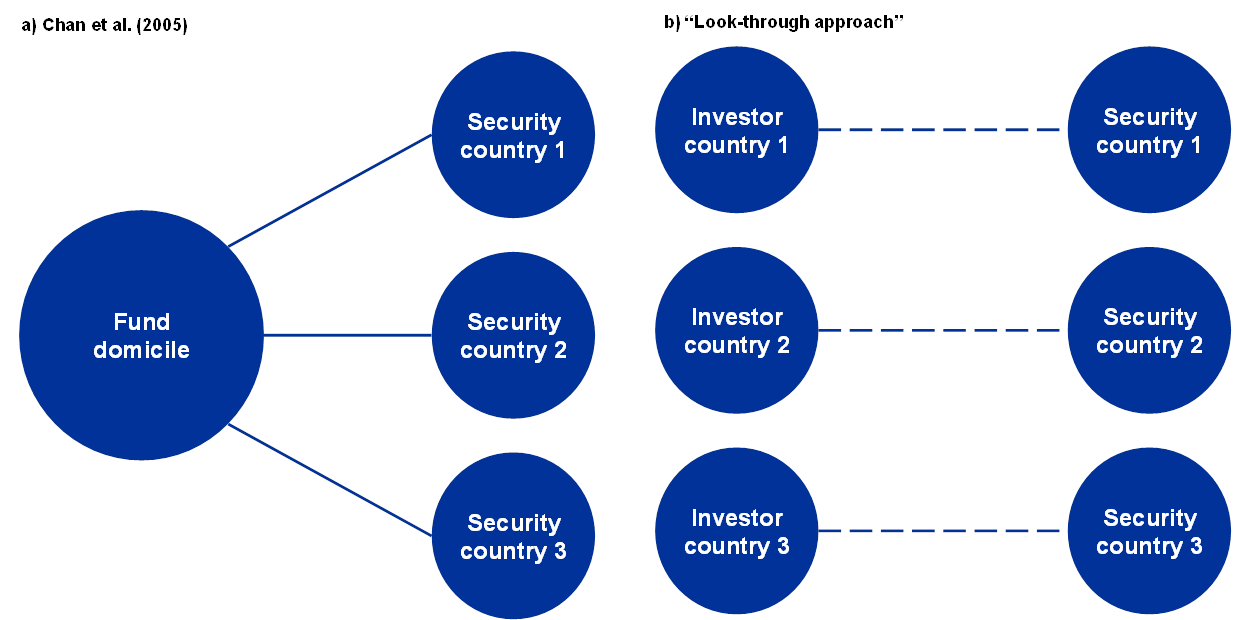
Notes: This stylised chart shows how fund investor domiciles, fund domiciles and security issuance countries interact in the home bias methodologies. Chan et al. (2005, left panel) take the fund domicile as investment origin and link the fund domicile with the countries of the securities. The look-through approach (right panel) directly links the investor countries with the security countries, “looking through” the respective funds.
3 From home bias to euro area bias?
Lower investments in domestic equities coincide with higher equity investments in countries outside the euro area.[11] As shown in the previous section, investments in domestic equities have declined over the past five years. Similarly, there is a downward trend of aggregate investments in euro area equities, relative to total equity investments (Chart C.2, blue and yellow lines). In 2018, around two-thirds of equity investments were in securities issued outside the euro area, while the remaining investment was in equities issued in the euro area. The share of equity investments outside the euro area is larger when taking into account investors’ country of origin relative to taking the fund domicile as investment origin, resulting in a smaller share of euro area equity investments. This can be explained by the fact that the look-through approach also considers some funds that are domiciled outside the euro area, given that a number of euro area investors invest directly in funds domiciled outside the euro area. These investments would not be captured when considering euro area fund domiciles as investment origin.
Euro area investor fund holdings of euro area equities
(y-axis: percentages; x-axis: year)
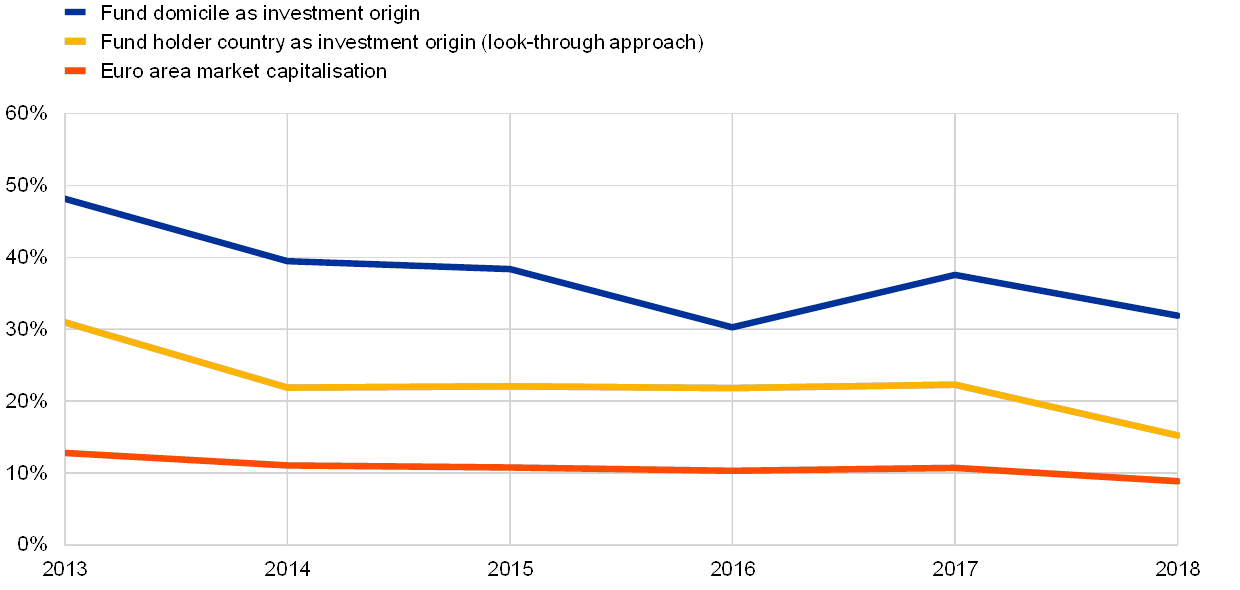
Sources: SHS, Lipper IM and World Bank.Notes: Investments in equity securities by euro area holders. The blue line is based on domicile as incorporation of the fund; the yellow line shows the correction based on fund holder country of origin (look-through approach). The red line shows the market capitalisation of listed domestic companies as a percentage of total world market capitalisation, based on World Bank (2019).
Euro area investors still tend to overweight euro area equities relative to their market capitalisation, providing some evidence for an equity “euro area bias”. Chart C.2 shows that, relative to the market capitalisation of listed companies (red line), euro area investors still overweight investments in euro area equities. In 2018, the market capitalisation of listed companies in the euro area was 8% of the world market capitalisation, while euro area investors put around 15% of their equities in the euro area. This is in line with findings suggesting that euro area investors invest more in euro area countries than underlying fundamentals would suggest (see, for instance, Lane and Milesi-Ferretti (2005)).
4 Conclusion
Our main finding shows that, when correcting for investors’ country of origin, the home bias in the euro area fund sector is lower than the literature often suggests. We link fund investors’ countries of origin directly with their fund-specific holdings. We find that the home bias is nearly three times smaller than what is found using methodologies that take the fund domicile as investment origin. This finding can be explained by the high share of investment in funds domiciled in euro area financial centres and the more diversified portfolios of these funds relative to funds domiciled in other euro area countries. We provide corroborating evidence suggesting a lower equity “euro area bias” when taking into account the fund holders’ countries of origin, relative to using the fund’s domicile as investment origin.
This finding is in line with the objectives of the capital markets union (CMU) where the cross-border distribution of investment funds is a key priority. Investment funds play an important role in financial integration of the euro area since they tend to hold diversified portfolios. The lower estimated home bias across euro area countries is a positive signal for cross-border distribution of capital flows via investment funds. In the context of the CMU agenda, there are a number of initiatives aimed at further promoting cross-border investments in the EU. For instance, the recent adoption of EU Directive 2019/1160[12] and Regulation 2019/1156[13] aims to promote the cross-border distribution of investment funds. Furthermore, the final report of the Next CMU High-Level Working Group highlights the importance of private equity funds and stresses the need to develop an efficient equity market.[14] Further action may still be needed to increase cross-border equity financing and to expand retail access to capital markets. Such measures could promote increased risk sharing in the EU and help stabilise households’ consumption over time.
5 References
Balli, F., Basher, S.A. and Ozer-Balli, H. (2010), “From home bias to Euro bias: Disentangling the effects of monetary union on the European financial markets”, Journal of Economics and Business, 62(5), pp. 347-366.
Bernanke, B.S., Bertaut, C.C., Demarco, L. and Kamin, S.B. (2011), “International capital flows and the return to safe assets in the United States, 2003-2007”, FRB International Finance Discussion Paper, p. 1014.
Chan, K., Covrig, V. and Ng, L. (2005), “What determines the domestic bias and foreign bias? Evidence from mutual fund equity allocations worldwide”, The Journal of Finance, 60, pp. 1495-1534.
Cimadomo, J., Hauptmeier, S., Palazzo, A.A., and Popov, A. (2018), “Risk sharing in the euro area”, Economic Bulletin, Issue 3, ECB, pp. 85-98.
Cooper, I., Sercu, P. and Vanpée, R. (2012), “The equity home bias puzzle: A survey”, Foundations and Trends in Finance, 7(4), pp. 289-416.
Coletta, M. and Santioni, R. (2019), “Households' investments in foreign mutual funds made transparent”, Occasional Paper, No 533, Bank of Italy, Economic Research and International Relations Area.
Coval, J. D., & Moskowitz, T. J. (2001), “The geography of investment: Informed trading and asset prices”, Journal of political Economy, 109(4), 811-841.
DeSantis, Giorgio, and Gerard, Bruno (1997), “International asset pricing and portfolio diversification with time-varying risk”, Journal of Finance 52, pp. 1881-1912.
European Central Bank (2018), Financial Integration Report, May.
Grauer, R. and Hakansson, N. (1987) “Gains from international diversification: 1968-85 returns on portfolios of stocks and bonds”, Journal of Finance 42, pp. 721-739.
Giuzio, M. and Nicoletti, G. (2018), “Integrating euro area corporate bond markets: benefits and potential financial stability challenges”, ECB Financial Integration in Europe, Special Feature B.
Grubel, H. (1968), “Internationally diversified portfolios”, American Economic Review 58, pp. 1299-1314.
Floreani, V.A. and Habib, M.M. (2018), “The euro area bias and the role of financial centres”, International Journal of Finance & Economics, 23(3), pp. 233-256.
Karolyi, G.A. and Stulz, R.M. (2003), “Are financial assets priced locally or globally?”, Handbook of the Economics of Finance, 1, pp. 975-1020.
Lane, P.R. and Milesi-Ferretti, G.M. (2005), The international equity holdings of euro area investors.
Lane, P.R. and Milesi-Ferretti, G.M. (2010), “Cross-border investment in small international financial centers”, Working Paper, No 10-38, International Monetary Fund.
Lewis, K.K. (1999), “Trying to explain home bias in equities and consumption”, Journal of economic literature, 37(2), pp. 571-608.
Monti, P. and Felettigh, A. (2008), “How to Interpret the CPIS Data on the Distribution of Foreign Portfolio Assets in the Presence of Sizeable Cross-border Positions in Mutual Funds-Evidence for Italy and the Main Euro-Area Countries”, Occasional Paper, Bank of Italy, p. 16.
Obstfeld, M. (1992), “Risk-taking, global diversification, and growth”, Working Paper, No w4093, National Bureau of Economic Research.
Schoenmaker, D. and Bosch, T. (2008), “Is the home bias in equities and bonds declining in Europe?”, Investment Management and Financial Innovations, 5, pp. 90-102.
Sørensen, B.E., Wu, Y.T., Yosha, O. and Zhu, Y. (2007), “Home bias and international risk sharing: Twin puzzles separated at birth”, Journal of international money and finance, 26(4), pp. 587-605.
World Bank (2019), “Market capitalization of listed domestic companies”, World Development Indicators.
Zucman, G. (2013), “The missing wealth of nations: are Europe and the US net debtors or net creditors?”, The Quarterly Journal of Economics, 128(3), pp. 1321-1364.
- [1]We would like to thank Sonja Dobkowitz for her valuable contributions.
- [2]There are a number of studies investigating the reasons for home bias, which include hedging domestic risks, explicit costs of foreign investments, information asymmetries, familiarity stemming from trade, governance and transparency issues and behavioural biases, among other things (see Cooper et al. (2012) for a review). Coval et al. (2001) find that fund managers earn high returns in geographically proximate investments.
- [3]See ECB Investment Fund Statistics.
- [4]There are a number of other studies showing that financial centres may distort the interpretation of cross-border financial statistics (Monti and Felettigh (2008), Lane and Milesi-Ferretti (2010), Zucman (2013), Floreani and Habib (2018)).
- [5]Anecdotal evidence suggests that fund managers in the euro area are in some cases domiciled in a different country than the fund domicile. While we do not have data on the fund managers’ countries, this point further suggests that using fund domicile as investment origin may be misleading when measuring home bias.
- [6]These investments are already captured when the funds are held by non-investment fund euro area investor sectors. Therefore, adding them could result in double-counting funds’ investments in other funds.
- [7]In 2018, around 7% of euro area investors’ assets were held in funds domiciled outside the euro area, with Japan and the United States as the most important fund domiciles in this regard. Since we do not have data on non-euro area investors, these investments are linked with the available euro area investors. To avoid the risk of overestimating international exposures, we also conduct our analyses excluding investments in non-euro area-domiciled funds. While this would decrease aggregate non-euro area exposures relative to total exposures, the home bias measures remain robust, both in direction and magnitude, across euro area countries.
- [8]The effect is robust for equity and bond securities: when restricting the sample to bond and equity securities separately, the home bias is still lower across all euro area countries when taking the fund holder country as investment origin, relative to taking the fund domicile as investment origin.
- [9]See also Coletta and Santioni (2019) for a comprehensive description of foreign funds held by Italian households.
- [10]Following (i), only considers the share of country j in the fund holdings for domicile country j.
- [11]This section focuses on equity investments, because we use the market capitalisation of listed domestic companies (World Bank (2019)), which applies to equities. Note that the correction using the look-through approach for debt securities provides a similar picture with relatively lower euro area investments and higher investments outside the euro area.
- [12]Directive (EU) 2019/1160 of the European Parliament and of the Council of 20 June 2019 amending Directives 2009/65/EC and 2011/61/EU with regard to cross-border distribution of collective investment undertakings (OJ L 188, 12.7.2019, p. 106).
- [13]Regulation (EU) 2019/1156 of the European Parliament and of the Council of 20 June 2019 on facilitating cross-border distribution of collective investment undertakings and amending Regulations (EU) No 345/2013, (EU) No 346/2013 and (EU) No 1286/2014 (OJ L 188, 12.7.2019, p. 55).
- [14]See Savings and Sustainable Investment Union.