
Economic Bulletin Issue 5, 2023
Update on economic, financial and monetary developments
Summary
Inflation continues to decline but is still expected to remain too high for too long. The Governing Council is determined to ensure that inflation returns to its 2% medium-term target in a timely manner. It therefore decided at its meeting on 27 July 2023 to raise the three key ECB interest rates by 25 basis points.
The rate increase reflects the Governing Council’s assessment of the inflation outlook, the dynamics of underlying inflation, and the strength of monetary policy transmission. The developments since its meeting on 15 June support the expectation that inflation will drop further over the remainder of 2023 but will stay above target for an extended period. While some measures show signs of easing, underlying inflation remains high overall. The past rate increases continue to be transmitted forcefully: financing conditions have tightened again and are increasingly dampening demand, which is an important factor in bringing inflation back to target.
The Governing Council’s future decisions will ensure that the key ECB interest rates will be set at sufficiently restrictive levels for as long as necessary to achieve a timely return of inflation to the 2% medium-term target. The Governing Council will continue to follow a data-dependent approach to determining the appropriate level and duration of restriction. In particular, its interest rate decisions will continue to be based on its assessment of the inflation outlook in light of the incoming economic and financial data, the dynamics of underlying inflation, and the strength of monetary policy transmission.
The Governing Council also decided to set the remuneration of minimum reserves at 0%. This decision will preserve the effectiveness of monetary policy by maintaining the current degree of control over the monetary policy stance and ensuring the full pass-through of the interest rate decisions to money markets. At the same time, it will improve the efficiency of monetary policy by reducing the overall amount of interest that needs to be paid on reserves in order to implement the appropriate stance.
Economic activity
The near-term economic outlook for the euro area has deteriorated, owing largely to weaker domestic demand. High inflation and tighter financing conditions are dampening spending. This is weighing especially on manufacturing output, which is also being held down by weak external demand. Housing and business investment are showing signs of weakness as well. Services remain more resilient, especially in contact-intensive subsectors such as tourism. But momentum is slowing in the services sector. The economy is expected to remain weak in the short run. Over time, falling inflation, rising incomes and improving supply conditions should support the recovery.
The labour market remains robust. The unemployment rate stayed at its historical low of 6.5% in May and many new jobs are being created, especially in the services sector. At the same time, forward-looking indicators suggest that this trend might slow down in the coming months and may turn negative for manufacturing.
As the energy crisis fades, governments should roll back the related support measures promptly and in a concerted manner. This is essential to avoid driving up medium-term inflationary pressures, which would otherwise call for a stronger monetary policy response. The Governing Council welcomes the Eurogroup statement of 13 July 2023 on the euro area fiscal stance, which is consistent with this assessment.[1] Fiscal policies should be designed to make the euro area economy more productive and to gradually bring down high public debt. Policies to enhance the euro area’s supply capacity can help reduce price pressures in the medium term, while supporting the green transition, which is also being furthered by the Next Generation EU programme. The reform of the EU’s economic governance framework should be concluded before the end of 2023.
Inflation
Inflation came down further in June, reaching 5.5%, after 6.1% in May. Energy prices fell again, dropping by 5.6%, year on year. Food price inflation continued to slow but remained high, at 11.6%.
Inflation excluding energy and food edged up to 5.5% in June, with goods and services following diverging trends. Goods inflation decreased further, to 5.5%, from 5.8% in May. Conversely, services inflation rose to 5.4%, from 5.0% in May, owing to robust spending on holidays and travel and also reflecting upward base effects.
The drivers of inflation are changing. External sources of inflation are easing. By contrast, domestic price pressures, including from rising wages and still robust profit margins, are becoming an increasingly important driver of inflation.
While some measures are moving lower, underlying inflation remains high overall, including owing to the persistent impact of past energy price increases on economy-wide prices. Although most measures of longer-term inflation expectations currently stand at around 2%, some indicators remain elevated and need to be monitored closely.
Risk assessment
The outlook for economic growth and inflation remains highly uncertain. Downside risks to growth include Russia’s unjustified war against Ukraine and an increase in broader geopolitical tensions, which could fragment global trade and thus weigh on the euro area economy. Growth could also be slower if the effects of monetary policy are more forceful than expected, or if the world economy weakens and thereby dampens demand for euro area exports. Conversely, growth could be higher than projected if the strong labour market, rising real incomes and receding uncertainty mean that people and businesses become more confident and spend more.
Upside risks to inflation include potential renewed upward pressures on the costs of energy and food, also related to Russia’s unilateral withdrawal from the Black Sea Grain Initiative. Adverse weather conditions, in light of the unfolding climate crisis, may push up food prices by more than projected. A lasting rise in inflation expectations above the Governing Council’s target, or higher than anticipated increases in wages or profit margins, could also drive inflation higher, including over the medium term. By contrast, weaker demand – for example owing to a stronger transmission of monetary policy – would lead to lower price pressures, especially over the medium term. Moreover, inflation would come down faster if declining energy prices and lower food price increases were to pass through to the prices of other goods and services more quickly than currently anticipated.
Financial and monetary conditions
The monetary policy tightening continues to be transmitted strongly to broader financing conditions. Risk-free interest rates over short to medium-term maturities have increased since the meeting in June and funding has become more expensive for banks, in part owing to the ongoing phasing-out of the ECB’s targeted longer-term refinancing operations (TLTROs). The large TLTRO repayment in June went smoothly, as banks were well prepared. Average lending rates for business loans and mortgages rose again in May, to 4.6% and 3.6% respectively.
Higher borrowing rates and the associated cuts in spending plans led to a further sharp drop in credit demand in the second quarter, as reported in the July 2023 euro area bank lending survey. Moreover, credit standards for loans to firms and households tightened further, as banks are becoming more concerned about the risks faced by their customers and are less willing to bear these risks. Tighter financing conditions are also making housing less affordable and less attractive as an investment, and demand for mortgages has dropped for the fifth quarter in a row.
Against this background, the annual growth rate of lending continued to decrease in June, falling to 3.0% for firms and 1.7% for households, with annualised growth rates of 0.0% and -0.2% in the second quarter respectively. Amid weak lending and the reduction in the Eurosystem balance sheet, the annual growth rate of broad money fell to 0.6% in June, with an annualised growth rate of -1.1% in the second quarter.
Monetary policy decisions
The Governing Council decided to raise the three key ECB interest rates by 25 basis points. Accordingly, the interest rate on the main refinancing operations and the interest rates on the marginal lending facility and the deposit facility were increased to 4.25%, 4.50% and 3.75% respectively, with effect from 2 August 2023.
The asset purchase programme portfolio is declining at a measured and predictable pace, as the Eurosystem no longer reinvests the principal payments from maturing securities.
As concerns the pandemic emergency purchase programme (PEPP), the Governing Council intends to reinvest the principal payments from maturing securities purchased under the programme until at least the end of 2024. In any case, the future roll-off of the PEPP portfolio will be managed to avoid interference with the appropriate monetary policy stance.
The Governing Council will continue applying flexibility in reinvesting redemptions coming due in the PEPP portfolio, with a view to countering risks to the monetary policy transmission mechanism related to the pandemic.
As banks are repaying the amounts borrowed under the TLTROs, the Governing Council will regularly assess how targeted lending operations and their ongoing repayment are contributing to its monetary policy stance.
The Governing Council also decided to set the remuneration of minimum reserves at 0%. The change will become effective as of the beginning of the reserve maintenance period starting on 20 September 2023. This decision does not prejudge the outcome of the ongoing review of the ECB’s operational framework.
Conclusion
Inflation continues to decline but is still expected to remain too high for too long. The Governing Council therefore decided at its meeting on 27 July 2023 to raise the three key ECB interest rates by 25 basis points.
The Governing Council’s future decisions will ensure that the key ECB interest rates will be set at sufficiently restrictive levels for as long as necessary to achieve a timely return of inflation to its 2% medium-term target. It will continue to follow a data-dependent approach to determining the appropriate level and duration of restriction. In particular, its interest rate decisions will continue to be based on its assessment of the inflation outlook in light of the incoming economic and financial data, the dynamics of underlying inflation, and the strength of monetary policy transmission.
In any case, the Governing Council stands ready to adjust all of its instruments within its mandate to ensure that inflation returns to its medium-term target and to preserve the smooth functioning of monetary policy transmission.
1 External environment
Global economic activity in the second quarter of 2023 remained resilient, but incoming data show some loss of momentum. The global divergence between the services and manufacturing sectors widened further in June, driven by the recent lacklustre performance of manufacturing in advanced economies. At the same time, the near-term global trade outlook is clouded by weak merchandise trade, particularly in advanced economies, while services trade continues to improve. Headline inflation across OECD economies continued to decline as food and energy price pressures abate, while core inflation remains at high levels.
Global activity remained resilient in the second quarter, but incoming survey data have started to show signs of a loss of momentum. The global composite output Purchasing Managers’ Index (PMI) declined in June for the first time this year, amid moderation in both manufacturing and services (Chart 1, panel a). The services output PMI edged down, but it remained above the neutral threshold and close to its historical benchmark. At the same time, the manufacturing output PMI fell into contractionary territory, particularly in advanced economies. This weakness in manufacturing, possibly due to the higher sensitivity to tightening financial conditions and to the continued rotation of demand towards services, has in recent months led to a decoupling between manufacturing and services activity.
The global divergence between the services and manufacturing sectors widened further in June. PMI data suggest that the divergence is currently driven by the recent lacklustre performance of manufacturing in advanced economies. Earlier in the year China’s rebound in services demand – following the reopening of the Chinese economy – was the main factor behind the divergence (Chart 1, panel b). Going forward, while the weakness in manufacturing could potentially spill back to services through lower aggregate demand, national accounts data for major economies show that services consumption is still below pre-pandemic benchmarks, in contrast with goods consumption, leaving room for further improvement over upcoming months.
Chart 1
Global (excluding euro area) composite PMI
a) PMI output by sector
(aggregate diffusion indices)
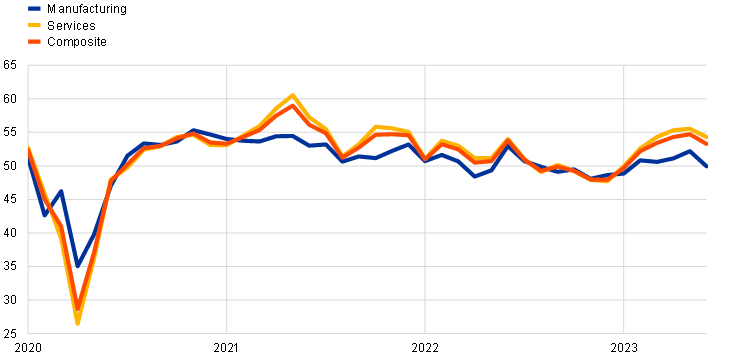
b) Difference between manufacturing output and services activity by regional contributions
(difference between diffusion indices)
Sources: S&P Global, Haver Analytics and ECB calculations.
Notes: Panel a) shows composite output, manufacturing output and services activity diffusion indices, whereas panel b) shows the difference between global services activity and manufacturing output. The latest observations are for June 2023.
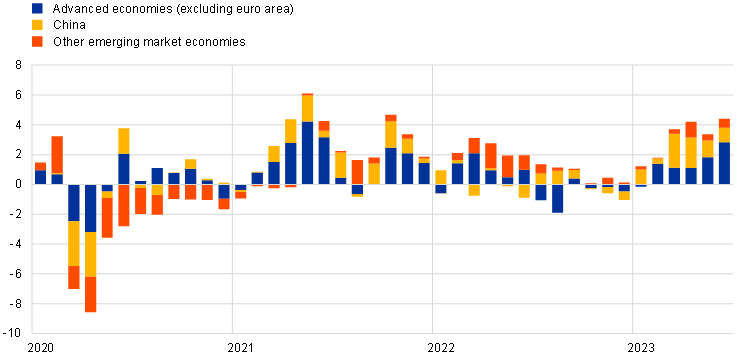
The near-term global trade outlook is clouded by weak merchandise trade, while services trade continues to improve. At the start of the second quarter, merchandise trade momentum gradually improved amid supply bottlenecks dissipating further and the reopening in China, but it remained muted reflecting weak data releases, particularly in advanced economies (Chart 2). Global demand for goods continues to soften on the back of uneven growth dynamics between goods and services and points to a subdued merchandise trade, as also indicated by the latest contractionary new export order PMI readings. In contrast, services trade remains strong, with tourism in particular still recovering towards pre-pandemic levels.
Chart 2
Merchandise trade momentum
(real imports, 3-month-on-3-month percentage changes)
Sources: CPB and ECB staff calculations.
Note: The latest observations are for May 2023.
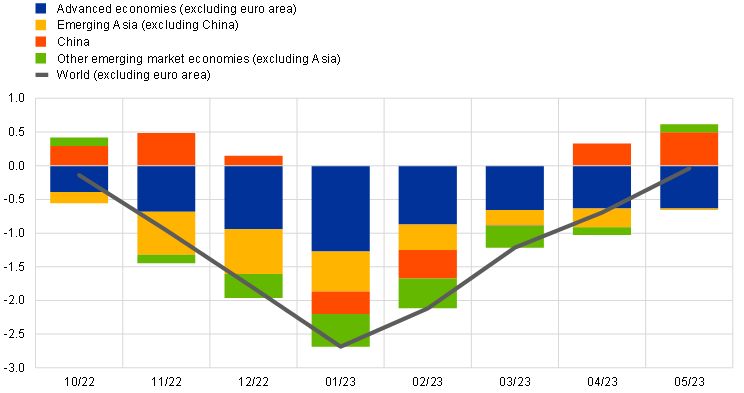
OECD headline inflation continued to decline as food and energy price pressures abate while core inflation remained at high levels. In May, annual headline consumer price index (CPI) inflation in OECD countries (excluding Türkiye) declined strongly to 6.5% from 7.4% in April, mainly driven by falling energy and food prices, together with base effects. In contrast, core inflation declined only marginally to 6.9% (Chart 3). Similarly, core inflation momentum remains high and edged down only slightly, pointing to persistent price pressures. Indeed, while producer prices are declining strongly, wages continue to exert upward pressure.
Chart 3
OECD consumer price inflation
(annual percentage changes; percentage point contributions)

Sources: OECD and ECB staff calculations.
Notes: The OECD aggregate excludes Türkiye and is calculated using OECD CPI annual weights. The latest observations are for May 2023.
Oil prices increased by 13% since the June Governing Council meeting following Saudi Arabia’s one-month extension of its production cut (Chart 4). Saudi Arabia announced that it would cut its production by one million barrels per day in July, and this cut has now been extended to also cover August. At the same time, Russia announced a 0.5 million barrels per day cut for August. The cuts are expected to further tighten the oil market in a period it was already expected to move from being in surplus to deficit. On the demand side, in the last couple of months, strong oil demand from travel and transport activity in China has counterbalanced weak industrial demand in advanced economies. But more recently, improved risk sentiment reflecting in part positive US economic data surprises and lower headline inflation releases contributed positively to oil prices. European gas prices declined by 16% since the June Governing Council meeting after a short period of volatility. Gas prices rallied by 33% in the two days leading up to the Governing Council meeting in June mainly due to gas field outages in Norway. The price decline since then reflects the fact that gas storage remains high and gas demand low. International food commodity prices increased by 3% since the June Governing Council meeting as Russia withdrew from the Black Sea deal on Ukrainian grain. Since last year, Ukraine has found alternative routes which it could possibly use for some of the grain exports that are usually shipped via the Black Sea, albeit at higher costs. Therefore, the disruptions to grain supplies are expected to be smaller than at the start of the Russian invasion, implying that price spikes such as those seen in the spring of 2022 are unlikely to occur. However, weather developments pose further upside risks to food commodity prices, as short-term drought risks in the northern hemisphere remain elevated. Meanwhile, in metal markets, weak activity in the industrial sector and the property development sector in China was counterbalanced by the improved risk sentiment.
Chart 4
(USD per barrel)
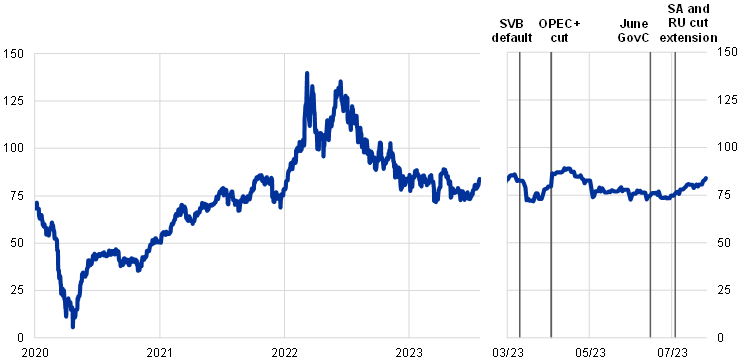
Source: Refinitiv.
Notes: The lines mark the following events: 10 March 2023 for the Silicon Valley Bank failure, 2 April 2023 for the OPEC+ cut announcement, 15 June 2023 for the June Governing Council and 3 July 2023 for the cut extension announcement by Saudi Arabia and Russia. The latest observations are for 26 July 2023.
In the United States, economic activity has been more resilient than expected. Growth for the first quarter of 2023 was revised upwards to an annualised 2.0%. Moreover, monthly indicators for the second quarter, including non-residential construction, employment and inventory data, came in stronger than expected. In particular, although gradually cooling, the buoyant US labour market continues to support growth. The unemployment rate remains at very low levels, employment continues to grow, and vacancies are only falling slowly. However, despite the past resilience, downside risks to activity prevail. For instance, the US manufacturing PMI has been in contractionary territory for most of the last few months. Moreover, delinquency rates on credit card debt and car loans have risen rapidly over the last few months, suggesting slowing consumption ahead. Annual headline CPI inflation fell in June to 3.0%, while underlying inflationary pressures remain high, with core at 4.8%. At the same time, annual nominal wage growth is still 4.7%, above a level considered compatible with the inflation target.
In China, GDP growth slowed significantly in the second quarter. Although year-on-year GDP growth rose to 6.3% in the second quarter, reflecting base effects due to COVID-19-related lockdowns a year ago, it decelerated in quarter-on-quarter terms to 0.8%, from 2.2% in the first quarter. The consumption-led recovery appears to have been short-lived, owing to a renewed decline in the housing sector and a deceleration in consumer spending. Exports also declined sharply, reflecting weak external demand, in particular for manufactured goods. This is due to the post-pandemic global rotation in demand from manufactured goods to services. The decline in the growth momentum is expected to prompt additional monetary and fiscal policy support going forward. Indeed, in mid-June, the People’s Bank of China lowered to 2.65% the one-year medium-term lending facility rate.
In Japan, recent indicators point towards some moderation in economic growth in the second quarter. Consumer sentiment, despite further declines in real wages, should provide support to the recovery in private consumption, which has remained relatively sluggish thus far. Also, business sentiment indicators point to solid but moderate growth momentum. Headline inflation rose slightly to 3.3% in June, reflecting increases in regulated electricity prices. Core inflation (excluding energy and food prices) remained unchanged from the previous month at 2.6%, implying a firm underlying price momentum. As regards wages, the final annual spring wage negotiation (Shunto) results point to wage increases of 3.6%, the highest since the early 1990s.
In the United Kingdom, a stream of positive data news suggests stronger than expected resilience of the economy, while inflation remains high. Monthly real GDP declined less than expected by 0.1% in May, following an increase in April, as domestic demand has remained resilient, favoured by a robust labour market and despite the worsening cost-of-living crisis. Growth is still expected to pick up in the third quarter, but tighter financial conditions are weighing on private consumption and investment. Headline inflation fell to 7.9% in June, while core inflation decreased to 6.9% due to an easing in services price inflation. The outturn was below market expectations, but in line with the Bank of England’s May 2023 Monetary Policy Report forecast. Looking ahead, headline inflation is expected to decline further, mainly on account of the waning contribution from energy prices. Still, price pressures are expected to remain elevated due to the tight labour market, resilient demand and persistence in food price inflation.
2 Economic activity
Euro area activity stagnated in the first quarter of 2023, amid a drop in domestic demand, and improved moderately in the second quarter, in line with the June Eurosystem staff macroeconomic projections for the euro area.[2] Conditions continue to differ across and within sectors of the economy: the manufacturing and construction sectors have been particularly affected by weaker demand and tightening financing conditions, while services have been more resilient, in particular leisure activities. But momentum is slowing in the services sector and the economy is expected to remain weak in the short term. Household incomes are benefiting from the strong labour market, bolstered by robust employment growth, as well as easing inflation. Nevertheless, the outlook for economic growth remains highly uncertain. Although falling inflation, rising incomes and improving supply conditions should support a recovery, weakening global demand and the growing impact of tightening financing conditions are expected to weigh on economic activity.
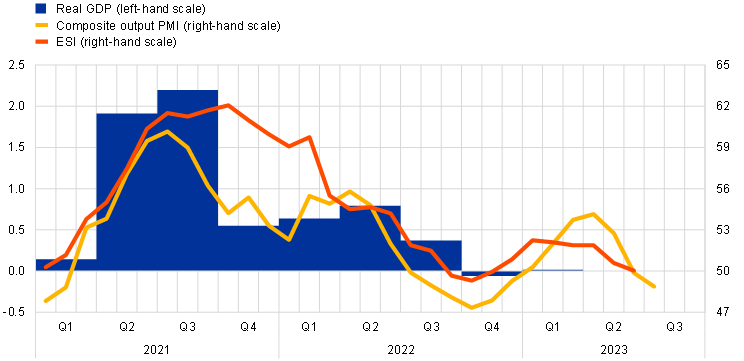
After being flat in the first quarter, euro area real GDP growth improved moderately in the second quarter. Following a contraction of 0.1% quarter on quarter at the end of last year, euro area real GDP was flat in the first quarter of 2023, based on updated data releases for that quarter for several euro area countries, including a significant upward revision of Irish GDP (from -4.6% to -2.8%) (Chart 5). For the second quarter of 2023, incoming data suggest a slight improvement in GDP growth. According to the June Eurosystem staff macroeconomic projections, it was expected to expand by 0.3% quarter on quarter. Contact-intensive services are expected to have supported economic activity in the second quarter, while manufacturing production is likely to have contracted again. The composite output Purchasing Managers’ Index (PMI) for the euro area slipped into contractionary territory in June, reflecting heterogenous developments across sectors. The PMI for services activity averaged 54.4 in the second quarter, continuing to indicate growth (Chart 6, panel b), despite having moderated in June. New orders and activity expectations for services have, however, also started to decline, although they are still in line with ongoing growth. By contrast, the PMI for industrial output declined further in June, having contracted to 46.4 in the second quarter. Outstanding business deteriorated, reflecting sustained but moderating production growth, alongside falling new orders (Chart 6, panel a). Weak industrial production at the end of the first quarter resulted in a negative carry-over to the second quarter, although this was largely offset by a positive carry-over from services production. Furthermore, despite having recovered in April and May, the average level of industrial production (excluding construction) in those two months was 1.5% below that of the first quarter of the year. The European Commission’s Economic Sentiment Indicator (ESI) declined further in June and was consistent with modest growth in the second quarter (Chart 5).
Chart 5
Euro area real GDP, composite output PMI and ESI
(left-hand scale: quarter-on-quarter percentage changes; right-hand scale: diffusion index)
Sources: Eurostat, European Commission, S&P Global Market Intelligence and ECB calculations.
Notes: The two lines indicate monthly developments; the bars show quarterly data. The European Commission’s Economic Sentiment Indicator (ESI) has been standardised and rescaled to have the same mean and standard deviation as the composite output Purchasing Managers’ Index (PMI). The latest observations are for the first quarter of 2023 for real GDP, June 2023 for the ESI and July 2023 for the composite output PMI.
Euro area output is expected to rise moderately in the third quarter, mainly supported by the services sector. Activity in the manufacturing sector is estimated to remain weak, on the back of the growing impact of weak global trade and the strengthening of monetary policy transmission. However, expected demand remains robust in contact-intensive services, particularly in travel services, as indicated by the European Commission’s business and consumer survey. This is consistent with the main findings from the ECB’s recent contacts with the non-financial sector (Box 3), which pointed to a high degree of heterogeneity of expected activity across and within sectors, with demand in tourism-related sectors remaining strong and expected to support activity in the third quarter. Although the PMI for services was still improving in July, the pace was much slower than earlier this year, suggesting that the weakening of the manufacturing sector is starting to spill over to services. Going forward, the outlook for activity will continue to benefit from the tailwinds generated by receding supply bottlenecks, moderating energy prices and resilient labour markets. These supporting factors will cushion weakening global demand and the increasing impact of tightening financing conditions.
Chart 6
PMI indicators across sectors of the economy
a) Manufacturing
(indices, diffusion indices)

b) Services
(indices, diffusion indices)

Sources: Eurostat and S&P Global Market Intelligence.
Note: The latest observations are for April 2023 for services production, May 2023 for industrial production and July 2023 for the Purchasing Managers’ Indices (PMIs).
The labour market remains robust, driven by the services sector, although more recent indicators suggest signs of weakness. Following the strong employment growth of 0.5% in the first quarter of the year (Chart 7), recent monthly data suggest slightly weaker labour market momentum in the second quarter. While the unemployment rate remained unchanged at 6.5% in May, down by 0.2 percentage points since May 2022, the positive employment dynamics are continuing to be driven by an increase in the labour force. More specifically, the labour force dynamics for young, low-skilled and foreign workers are above their long-term trends and would seem to underly much of this positive trend.
Chart 7
Euro area employment, PMI employment indicator and the unemployment rate
(left-hand scale: quarter-on-quarter percentage changes, diffusion index; right-hand scale: percentages of the labour force)

Sources: Eurostat, S&P Global Market Intelligence and ECB calculations.
Notes: The two lines indicate monthly developments, while the bars show quarterly data. The Purchasing Managers’ Index (PMI) is expressed in terms of the deviation from 50 divided by 10. The latest observations are for the first quarter of 2023 for employment, July 2023 (Eurostat flash estimate) for the PMI employment indicator and May 2023 for the unemployment rate.
While the PMI employment indicator suggests a slowdown in employment dynamics, it still points to employment growth in the second quarter. While the PMI employment indicator dropped to 53.1 in June, it continued to point to an expansion in employment. However, the aggregate PMI employment indicator hides a pronounced sectoral divide. The expansion in June was confined to the services sector, with the manufacturing component moving into contractionary territory for the first time since January 2021. At 49.8, the index suggests growing downside risks to employment growth, in particular in countries with a higher proportion of employment in the manufacturing sector. The preliminary PMI indicators for July show a further deceleration in employment dynamics, suggesting rather meagre (or even flat) employment growth in the third quarter.
Private consumption is expected to have been sluggish in the second quarter, despite resilient services consumption, reflecting a further contraction for goods. Private consumption contracted by 0.3% in the first quarter, driven by a decline in spending on goods. Incoming data point to a further drop in consumption of goods in the second quarter, while services consumption is likely to have remained resilient. The expectation of weak consumer goods spending is supported by recent developments in retail sales. From April to May retail sales were, on average, 0.3% below their level in the first quarter. However, this masked an increase in sales of non-food products and a decline in sales of fuels and food. At the same time, new passenger car registrations in the second quarter were 1% below their level in the first quarter, despite easing supply conditions. By contrast, services consumption is likely to have remained resilient, benefiting from lingering post-pandemic reopening effects, as suggested by the PMI for contact-intensive services activity, which, despite moderating in June, remained in expansionary territory in the second quarter.
Incoming data show signs of a stronger outlook for contact-intensive services than for consumer spending on goods, especially in the short term. The European Commission’s business and consumer survey results for June suggest that expected demand for contact-intensive services remained above its historical average level in June (Chart 8, panel b). The ECB’s June Consumer Expectations Survey (CES) and the ECB’s recent contacts with the non-financial sector likewise point to relatively strong expected demand for contact-intensive services. The European Commission’s consumer confidence indicator rose further in June and July, mainly reflecting improving household expectations about their financial and general economic situation. Strong nominal labour and non-labour income growth has so far supported households’ purchasing power. However, the tightening of financing conditions and higher interest rates are likely to increase households’ incentive to save, weighing on private consumption. CES evidence shows that consumers’ expectations concerning interest rates on mortgages and savings accounts have increased, in line with actual interest rate developments (Box 2). Consistent with this, the household savings rate marginally increased to 14.1% of disposable income in the first quarter of 2023.
Chart 8
Expected manufacturing production and expected services demand
(percentage balances)

Source: European Commission.
Note: The latest observations are for June 2023.
Despite its resilience at the beginning of the year, business investment is expected to have weakened in the second quarter as activity slows in response to increasingly tighter financing conditions. Quarter-on-quarter headline non-construction investment remained flat in the first quarter of 2023, but would have been higher had the volatile contribution from intangible investment in Ireland been excluded. Although capital goods production bounced back in April and May, survey data suggest a weakening in business investment in the current quarter. The output PMI fell below the no-growth threshold in the second quarter. Despite an improvement in suppliers’ delivery times, the PMIs for new orders and for outstanding business for the manufacturing and capital goods sector declined further in the second quarter, remaining in negative territory, and firms’ confidence in that sector also deteriorated (Chart 9). The July 2023 euro area bank lending survey (BLS) indicates that firms’ demand for long-term loans and loans for fixed investment has diminished markedly in recent quarters and is expected to continue to decline in the second quarter. In past recession episodes, this pattern has preceded major falls in business investment, but this is not reflected in the overall flat annual growth observed so far. Consistent with the information from the BLS, the October 2022/March 2023 Survey on the Access to Finance of Enterprises (SAFE) suggests that more firms expect a deterioration in the availability of bank loans over the next six months, despite a mild improvement. The SAFE also points to firms anticipating an increase in turnover in the second and third quarters, with internal financing becoming increasingly important, thereby partially offsetting the negative effects of higher borrowing costs on business investment. Moreover, the evidence provided by the July 2023 ECB’s Corporate Telephone Survey (CTS) suggests that green and digital investments, which are also the main beneficiaries of Next Generation EU (NGEU) funds, remain relatively resilient. Both internal funding and NGEU funds are key to sustaining capital investment going forward.
Chart 9
Business investment and capital goods indicators
(quarter-on-quarter changes, deviations from the mean)

Sources: Eurostat, European Commission, S&P Global Market Intelligence and ECB calculations.
Notes: Business investment is proxied by non-construction investment and excludes Irish intellectual property products. The Purchasing Managers’ Indices (PMIs) for outstanding business and for new orders are expressed as deviations from 50 and the European Commission’s manufacturing confidence indicator as deviations from its long-term average. The latest observations are for the first quarter of 2023 for investment and June 2023 for the other variables.
Housing investment is estimated to have contracted in the second quarter, amid deteriorating housing demand and financing conditions. After a quarter-on-quarter increase of 1.3% in the first quarter of 2023, thanks to a large backlog of orders and favourable weather conditions, housing investment declined in the second quarter, based on both hard and soft indicators. In terms of hard indicators, the number of residential building permits issued – a leading indicator of construction activity – has plunged over the last year, reaching a seven-year low (disregarding the pandemic lockdowns of April and May 2020) in March 2023. Building construction output in April and May stood 1.2% below its average in the first quarter. In terms of soft indicators, the output PMI for residential construction sank deeper into contractionary territory until June, despite strong improvements in suppliers’ delivery times and with input prices in retreat. The European Commission’s index for building construction activity in the past three months recorded its fifth consecutive decline in the second quarter, with depressed demand, tight financial conditions and labour shortages retaining their firm grip on production in this sector. Forward-looking indicators also suggest subdued activity in the third quarter, with rising mortgage rates and elevated construction costs weighing on housing affordability and profitability respectively, as confirmed by the latest ECB surveys. According to the CES, households’ perceptions of housing as a good investment bottomed out in January, but were still downbeat in June (Box 2). In the latest CTS, companies reported declining activity and orders, especially in residential building construction, owing to elevated cost pressures and rising interest rates.
Euro area export volumes are expected to grow at a subdued rate in the second quarter due to weakening global trade and euro exchange rate appreciation. The growth momentum for extra-euro area goods exports (based on three-month-on-three-month growth rates) fell moderately in May, with weak global trade dampening demand for euro area goods and the effects of the appreciation of the euro since autumn last year weighing on competitiveness. The boost for manufacturing exports from easing supply bottlenecks appears to be fading, with firms reporting that they have brought order backlogs back down to normal levels. Exports of services, in particular travel services, bolstered total euro area exports. The growth momentum for euro area import volumes has stabilised but remains negative, reflecting weak domestic demand. This has resulted in firms reducing their stocks and a decline in energy imports. Forward-looking indicators continue to point to a subdued near-term outlook for euro area export volumes. New manufacturing export orders fell deeper into contractionary territory in June and, despite lower energy prices having relieved some of the pressure on euro area exporters’ competitiveness, global trade in goods remains weak. At the same time, the PMI for new orders for services exports slowed. Tourism is, however, expected to be buoyant this summer season, on the back of a strong increase in bookings earlier this year.
Beyond the near term, GDP growth is expected to gradually strengthen. On the one hand, the economy is expected to return to growth in the coming quarters as energy prices moderate, foreign demand strengthens and supply bottlenecks are resolved. Furthermore, real incomes are set to improve, underpinned by a robust labour market, with unemployment hitting new historical lows, and moderating inflation. On the other hand, the ECB’s monetary policy tightening is increasingly feeding through to the real economy and, together with the gradual withdrawal of fiscal support, this will weigh on domestic demand and price pressures in the medium term.
3 Prices and costs
Inflation came down further in June 2023, reaching 5.5% after 6.1% in May. Energy prices fell again, dropping by 5.6% year on year. Food inflation continued to slow but remained high, at 11.6%. Inflation excluding energy and food edged up from 5.3% in May to 5.5% in June owing to robust spending on holidays and travel, reflecting upward base effects and a rise in services inflation to 5.4%. External sources of inflation are easing, while domestic price pressures, including from rising wages and still robust profit margins, are becoming an increasingly significant driver of inflation. While some measures are decreasing, underlying inflation remains high overall, in part owing to the persistent impact of past energy price increases on economy-wide prices. Although most measures of longer-term inflation expectations currently stand at around 2%, some indicators remain elevated.
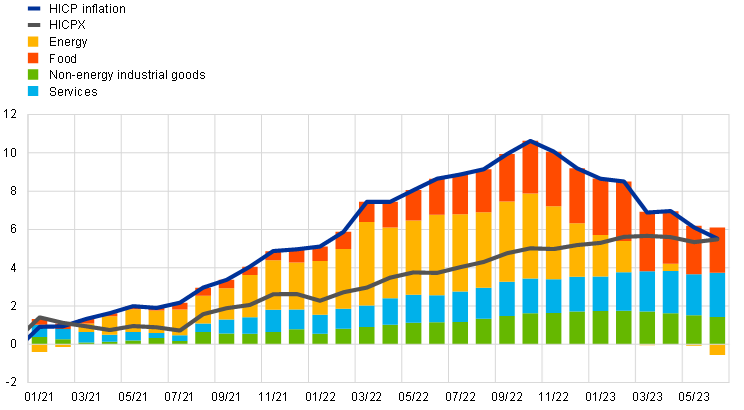
Harmonised Index of Consumer Prices (HICP) inflation in the euro area continued to decline in June. The further decrease to 5.5%, from 7.0% in April and 6.1.% in May, was largely driven by energy inflation, which continued on its descending path, falling to -5.6% in June from -1.8% in the previous month. Inflation rates for other goods (both food and non-energy industrial goods) also declined further in June. In fact, the only main component that saw an increase was services, which registered 5.4%, edging up from 5.0% in May. This implies a rise in HICP inflation excluding energy and food (HICPX) to 5.5% after its decline to 5.3% in May. The robust services inflation reflects the strength of tourism, recreation and pent-up demand, as well as increasing labour costs. However, the uptick in June was essentially a result of upward base effects related to last year’s temporary introduction of a €9 public transport ticket in Germany (Chart 10).
Chart 10
Headline inflation and its main components
(annual percentage changes; percentage point contributions)
Sources: Eurostat and ECB calculations.
Note: The latest observations are for June 2023.
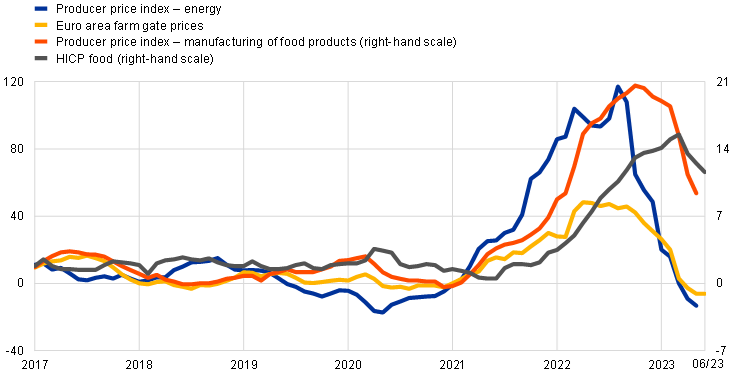
Energy inflation remains negative, primarily owing to downward base effects, but also to a further moderation in the level of consumer energy prices in June. Since its peak in October 2022 this level has unwound by 14%, mostly owing to lower fuel and gas prices. At the same time, while in recent months consumer electricity prices inflation has been declining in year-on-year terms, it is still 40% higher than before the pandemic; it is not, however, putting further pressure on overall consumer energy price inflation. Pipeline pressures for energy prices have continued to fall, with annual growth in energy producer prices declining to -13.3% in May 2023, down from a peak of 117.3% in August 2022 (Chart 11).
Although it is declining, food inflation remains high, with previous cost shocks still passing through. Food inflation declined from 12.5% in May to 11.6% in June, with processed food standing at 12.4%, down from 13.4% in May. Unprocessed food also registered a decline, to 9.0% from 9.6% in May. Although the peak seems to have passed, food inflation remains high, especially for processed food, and it continues to be a burden for households’ purchasing power (Chart 11). While the impacts of earlier cost shocks, such as with energy prices, should gradually abate, a stronger contribution to high food inflation could come from the strengthened growth in labour costs, Russia’s unilateral decision to end the Black Sea Grain Initiative and the extreme weather conditions in some countries, as droughts and floods could imply upward pressures.
Chart 11
HICP food prices and costs of energy and food input
(annual percentage changes)
Source: Eurostat.
Note: The latest observations are for May 2023 for “Producer price index – energy” and “Producer price index – manufacture of food products” and June 2023 for the remaining items.
While some measures show signs of easing, underlying inflation remains high overall. (Chart 12). This owes inter alia to the persistent impact of past energy price increases on economy-wide prices. HICPX inflation edged up to 5.5% in June from 5.3% in May owing to upward base effects in services, namely those stemming from the above-mentioned German public transport ticket. These upward base effects also affected some other indicators, most notably the HICPXX (i.e. HICPX minus volatile travel, footwear and clothing-related items), which also rose in June. By contrast, other regularly monitored indicators continued on the declining path that started in April. The domestic inflation indicator, which excludes items with a high import content, remained broadly unchanged in June. The Supercore indicator, which comprises cyclically sensitive HICP items, decreased to 6.0%, down from 6.2% in May. The model-based Persistent and Common Component of Inflation (PCCI) measure, which is expressed in terms of an annualised rate, declined further in June (regardless of whether energy is included). Overall, recent developments in these measures suggest a turning point in underlying inflationary pressures. Nonetheless, the range of monitored underlying inflation measures remains wide and at an elevated level, reflecting still high uncertainty and highlighting the need to monitor a broad set of data (see Box 5).
Chart 12
Indicators of underlying inflation
(annual percentage changes)

Sources: Eurostat and ECB calculations.
Notes: The range of indicators of underlying inflation includes HICP excluding energy, HICP excluding energy and unprocessed food, HICPX, HICPXX, 10% and 30% trimmed means, PCCI and a weighted median. The grey dashed line represents the ECB’s inflation target of 2% over the medium term. The latest observations are for June 2023.
Inflation for non-energy industrial goods fell further, to 5.5% in June from 5.8% in May. Pipeline pressure indicators point to an ongoing process of moderation. Looking at the early stages of the pricing chain, producer price inflation for intermediate goods and import price inflation for intermediate goods both declined further in May. At the later stages, producer price inflation for non-food consumer goods edged down to stand at 6.4% in May, falling from 7.2% in April – the fifth consecutive month with a decline in annual terms, confirming the gradual easing of accumulated pipeline pressures for consumer goods. At the same time, while annual growth rates for import and producer prices of non-food consumer goods are easing, they remain at elevated levels, although for import prices the recent appreciation of the exchange rate should help (Chart 13).
Chart 13
Indicators of pipeline pressures
(annual percentage changes)

Sources: Eurostat and ECB calculations.
Note: The latest observations are for May 2023.
Wage growth has been picking up and is becoming an increasingly significant source of inflationary pressure. The annual growth in negotiated wages stood at 4.3% in the first quarter of 2023, up from 3.9% in the fourth quarter of 2022. Forward-looking information from recently concluded wage negotiations suggests that nominal wage pressures will remain strong beyond the first quarter of 2023. Actual wage growth, which is measured in terms of compensation per employee and compensation per hour, continued to increase. The annual growth rates of these two wage measures were revised upward compared with the first release, standing at 5.4% and 4.9% respectively in the first quarter of 2023, up from 4.8% and 4.1% in the fourth quarter of 2022. While unit profit growth remained relatively high in the first quarter of 2023, it eased in individual industrial sectors, notably in the more contact-intensive services.
Most survey-based indicators of longer-term inflation expectations in the euro area remain more or less unchanged at around 2%, broadly in line with market‑based measures of inflation compensation adjusted for risk premia (Chart 14). In the ECB Survey of Professional Forecasters (SPF) for the third quarter of 2023, average longer-term inflation expectations (now for 2028) and the median outcome remained unchanged at 2.1% and 2.0% respectively. In the July 2023 Consensus Economics survey, inflation expectations for 2028 also remained unchanged from April’s 2.1%. In the July 2023 ECB Survey of Monetary Analysts (SMA), median longer-term expectations remained unchanged at 2.0%. In the ECB Consumer Expectations Survey for June 2023, median expectations three years ahead declined to 2.3%, down from 2.5% in May, continuing on their downward trajectory from their October 2022 peak.[3] Overall, market-based measures of inflation compensation, which are based on HICP excluding tobacco, increased across maturities, notably at the short end. Indeed, the one-year forward inflation-linked swap rate one year ahead increased by 14 basis points and stood at around 2.5% at the end of the review period. At the longer end, the five-year forward inflation-linked swap rate five years ahead ended the review period slightly higher, standing at almost 2.6%. However, it should be noted that market‑based measures of inflation compensation are not a direct gauge of market participants’ genuine inflation expectations, given that these measures include inflation risk premia, which compensate for inflation risks. Overall, when cleansed for risk premia, market pricing continues to indicate a more optimistic inflation scenario over the next two years than the one suggested by the June 2023 Eurosystem staff macroeconomic projections for the euro area.
Chart 14
Survey-based indicators of inflation expectations and market-based measures of inflation compensation
(annual percentage changes)

Sources: Eurostat, Refinitiv, Consensus Economics survey, SPF, June 2023 Eurosystem staff macroeconomic projections for the euro area, SMA, and ECB calculations.
Notes: The market-based measures of the inflation compensation series are based on the one-year spot inflation rate, the one-year forward rate one year ahead, the one-year forward rate two years ahead and the one-year forward rate three years ahead. The observations for market-based measures of inflation compensation are for 20 July 2023. The SPF for the third quarter of 2023 was conducted between 30 June and 5 July 2023. The SMA shows quarterly forecasts. The cut-off for the Consensus Economics survey long-term forecasts was July 2023. The cut-off date for data included in the Eurosystem staff macroeconomic projections was 31 May 2023. The latest observation for HICP is for June 2023.
There are upside and downside risks to the inflation outlook. Upside risks to inflation include potential renewed upward pressures on the costs of energy and food owing to Russia’s unilateral withdrawal from the Black Sea Grain Initiative and its military attacks on Ukrainian grain terminals and ports; adverse weather conditions, which could push up food prices more than projected; and a lasting rise in inflation expectations above our target or higher than anticipated increases in wages or profit margins, both of which could drive inflation up over the medium term. By contrast, weaker demand – for example owing to a stronger transmission of monetary policy – would lead to lower price pressures, especially over the medium term. Moreover, if declining energy prices and lower food price increases were to pass through to the prices of other goods and services quicker than currently anticipated, inflation would come down faster.
4 Financial market developments
During the review period (15 June to 26 July 2023), financial market developments were driven largely by revisions to the inflation outlook and the expected implications for monetary policy. Following the June meeting of the Governing Council, market expectations for euro area near-term policy rates rose on the back of central bank communication on both sides of the Atlantic indicative of a tighter monetary policy stance. Since mid-July, however, these have returned to levels only slightly higher than those prevailing in mid-June amid lower-than-expected US inflation and the associated reappraisal of monetary policy. Sovereign bond yields in the euro area moved broadly in line with risk-free rates, without a visible impact from the ending of reinvestments under the ECB’s asset purchase programme (APP) at the end of June. Overall, valuations of euro area risk assets remained broadly unchanged amid some intra-period volatility driven by market sensitivity to monetary policy communication and macroeconomic news. Euro area corporate bond spreads moved sideways. Despite some intra-period volatility, equity prices remained broadly unchanged against the backdrop of an evolving market reappraisal of monetary policy and the macroeconomic outlook. In foreign exchange markets, the euro appreciated against the US dollar and in trade-weighted terms.
Euro area near-term risk-free rates ended the review period broadly in line with levels seen before the June Governing Council meeting, after some intra-period moves. The euro short-term rate (€STR) averaged 337 basis points over the review period and closely followed the changes in the deposit facility rate. Excess liquidity decreased by approximately €526 billion to stand at €3,618 billion, mainly reflecting repayments of the third series of targeted longer-term refinancing operations (TLTRO III). The overnight index swap (OIS) forward curve, which is based on the benchmark €STR, rose for short and medium-term maturities after the Governing Council’s monetary policy decision in June to raise the deposit facility rate by 25 basis points. This reflects market participants’ expectations that policy rates will remain at higher levels for longer than previously expected. Near-term interest rates have retreated significantly since mid-July and returned to around their mid-June levels. As of the end of the review period, the OIS forward curve priced in an additional rate hike of 25 basis points for the July Governing Council meeting and a peak rate of around 3.9% for December 2023. The expectation for the terminal rate implied by the latest forward curve increased slightly compared with the OIS forward curve prevailing before the Governing Council meeting in June, while a first interest rate cut was seen as postponed to the second quarter of 2024.
Long-term sovereign bond yields moved broadly in line with risk-free rates amid stable sovereign spreads (Chart 15). On 26 July the euro area GDP-weighted average ten-year sovereign bond yield stood at around 3.1%, just a few points below its level at the beginning of the review period, and overall below the level seen prior to the turmoil in the banking sector earlier this year. Ten-year sovereign bond yields in the euro area moved broadly in line with long-term risk-free rates with no impact apparent from the ending of APP reinvestments in July. Outside the euro area, the ten-year US sovereign bond yield edged up slightly to stand at 3.9%, while the UK sovereign bond yield decreased by 10 basis points to 4.3%.
Chart 15
Ten-year sovereign bond yields and the ten-year OIS rate based on the €STR
(percentages per annum)

Sources: Refinitiv and ECB calculations.
Notes: The vertical grey line denotes the start of the review period on 15 June 2023. The latest observations are for 26 July 2023.
Movements in corporate bond spreads were limited, with some diverging pattern between the high-yield and investment-grade segments. Spreads on investment-grade corporate bonds narrowed by 7 basis points and those on financial corporate bonds declined the most, by 12 basis points, ending the review period slightly lower than prior to the turmoil in the banking sector seen earlier this year.[4] The volatile reappraisal of monetary policy and the macroeconomic outlook left its footprint on high-yield corporate bond spreads, which widened by 25 basis points over the review period.
Despite some intra-period volatility, euro area equity prices remained broadly unchanged against the backdrop of an evolving market reappraisal of monetary policy and the macroeconomic outlook. Declines in euro area stock prices were broad-based, both across countries and sectors, in the first half of the review period, but tended to go into reverse over the final two weeks. All in all, composite euro area equity prices edged up a slight 0.2% at the end of the review period on the back of higher earnings expectations, while forward-looking measures of equity price volatility decreased from a temporary spike recorded in the first week of July. Overall, the equity prices of non-financial corporations (NFCs) decreased by around 0.9%, while euro area banks saw their equity prices rise by around 7.4%, rebounding from the turmoil seen in the banking sector in March. Despite the recent gains, bank equity prices are still below their pre-turmoil levels. In the United States, NFC equity prices gained around 2.9% over the review period, while bank equity prices increased by around 8.6%, slightly faster than their European peers, though ending up still below pre-March levels.
In foreign exchange markets, the euro continued to appreciate, both against the US dollar and in trade-weighted terms (Chart 16). The euro appreciated by 2.2% against the US dollar amid improving risk sentiment. The nominal effective exchange rate of the euro – as measured against the currencies of 41 of the euro area’s most important trading partners – also appreciated, by 1.6%, during the review period. This occurred amid a broad-based appreciation against other major currencies, including the Japanese yen (by 1.6%) and the Chinese renminbi (by 2.1%), as well as against the currencies of other major emerging economies, notably including the Turkish lira (16%). By contrast, the euro depreciated against the currencies of some non-euro area EU countries.
Chart 16
Changes in the exchange rate of the euro vis-à-vis selected currencies
(percentage changes)

Source: ECB.
Notes: EER-41 is the nominal effective exchange rate of the euro against the currencies of 41 of the euro area’s most important trading partners. A positive (negative) change corresponds to an appreciation (depreciation) of the euro. All changes have been calculated using the foreign exchange rates prevailing on 26 July 2023.
5 Financing conditions and credit developments
The ECB’s monetary policy tightening continued to be transmitted strongly to broader financing conditions. Banks’ funding costs continued to rise, reflecting further increases in deposit rates and the ongoing phasing-out of the targeted longer-term refinancing operations (TLTROs). Their repayments of funds borrowed under the third series of such operations (TLTRO III) – around €500 billion in June – went smoothly, as banks were well prepared. These repayments also contributed to a reduction in excess liquidity. In May 2023 bank lending rates increased further, reaching their highest levels since 2008 for firms and 2012 for households. Over the period from 15 June to 26 July 2023, the cost of equity financing of non-financial corporations (NFCs) remained virtually unchanged, while the cost of market-based debt financing declined marginally. The most recent euro area bank lending survey indicates that banks tightened their credit standards further for all loan categories and that loan demand from firms and households once again fell strongly in the second quarter of 2023, pointing to an ongoing weakening of loan dynamics. Bank lending to firms and households continued to moderate in June 2023 amid higher lending rates, weaker loan demand on the back of cuts in spending plans and tighter credit standards. In the same month, monetary dynamics weakened further, driven by their most liquid components, subdued credit growth and the reduction of the Eurosystem balance sheet.
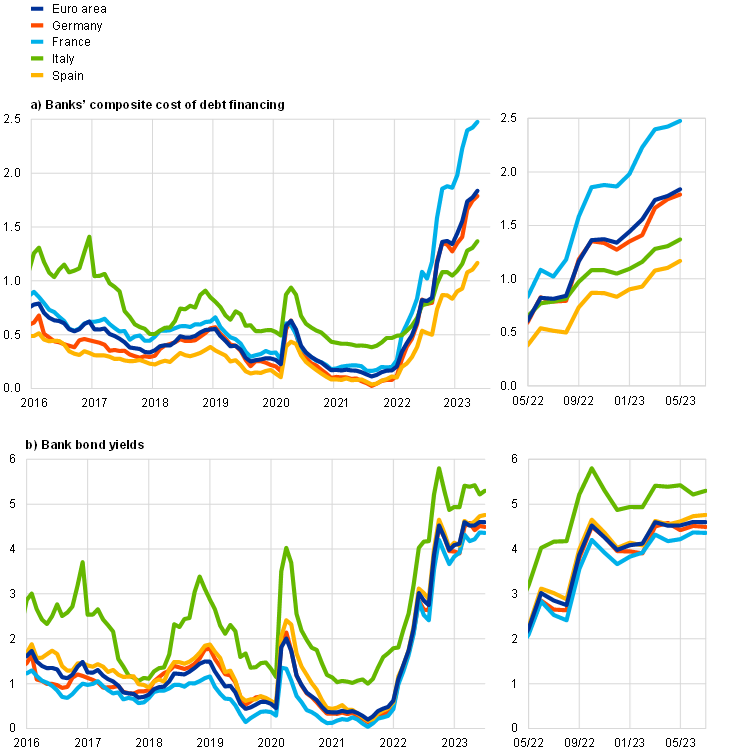
Euro area bank funding costs continued to rise, reflecting further increases in deposit rates. The composite cost of debt financing for euro area banks rose further in May 2023, thus reaching its highest level in more than ten years (Chart 17, panel a). This increase reflects higher deposit rates and stable bank bond yields (Chart 17, panel b). Deposit rates continued to rise steadily, with some variation across instruments. Depositors are reacting to the widening spread between time deposit rates and rates on overnight deposits by shifting their holdings from overnight to time deposits and to other instruments with higher remuneration. The pass-through of the increases in the key ECB interest rates to deposit rates has varied significantly across banks and has been accompanied by a redistribution of deposits between banks. Savers have moved deposits from banks with less attractive remuneration to banks that have raised deposit rates at a faster pace. Issuances of bank bonds that are remunerated above deposit rates and the key ECB interest rates have increased since September 2022, amid the winding-down of the TLTROs and the decline in overnight deposits.
Chart 17
Composite bank funding rates in selected euro area countries
(annual percentages)
Sources: ECB, S&P Dow Jones Indices LLC and/or its affiliates and ECB calculations.
Notes: Composite bank funding rates are a weighted average of the composite cost of deposits and unsecured market-based debt financing. The composite cost of deposits is calculated as an average of new business rates on overnight deposits, deposits with an agreed maturity and deposits redeemable at notice, weighted by their respective outstanding amounts. Bank bond yields are monthly averages for senior-tranche bonds. The latest observations are for May 2023 for composite bank funding rates and 26 July 2023 for bank bond yields.
Bank repayments of around €500 billion in funds borrowed under TLTRO III went smoothly, as banks were well prepared, with these repayments contributing to a reduction in excess liquidity and higher funding costs. In June 2023 banks repaid €506.3 billion of funds borrowed under TLTRO III, of which €29.5 billion were voluntary repayments and €476.8 billion were mandatory repayments, prompted by the maturing of the fourth TLTRO III operation. Following the settlement on 28 June, the overall amount of outstanding TLTRO III funds decreased to €592 billion, or 72% below the amount outstanding before the October 2022 recalibration of the remuneration of TLTRO III (€2.113 trillion).[5] Banks accommodated this large repayment by drawing on excess liquidity and by actively seeking to substitute funding in the market by issuing relatively large amounts of debt securities ahead of the repayment date. In addition to the increased issuance of debt securities, banks with outstanding TLTRO funds have competed more fiercely than other banks for deposits. Nevertheless, participation in main refinancing operations and three-month longer-term refinancing operations increased moderately, reflecting the fact that banks had had sufficient time to prepare their TLTRO repayments.
Bank lending rates for firms and households increased further, reaching their highest levels since December 2008 for firms and June 2012 for households. Higher ECB policy rates are being transmitted to bank lending conditions, with lending rates increasing and credit standards tightening strongly. The rise in lending rates is still higher for firms than for households across both countries and fixation periods (Chart 18). Bank rates on new loans to NFCs rose to 4.57% in May, their highest level since the end of 2008. This compares with 4.39% in April 2023 and 1.83% in June 2022, before the tightening cycle started. This increase was widespread across countries and fixation periods, with the largest rises being for loans with a fixation period of up to one year. Bank rates on new loans to households for house purchase also rose further in May, to stand at 3.58%, compared with 3.48% in April 2023 and 1.97% in June 2022. The increase in May was due to higher rates on fixed and flexible rate mortgages, amid some heterogeneity across countries. The results of the May 2023 Consumer Expectations Survey suggest that consumers expect mortgage rates to stabilise at around current levels over the next 12 months. However, a large net percentage of survey respondents perceived credit standards to be tight and expected it to become harder to obtain housing loans over the same period.
Chart 18
Composite bank lending rates for NFCs and households in selected countries
(annual percentages; standard deviation)
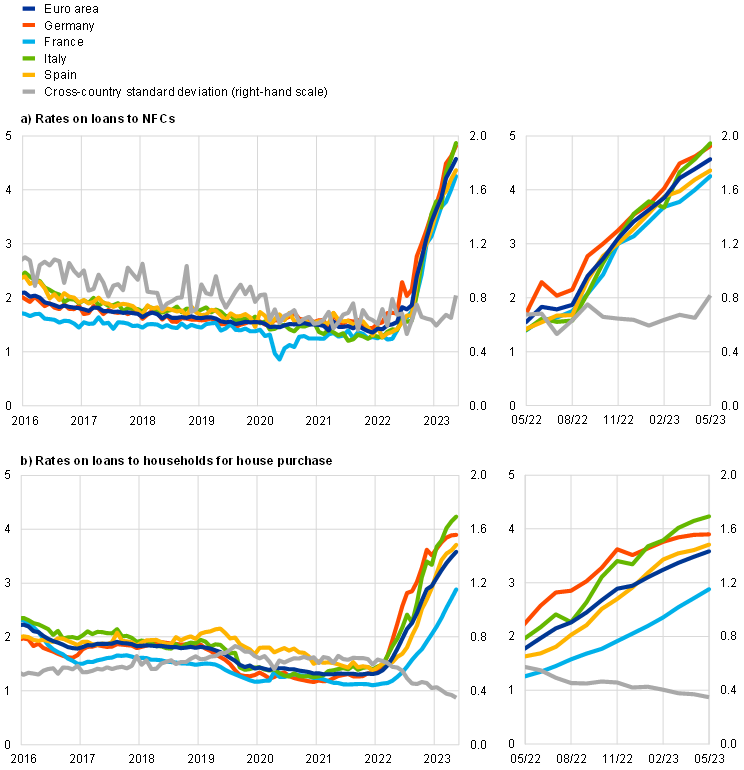
Source: ECB.
Notes: Composite bank lending rates are calculated by aggregating short and long-term rates using a 24-month moving average of new business volumes. The cross-country standard deviation is calculated using a fixed sample of 12 euro area countries. The latest observations are for April 2023.
Overall, lending rates have increased more quickly than in previous hiking cycles, mainly reflecting the faster pace of policy rate hikes. ECB policy rates have risen substantially over a short period of time, namely by a total of 425 basis points since July 2022, and at a slower pace since the Governing Council’s meeting on 4 May 2023. This is reflected in the first signs of moderation in the pace of lending rate increases in the second quarter of 2023 compared with the first quarter of 2023 and the fourth quarter of 2022. The cross-country dispersion of lending rates for firms increased somewhat from low levels, while the dispersion of lending rates for households remained at low levels in May 2023 (Chart 18). In a historical context, the spread between bank rates on small and large loans for euro area firms remained stable at low levels in May, although it varied to some extent from country to country.
From 15 June to 26 July 2023 the cost of equity financing for NFCs remained virtually unchanged, while the cost of market-based debt declined marginally. In May 2023 the overall cost of financing for NFCs – i.e. the composite cost of bank borrowing, market-based debt and equity – stood at 6.1%, around 10 basis points above its level in the previous month (Chart 19).[6] This was the result of a broad-based increase in the cost of all components of NFC financing in May, driven mainly by the cost of both short-term and long-term borrowing from banks. Notwithstanding the latest increase, the overall cost of financing in May remained close to the elevated levels reached in September 2022 and previously seen at the end of 2011. Over the review period the cost of market-based debt fell slightly, while the cost of equity remained virtually unchanged. The slight decline in the cost of market-based debt was due primarily to the compression of spreads on bonds issued by non-financial firms in the investment-grade segment not being fully compensated by a minor increase in the risk-free rate (approximated by the ten-year overnight index swap rate) and some widening of spreads on bonds issued by non-financial firms in the high-yield segment. The stability in the cost of equity over the review period reflected an equilibrium between the small increase in risk-free rates and the equally small decline in the equity risk premium.
Chart 19
Nominal cost of external financing for euro area NFCs, broken down by component

Sources: ECB and ECB estimates, Eurostat, Dealogic, Merrill Lynch, Bloomberg and Thomson Reuters.
Notes: The overall cost of financing for NFCs is calculated as a weighted average of the cost of borrowing from banks, market-based debt and equity, based on their respective outstanding amounts. The latest observations are for 26 July 2023 for the cost of market-based debt (monthly average of daily data), 21 July 2023 for the cost of equity (weekly data) and May 2023 for the overall cost of financing and the cost of borrowing from banks (monthly data).
According to the July 2023 euro area bank lending survey, credit standards for loans to firms tightened further in the second quarter of 2023, although the net percentage of banks reporting a tightening was smaller than in the previous quarter (Chart 20). The tightening of credit standards was in line with banks’ expectations in the previous quarter, remaining above the historical average since the start of the survey in 2003. The cumulated net tightening since the beginning of 2022 has been substantial, and the survey results have provided early indications about the significant weakening in lending dynamics observed since last autumn. Against the background of the typical lags in the impact of monetary policy transmission on the economy, risks related to the economic outlook and firm-specific situations remained the main drivers of the tightening of credit standards for loans to firms. Banks’ lower risk tolerance, the higher cost of funds and the worsening of the balance sheet situation also contributed to the tightening, reflecting higher credit risks in the context of rising interest rates and weak economic growth. Banks also reported that credit standards for new loans to firms had tightened further across all main sectors of the economy in the first half of 2023, especially for commercial real estate. Euro area banks expect credit standards for loans to firms to tighten further in the third quarter of 2023.
Banks reported a further net tightening of credit standards for loans to households in the second quarter of 2023. Compared with the previous quarter, the net tightening was less pronounced for housing loans and more pronounced for consumer credit. For housing loans, it was broadly in line with banks’ expectations in the previous quarter, while for consumer credit, it was substantially higher than expected. Higher risk perceptions related to the economic outlook and borrower-specific situations, lower risk tolerance, as well as the higher cost of funds, contributed to the tightening. For the third quarter of 2023 euro area banks expect credit standards for loans to households for house purchase to remain unchanged, while a further net tightening is expected for consumer credit and other loans to households, although to a lesser extent than in the second quarter.
Chart 20
Changes in credit standards and net demand for loans to NFCs and loans to households for house purchase
(net percentages of banks reporting a tightening of credit standards or an increase in loan demand)

Source: Euro area bank lending survey.
Notes: For survey questions on credit standards, “net percentages” are defined as the difference between the sum of the percentages of banks responding “tightened considerably” and “tightened somewhat” and the sum of the percentages of banks responding “eased somewhat” and “eased considerably”. For survey questions on demand for loans, “net percentages” are defined as the difference between the sum of the percentages of banks responding “increased considerably” and “increased somewhat” and the sum of the percentages of banks responding “decreased somewhat” and “decreased considerably”. The diamonds denote expectations reported by banks in the current round. The latest observations are for the second quarter of 2023.
Banks reported a strong decrease in loan demand from firms and households in the second quarter of 2023. The decline in loan demand from firms was the strongest observed since the start of the survey in 2003, while that in loan demand from households was smaller than the very large decrease in the previous two quarters. Banks reported that the general level of interest rates was the main driver of the reduced loan demand from firms, reflecting the dampening impact of rising interest rates on loan demand and economic growth. A decline in financing needs for fixed investment also had a strong dampening impact on loan demand, mirrored by a sharp decrease in demand for long-term loans. The drop in demand for housing loans was driven mainly by higher interest rates, weakening housing market prospects and low consumer confidence. For the third quarter of 2023 banks expect a further (net) decrease in loan demand from firms and in housing loan demand, albeit a much smaller one than in the second quarter.
According to the banks surveyed, access to funding deteriorated in most market segments, especially in retail funding, and increased concerns about non-performing loans (NPLs) also contributed to the tightening of bank lending conditions. The reported net deterioration in access to retail funding may reflect increased competition for retail deposits in the current environment of higher interest rates and outflows of overnight deposits. For the first half of 2023 banks reported a net tightening impact of NPL ratios on their credit standards for loans to enterprises and for consumer credit, and a broadly neutral impact on housing loans. As in the past, the main factors behind the contribution of NPL ratios to tightening lending conditions were banks’ higher risk perceptions and lower risk tolerance.
The July 2023 survey questionnaire included a new annual ad hoc question aimed at gauging the impact of climate change on banks’ lending to enterprises. Euro area banks indicated that firms’ climate-related risks and their measures for dealing with climate change had had a net tightening impact on credit standards and terms and conditions for loans to brown firms (i.e. firms that contribute significantly to climate change and have not yet started the transition or have made little progress) over the past 12 months.[7] However, they had had a net easing impact on loans to green firms (i.e. firms that do not contribute or contribute little to climate change) and firms in transition (i.e. firms that contribute to climate change but are making considerable progress in the transition). Euro area banks also reported a net increase in demand for loans to firms owing to climate-related risks over the past 12 months, driven by firms in transition and green firms, while brown firms showed a net decrease in loan demand. The main drivers of loan demand related to climate risks were fixed investment and corporate restructuring, pointing to the investment needs of firms on the way to a more sustainable economy. Over the next 12 months, euro area banks expect a stronger net tightening impact owing to climate risks on credit standards for loans to brown firms, while a net easing impact is expected for green firms and firms in transition. In addition, euro area banks expect that the impact of climate risks on loan demand will become stronger in net terms.
Bank lending to firms and households continued to moderate in June amid higher lending rates, weaker loan demand and tighter credit standards. The annual growth rate of loans to NFCs declined to 3.0% in June, down from 4.0% in May (Chart 21, panel a). Monthly flows of loans to NFCs have been close to zero since November 2022. The slowdown was experienced across the largest euro area economies and reflects the strong decrease in loan demand, in part owing to higher borrowing rates and associated cuts in spending plans, as well as a further tightening of credit standards. The annual growth rate of loans to households declined from 2.1% in May to 1.7% in June (Chart 21, panel b) amid negative housing market prospects, a further tightening of banks’ credit standards and higher lending rates. The decline was driven by all components, namely housing loans, consumer credit and loans to sole proprietors (i.e. unincorporated small businesses).
Chart 21
MFI loans in selected euro area countries
(annual percentage changes; standard deviation)
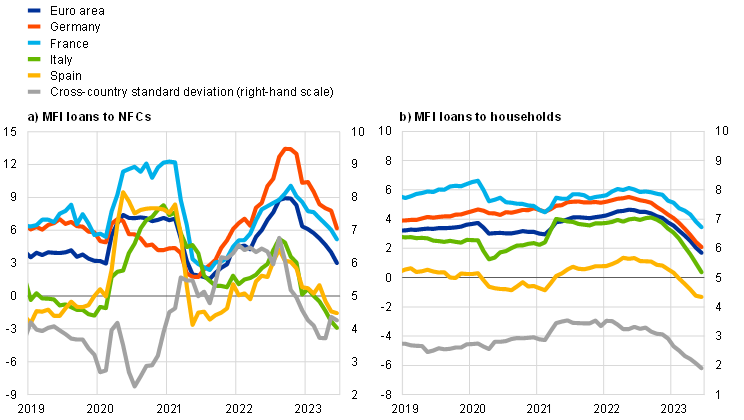
Source: ECB.
Notes: Loans from monetary financial institutions (MFIs) are adjusted for loan sales and securitisation; in the case of NFCs, loans are also adjusted for notional cash pooling. The cross-country standard deviation is calculated using a fixed sample of 12 euro area countries. The latest observations are for June 2023.
Overnight deposits contracted further in June, driven by the reallocation of funds to instruments with higher remuneration. After dropping by 8.1% year on year in May, the growth rate of overnight deposits fell further in June, bringing their annual growth rate to -9.2%, the strongest contraction since the start of Economic and Monetary Union (EMU) in 1999 (Chart 22). This was due mainly to households and firms continuing to shift their overnight and redeemable deposits to time deposits. The incentive behind the portfolio reallocation was the large spread between time and overnight deposits, reflecting the slower adjustment of interest rates on overnight deposits to policy rate changes compared with rates on time deposits. The fact that the ECB’s policy tightening has been faster than in previous tightening cycles explains the extraordinary volumes being reallocated.
Chart 22
M3, M1 and overnight deposits
(annual growth rate, adjusted for seasonal and calendar effects)

Source: ECB.
Note: The latest observations are for June 2023.
Monetary dynamics continued to weaken in June 2023, driven by their most liquid components, subdued credit growth and the reduction of the Eurosystem balance sheet. Annual broad money (M3) growth declined further from 1.0% in May to 0.6% in June (Chart 22), the lowest rate since July 2010. Month-on-month changes in broad money turned positive in June for the first time since November 2022, owing to purchases of euro area government bonds by banks and foreign investors. Narrow money (M1) contracted further, by 8.0% in June after 7.0% in May – the largest reduction by far in the history of EMU. The slowdown observed since March 2023, alongside the discontinuation of reinvestments of principal payments from maturing securities under the asset purchase programme in July 2023, has led to a reduction of the Eurosystem’s asset portfolio, thus mechanically draining liquidity from the financial system. Lastly, TLTRO repayments are also contributing to the weakening monetary dynamics by giving banks an incentive to issue bonds with longer maturities that are not included in M3.
Boxes
1 Why has housing lost its lure? Evidence from the ECB’s Consumer Expectations Survey
The deterioration in household perceptions of housing as a good investment preceded the recent decline in housing investment in the euro area.[8] In the ECB’s Consumer Expectations Survey (CES), households are regularly asked whether they think buying a property in their neighbourhood today is a good or bad investment.[9] The proportion of positive responses to this question then may be used as a proxy of housing demand, which is an important driver of housing investment.[10] Indeed, household perceptions of housing as a good investment were a relatively good leading indicator of the weakness in housing investment that began in the second quarter of 2022, with household perceptions falling from their peak in the second quarter of 2021 to a low point in the first quarter of 2023 (Chart A). Since the turn of the year, these perceptions have recovered somewhat but remain at a low level. This box analyses the factors determining household perceptions of the attractiveness of housing as an investment using CES data on household characteristics and expectations, thereby shedding light on the reasons for the recent slowdown in housing investment.
More2 Consumers’ interest rate expectations in a monetary policy tightening cycle
Consumer expectations can be of help in making timely assessments of the transmission of monetary policy to economic activity. Using data from the ECB’s Consumer Expectations Survey (CES), this box documents i) the extent to which consumer expectations about interest rates on mortgages and bank deposits have adjusted to the tighter policy stance; ii) how different groups of households perceive the tightening of monetary policy; and iii) to what extent these changes have affected households’ expectations about their future spending.[11] These are important elements in the ongoing assessment of the transmission of tighter monetary policy to household spending.
More3 Main findings from the ECB’s recent contacts with non-financial companies
This box summarises the findings of recent contacts between ECB staff and representatives of 73 leading non-financial companies operating in the euro area. The exchanges took place between 26 June and 5 July 2023.[12]
More4 Narrowing the climate data gap – climate change-related indicators
In January 2023 the ECB published a set of climate-related statistical indicators on its website for the first time, covering sustainable finance, carbon emissions and physical risks. These climate-related indicators, which are still under different stages of development, aim to shed light on climate change risks facing the financial sector in the euro area and to support policymakers and investors in developing effective strategies to address these challenges. Climate change also has potential implications for central banks regarding their price stability mandates, financial stability aims and, in many cases, prudential supervision of banks. This box gives a brief overview of the climate-related indicators, including the rationale behind them and their caveats.
More5 Underlying inflation measures: an analytical guide for the euro area
Developments in underlying inflation are a key input for the ECB’s monetary policy assessment. In making monetary policy decisions in an environment of elevated uncertainty, the ECB’s Governing Council has stressed the need to pay particularly close attention to the implications of the incoming data for the inflation outlook, developments in underlying inflation, and the strength of monetary policy transmission.[13] Underlying inflation measures should capture more persistent and generalised developments across prices, abstracting from volatile or idiosyncratic relative price movements, and thereby provide an informative signal about where headline inflation will settle in the medium term. Ideally, such measures should have a sound theoretical grounding, economic interpretability and be easy to communicate to the public.
More6 Changes in the investor base for euro area non-financial corporate bonds and implications for market pricing
The non-financial corporate bond market in the euro area has grown substantially over the past decade as issuance responded to strong private and public sector demand. This became particularly pronounced following the introduction of the ECB’s corporate sector purchase programme (CSPP) in 2016.[14] Owing to sustained positive net issuance, the amount of CSPP-eligible bonds outstanding doubled between 2016 and 2022 to a total of €1.5 trillion. Net of Eurosystem holdings, it grew by around 50% to reach €1.1 trillion in 2022.[15] Despite the substantial growth in this segment, there was no upward trend in swap spreads on eligible bonds over the period, suggesting that new issuances were met by strong demand (Chart A).[16] While demand for CSPP-eligible securities rose across all private sector investor groups, their holdings grew at markedly different rates, implying a change in relative holdings between 2016 and 2022. This heterogeneity sheds light on how private sector investors absorb increases in supply.[17]
More7 The role of housing wealth in the transmission of monetary policy
House price growth is slowing across advanced economies as monetary policy is tightened around the world and the rapid rises observed during the coronavirus (COVID-19) pandemic tail off. Over recent years, many advanced economies experienced a significant rise in real house prices that became even more marked during the pandemic. Statistical tests point to strong house price growth in many countries during the pandemic, with some seeing annual increases in excess of 10% (Chart A).[18] Several forces were at play. First, the low interest rate environment of the last decade gave rise to search-for-yield behaviour that pushed up house prices. Second, fiscal support boosting household net worth, especially during the main period of the pandemic, made it possible for house price growth to remain elevated. And third, stronger demand for certain types of housing stemming in part from a shift in living preferences – in connection with the new working from home requirements and reduced need for commuting, among other things – also contributed.[19] This pattern in house prices went into reverse in 2022 as monetary policy began tightening around the world, with some countries starting to see smaller increases or even decreases in real house prices (Chart A).[20]
More8 Inflation and the response of public wages in the euro area
In the context of elevated inflation in the euro area (despite recent declines), it is useful to look at the response of public wages to gauge further pressures on private sector wages and core inflation. While the public sector accounts for only about one-fifth of the economy-wide compensation of employees in the euro area, it can provide a relevant signal for wage negotiations in the private sector. Public wage growth can thus have a bearing on inflation through both a direct channel (aggregate demand) and an indirect channel (as a signal for changes in private sector compensation). This box provides an update on previous analyses of public wage projections for the euro area, including as regards the institutional features that govern public wage-setting across euro area countries.[21] It is based on the June 2023 Eurosystem staff projections and is underpinned by a questionnaire completed by members of the Working Group on Public Finance (WGPF) of the European System of Central Banks.[22]
MoreArticle
1 The macroeconomic implications of the transition to a low-carbon economy
To help avert severe economic damage from climate change, the European Union (EU) has taken measures aimed at reducing greenhouse gas (GHG) emissions to net zero by 2050. The EU’s net-zero goal is set out in the European Green Deal, and comprehensive measures are outlined in the EU’s Fit for 55 package.[24] These aim to reduce GHG emissions by 55% by 2030 (compared to 1990 levels). The Fit for 55 package includes carbon price increases and regulatory measures and foresees massive green investments.
MoreStatistics
Statistical annex© European Central Bank, 2023
Postal address 60640 Frankfurt am Main, Germany
Telephone +49 69 1344 0
Website www.ecb.europa.eu
All rights reserved. Reproduction for educational and non-commercial purposes is permitted provided that the source is acknowledged.
This Bulletin was produced under the responsibility of the Executive Board of the ECB. Translations are prepared and published by the national central banks.
The cut-off date for the statistics included in this issue was 26 July 2023.
For specific terminology please refer to the ECB glossary (available in English only).
PDF ISSN 2363-3417, QB-BP-23-005-EN-N
HTML ISSN 2363-3417, QB-BP-23-005-EN-Q
See “Eurogroup statement on the euro area fiscal stance for 2024”.
According to the flash estimate released by Eurostat on 31 July, euro area real GDP increased by 0.3% in the second quarter of the year. This estimate was not available at the time of the July Governing Council meeting.
See “ECB Consumer Expectations Survey results – June 2023”, Press Release, ECB, Frankfurt am Main, 8 August 2023.
For an insight into the evolving determinants of bond pricing in the euro area corporate bond market, see the box entitled “Changes in the investor base for euro area non-financial corporate bonds and implications for market pricing” in this issue of the Economic Bulletin.
See “ECB recalibrates targeted lending operations to help restore price stability over the medium term”, press release, ECB, 27 October 2022.
Owing to lags in the data available on the cost of borrowing from banks, the overall cost of financing for NFCs as of 26 July 2023 can only be calculated up to May.
Firm-specific climate-related transition risks were the main drivers of the tightening impact on banks’ lending policies, whereas physical risk, often related to the geographical location of the borrower, had on average a somewhat smaller net tightening impact, and climate-related fiscal support helped to ease loan approval.
For a discussion of the weakness of housing investment in the euro area in 2022 and a comparison with the United States, see the box entitled “Monetary policy and housing investment in the euro area and the United States”, Economic Bulletin, Issue 3, ECB, 2023.
The study uses CES data from Belgium, Germany, Spain, France, Italy and the Netherlands.
The recovery in housing demand during the pandemic is discussed in the box entitled “The recovery of housing demand through the lens of the Consumer Expectations Survey”, Economic Bulletin, Issue 7, ECB, 2021.
The CES is a monthly survey with a rotating panel of approximately 14,000 respondents from the six largest euro area countries, i.e. Belgium, Germany, Spain, France, Italy and the Netherlands.
For further information on the nature and purpose of these contacts, see the article entitled “The ECB’s dialogue with non-financial companies”, Economic Bulletin, Issue 1, ECB, 2021.
See Lane, P. R., “Underlying inflation”, lecture at Trinity College Dublin, 6 March 2023 and Lagarde, C., “Monetary Policy Statement”, 4 May 2023. For an introduction to the analysis of underlying inflation at the ECB, see the article entitled “Measures of underlying inflation for the euro area”, Economic Bulletin, Issue 4, ECB, 2018. The importance of underlying inflation for monetary policy decision-making was highlighted in the ECB’s 2021 monetary policy strategy review.
For a description of the growth of the CSPP universe and eligibility, see, for example, the article entitled “The impact of the corporate sector purchase programme on corporate bond markets and the financing of euro area non-financial corporations”, Economic Bulletin, Issue 3, ECB, 2018.
The analysis confines itself to the CSPP-eligible universe, as this allows private sector demand to be disentangled from public sector demand. The CSPP universe includes bonds issued by non-bank financial institutions, but it is mostly composed of investment-grade bonds of non-financial corporations and therefore serves as a good proxy for the euro area non-financial corporate bond market.
While the average share of bonds in debt financing has increased over time, loans remain the dominant source of financing for euro area firms. One factor that has contributed to the decrease in the relative importance of loans in the capital structure is the reduction in the cost of financing via debt securities compared with bank loans, which can in part be attributed to the introduction of the CSPP. For more details on these developments, see, for example, Work stream on non-bank financial intermediation, “Non-bank financial intermediation in the euro area: implications for monetary policy transmission and key vulnerabilities”, Occasional Paper Series, No 270, ECB, September 2021.
For complementary analyses of the Eurosystem holdings of corporate bonds and their market implications, see Zaghini, A., “The CSPP at work: Yield heterogeneity and the portfolio rebalancing channel”, Journal of Corporate Finance, Vol. 56, June 2019, pp. 282-297; Todorov, K. “Quantify the quantitative easing: Impact on bonds and corporate debt issuance”, Journal of Financial Economics, Vol. 135, February 2020, pp. 340-358; Arce, Ó, Mayordomo, S. and Gimeno, R., “Making Room for the Needy: The Credit-Reallocation Effects of the ECB’s Corporate QE”, Review of Finance, Vol. 25, February 2021, pp. 43-84; and Zaghini, A. and De Santis, R.A., “Unconventional monetary policy and corporate bond issuance”, European Economic Review, Vol. 135, June 2021.
A modified unit root test following the approach in Pavlidis, E. et al., “Episodes of Exuberance in Housing Markets: In Search of the Smoking Gun”, The Journal of Real Estate Finance and Economics, Vol. 53, Issue 4, 2016, pp. 419-449, is one possible test of exuberance in real house price growth. Updated estimates are provided by the Federal Reserve Bank of Dallas.
Based on analysis published in the box entitled “Drivers of rising house prices and the risk of reversals”, Financial Stability Review, ECB, May 2022, using similar data and models.
For an overview of the global monetary policy stance, see the CFR Global Monetary Policy Tracker. For an analysis on how euro area households’ perceptions of housing as a good investment have dropped recently, driven mainly by expectations of higher mortgage interest rates, see the box entitled “Why has housing lost its lure? Evidence from the ECB’s Consumer Expectations Survey”, Economic Bulletin, Issue 5, ECB, 2023.
See, for instance, Checherita-Westphal, C. (ed.), “Public wage and pension indexation in the euro area: an overview”, Occasional Paper Series, No 299, ECB, August 2022. That paper also contains an analysis of the role of public wages in driving private wage dynamics. Based on a review of empirical literature, it concludes that panel studies focusing on euro area countries generally find evidence of a positive relationship between public and private wages, including bi-directional causation. The evidence at individual country level, in particular with regard to causality, is less clear-cut across various studies. Based on various samples of euro area countries, the paper finds a close positive relationship between public and private wages, with the causation going in both directions. Notably, panel regression results point to an increase in average private wage growth of between 0.3 and 0.5 percentage points for a 1 percentage point increase in public wage growth, while controlling for other determinants of private wages.
See the June 2023 Eurosystem staff projections for more details on developments in economy-wide compensation per employee and inflation.
Prepared in liaison with Alina Bobasu, Kai Christoffel, Alistair Dieppe, Michael Dobrew, Marien Ferdinandusse, Alessandro Ferrari, Thaïs Massei, Romanos Priftis, Angela Torres Noblejas and Aurelian Vlad.
For more information on the European Green Deal and the EU’s Fit for 55 package, see “A European Green Deal – Striving to be the first climate-neutral continent” and “Fit for 55” on the European Commission and European Council websites respectively.