
Economic Bulletin Issue 3, 2022
Summary
Russia’s aggression in Ukraine is causing enormous suffering. It is also affecting the economy, in Europe and beyond. The conflict and the associated uncertainty are weighing heavily on the confidence of businesses and consumers. Trade disruptions are leading to new shortages of materials and inputs. Surging energy and commodity prices are reducing demand and holding back production. How the economy develops will crucially depend on how the conflict evolves, on the impact of current sanctions and on possible further measures. At the same time, economic activity is still being supported by the reopening of the economy after the crisis phase of the pandemic. Inflation has increased significantly and will remain high over the coming months, mainly because of the sharp rise in energy costs. Inflation pressures have intensified across many sectors.
At its meeting on 14 April 2022, the Governing Council judged that the incoming data since the meeting in March had reinforced its expectation that net asset purchases under the asset purchase programme (APP) should be concluded in the third quarter. Looking ahead, the ECB’s monetary policy will depend on the incoming data and the evolving assessment of the outlook. In the current conditions of high uncertainty, the Governing Council will maintain optionality, gradualism and flexibility in the conduct of monetary policy. It will take whatever action is needed to fulfil the ECB’s mandate to pursue price stability and to contribute to safeguarding financial stability.
Economic activity
Global economic activity remained resilient at the start of 2022, with survey data indicating that the Omicron variant of the coronavirus (COVID-19) may only have a short-lived impact on advanced economies. However, the Russia-Ukraine war and new pandemic-related measures in Asia are expected to weigh on the global economy and are leading to fresh shortages of materials and inputs. The geopolitical situation and the pandemic are also acting as a drag on trade. At the same time, the delayed easing of supply chain disruptions and the economic impact of the war are likely to intensify global inflationary pressures. The impact on inflation is expected to be more significant in emerging market economies (EMEs) than in advanced economies, given the higher weight of commodities in the consumption baskets of EMEs.
The euro area economy grew by 0.3% in the final quarter of 2021. It is estimated that growth remained weak during the first quarter of 2022, largely owing to pandemic-related restrictions.
Several factors point to slow growth also in the period ahead. The war is already weighing on the confidence of businesses and consumers, including through the uncertainty it brings. With energy and commodity prices rising sharply, households are facing a higher cost of living and firms are confronted with higher production costs. The war has created new bottlenecks, while a new set of pandemic measures in Asia is contributing to supply chain difficulties. Some sectors face growing difficulties in sourcing their inputs, which is disrupting production. However, there are also offsetting factors underpinning the ongoing recovery, such as compensatory fiscal measures and the possibility for households to draw on savings they accumulated during the pandemic. Moreover, the reopening of those sectors most affected by the pandemic and a strong labour market with more people in jobs will continue to support incomes and spending.
Fiscal and monetary policy support remains critical, especially in this difficult geopolitical situation. In addition, the successful implementation of the investment and reform plans under the Next Generation EU programme will accelerate the energy and green transitions. This should help enhance long-term growth and resilience in the euro area.
Inflation
Inflation increased to 7.5% in March, from 5.9% in February. Energy prices were driven higher after the outbreak of the war and now stand 45% above their level one year ago. They continue to be the main reason for the high rate of inflation. Market-based indicators suggest that energy prices will stay high in the near term but will then moderate to some extent. Food prices have also increased sharply. This is due to elevated transportation and production costs, notably the higher price of fertilisers, which are in part related to the war in Ukraine.
Price rises have become more widespread. Energy costs are pushing up prices across many sectors. Supply bottlenecks and the normalisation of demand as the economy reopens also continue to put upward pressure on prices. Measures of underlying inflation have risen to levels above 2% in recent months. It is uncertain how persistent the rise in these indicators will be, given the role of temporary pandemic-related factors and the indirect effects of higher energy prices.
The labour market continues to improve, with unemployment having fallen to a historical low of 6.8% in February. Job postings across many sectors still signal robust demand for labour, yet wage growth remains muted overall. Over time the return of the economy to full capacity should support faster growth in wages. While various measures of longer-term inflation expectations derived from financial markets and from expert surveys largely stand at around 2%, initial signs of above-target revisions in those measures warrant close monitoring.
Risk assessment
The downside risks to the growth outlook have increased substantially as a result of the war in Ukraine. While risks relating to the pandemic have declined, the war may have an even stronger effect on economic sentiment and could further worsen supply-side constraints. Persistently high energy costs, together with a loss of confidence, could drag down demand and restrain consumption and investment more than expected.
The upside risks surrounding the inflation outlook have also intensified, especially in the near term. The risks to the medium-term inflation outlook include above-target moves in inflation expectations, higher than anticipated wage rises and a durable worsening of supply-side conditions. However, if demand were to weaken over the medium term, it would lower pressure on prices.
Financial and monetary conditions
Financial markets have been highly volatile since the war began and financial sanctions were imposed. Market interest rates have increased in response to the changing outlook for monetary policy, the macroeconomic environment and inflation dynamics. Bank funding costs have continued to increase. At the same time, so far there have been no severe strains in money markets, nor liquidity shortages in the euro area banking system.
Although remaining at low levels, bank lending rates for firms and households have started to reflect the increase in market interest rates. Lending to households is holding up, especially for house purchases. Lending flows to firms have stabilised.
The most recent euro area bank lending survey reports that credit standards for loans to firms and for housing loans tightened overall in the first quarter of the year, as lenders are becoming more concerned about the risks facing their customers in an uncertain environment. Credit standards are expected to tighten further in the coming months, as banks factor in the adverse economic impact of Russia’s aggression towards Ukraine and higher energy prices.
Conclusion
Summing up, the war in Ukraine is severely affecting the euro area economy and has significantly increased uncertainty. The impact of the war on the economy will depend on how the conflict evolves, on the effect of current sanctions and on possible further measures. Inflation has increased significantly and will remain high over the coming months, mainly because of the sharp rise in energy costs. The Governing Council is very attentive to the current uncertainties and is closely monitoring the incoming data in relation to their implications for the medium-term inflation outlook. The calibration of the ECB’s policies will remain data-dependent and reflect the Governing Council’s evolving assessment of the outlook. The Governing Council stands ready to adjust all of its instruments within its mandate, incorporating flexibility if warranted, to ensure that inflation stabilises at the 2% target over the medium term.
Monetary policy decisions
At the monetary policy meeting on 14 April 2022, the Governing Council confirmed that monthly net purchases under the APP would amount to €40 billion in April, €30 billion in May and €20 billion in June. The Governing Council judged that the incoming data since its last meeting reinforced its expectation that net asset purchases under the APP should be concluded in the third quarter. The calibration of net purchases for the third quarter will be data-dependent and reflect the Governing Council’s evolving assessment of the outlook.
The Governing Council also intends to continue reinvesting, in full, the principal payments from maturing securities purchased under the APP for an extended period of time past the date when it starts raising the key ECB interest rates and, in any case, for as long as necessary to maintain favourable liquidity conditions and an ample degree of monetary accommodation.
The interest rate on the main refinancing operations and the interest rates on the marginal lending facility and the deposit facility remain unchanged at 0.00%, 0.25% and -0.50% respectively.
Any adjustments to the key ECB interest rates will take place some time after the end of the Governing Council’s net purchases under the APP and will be gradual. The path for the key ECB interest rates will continue to be determined by the Governing Council’s forward guidance and by its strategic commitment to stabilise inflation at 2% over the medium term. Accordingly, the Governing Council expects the key ECB interest rates to remain at their present levels until it sees inflation reaching 2% well ahead of the end of its projection horizon and durably for the rest of the projection horizon, and it judges that realised progress in underlying inflation is sufficiently advanced to be consistent with inflation stabilising at 2% over the medium term.
The Governing Council intends to reinvest the principal payments from maturing securities purchased under the pandemic emergency purchase programme (PEPP) until at least the end of 2024. In any case, the future roll-off of the PEPP portfolio will be managed to avoid interference with the appropriate monetary policy stance.
In the event of renewed market fragmentation related to the pandemic, PEPP reinvestments can be adjusted flexibly across time, asset classes and jurisdictions at any time. This could include purchasing bonds issued by the Hellenic Republic over and above rollovers of redemptions in order to avoid an interruption of purchases in that jurisdiction, which could impair the transmission of monetary policy to the Greek economy while it is still recovering from the fallout from the pandemic. Net purchases under the PEPP could also be resumed, if necessary, to counter negative shocks related to the pandemic.
The Governing Council will continue to monitor bank funding conditions and ensure that the maturing of operations under the third series of targeted longer-term refinancing operations (TLTRO III) does not hamper the smooth transmission of its monetary policy. The Governing Council will also regularly assess how targeted lending operations are contributing to its monetary policy stance. As announced, it expects the special conditions applicable under TLTRO III to end in June this year. The Governing Council will also assess the appropriate calibration of its two-tier system for reserve remuneration so that the negative interest rate policy does not limit banks’ intermediation capacity in an environment of ample excess liquidity.
The Governing Council stands ready to adjust all of its instruments within its mandate, incorporating flexibility if warranted, to ensure that inflation stabilises at its 2% target over the medium term. The pandemic has shown that, under stressed conditions, flexibility in the design and conduct of asset purchases has helped to counter the impaired transmission of monetary policy and made the Governing Council’s efforts to achieve its goal more effective. Within the Governing Council’s mandate, under stressed conditions, flexibility will remain an element of monetary policy whenever threats to monetary policy transmission jeopardise the attainment of price stability.
1 External environment
Global economic activity remained resilient at the start of 2022, with survey data indicating that the Omicron variant of the coronavirus (COVID-19) may only have a short-lived impact on advanced economies. However, the Russia-Ukraine war and new pandemic-related measures in Asia are expected to weigh on the global economy and are leading to fresh shortages of materials and inputs. The geopolitical situation and the pandemic are also acting as a drag on trade. At the same time, the delayed easing of supply chain disruptions and the economic impact of the war are likely to intensify global inflationary pressures. The impact on inflation is expected to be more significant in emerging market economies (EMEs) than in advanced economies, given the higher weight of commodities in the consumption baskets of EMEs.
The Russia-Ukraine war and new pandemic-related measures in Asia are expected to weigh on activity in the short term. Prior to Russia’s invasion of Ukraine, survey indicators were pointing to moderate growth at the start of 2022. The global composite output Purchasing Managers’ Index (PMI) rebounded in February following a sharp drop in January, suggesting that the impact of the Omicron wave in advanced economies would be short-lived. However, the composite PMI declined in March, although remaining expansionary, driven by a marked fall in Russia and, to a lesser extent, in China. The ongoing war in Ukraine and the associated sanctions imposed on Russia are expected to weigh on the global economy in the form of higher commodity prices and falling confidence, as evidenced by the deteriorating consumer confidence indices for key economies. In turn, this is likely to curtail consumption and investment, particularly in the second quarter. Notwithstanding these headwinds and the elevated uncertainty surrounding the global outlook, activity is expected to remain on an expansionary, albeit more moderate, path in 2022.
Recent global developments are causing new shortages of materials and inputs. The recent easing of supply chain bottlenecks has continued, with PMI suppliers’ delivery times for March surprising on the upside in the United Kingdom and the United States (Chart 1). This might reflect a continuation of the rebound following the Omicron-driven slowdown at the turn of the year. However, other higher-frequency data, including vessel movements and shipping prices, suggest that the recent easing of supply chain disruptions is being hindered due to the adverse impact on production and transport of the Russia-Ukraine war and the resurgence of COVID-19 cases and the renewed pandemic-related measures in Asia.
Chart 1
PMI suppliers’ delivery times
(diffusion indices)

Sources: Markit and ECB staff calculations.
Note: The latest observations are for March 2022.
The geopolitical situation and pandemic are also acting as a drag on trade. High-frequency indicators point to a moderation in global trade in March. This includes significant declines in the number of commercial ships calling at Russian and Ukrainian ports relative to the 2021 average owing to the war and the associated sanctions imposed on Russia. Many private firms withdrew from or cut ties with Russia following the initial imposition of sanctions. It is likely that such boycotts are already weighing on trade. Meanwhile, the resurgence of COVID-19 in Asia, combined with the Lunar New Year holidays and recent lockdowns in China, have contributed to the subdued shipping volumes from that country. Vessel movements in February also declined in other regions, including North America. Looking ahead trade flows may weaken further in the second and third quarters of the year as the sanctions on Russia continue to dent commercial activity.
Renewed strains on supply chains and the economic impact of the war pose upside risks to global inflation. Annual consumer price index (CPI) inflation in the member countries of the Organisation for Economic Co-operation and Development (OECD) increased to 7.7% in February, while inflation excluding food and energy rose to 5.5%. The contribution of food and energy accounted for around one-third of the total increase, while the remaining two-thirds came from core inflation. Looking ahead OECD inflation could be pushed even higher given the rise in commodity prices since January. EMEs, such as India, Mexico and Turkey, may experience even more pronounced increases in headline figures, given the greater weight of commodities in these countries’ consumption baskets (Chart 2). Advanced economies, such as Canada, the United Kingdom and the United States, appear less vulnerable.
Chart 2
Consumer price inflation and food and energy weights in the consumption basket
(annual percentage changes, February 2022; percentage weight in CPI/HICP indices)
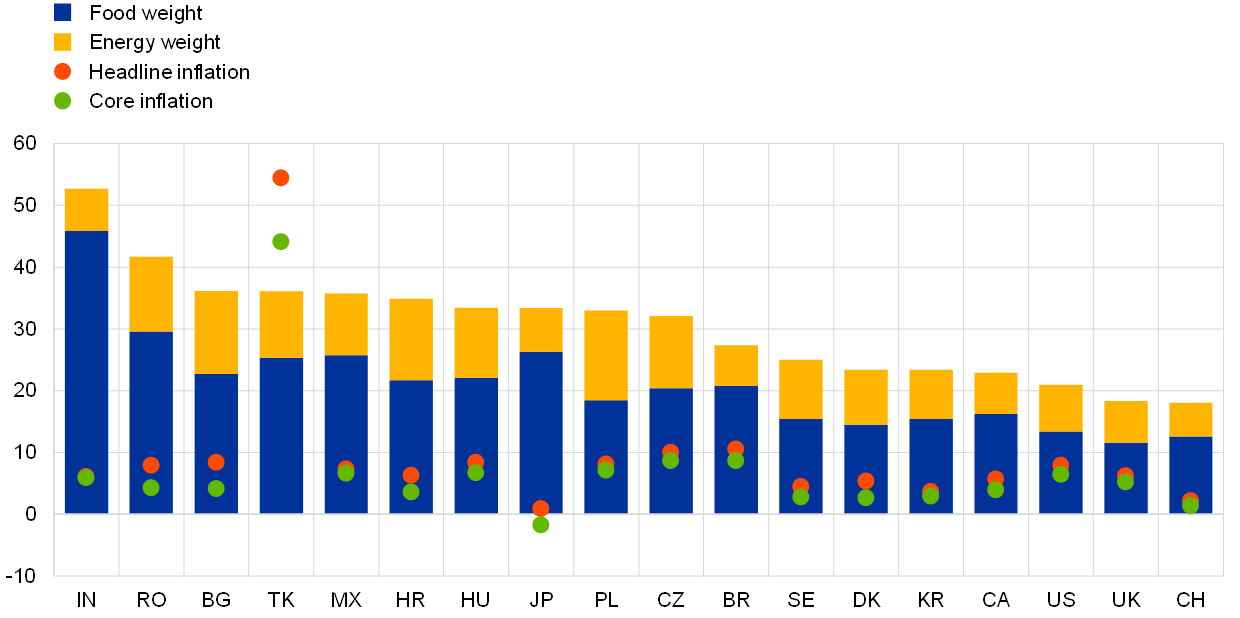
Sources: National statistical offices via Haver Analytics and ECB staff calculations.
Notes: The latest observations are for February 2022. HICP indices are reported for the EU countries.
Commodity prices have eased since the Governing Council’s meeting in March, but remain sensitive to supply risks owing to the war in Ukraine. Amid high volatility, oil prices have fallen by 18% since the Governing Council’s March meeting. This was driven partly by the United States’ decision to release 1 million barrels of strategic oil reserves per day for the next six months, as well as by the release of an additional 330 thousand barrels per day by other members of the International Energy Agency and downside risks to demand stemming from the recent lockdowns in China. While the dispute between Russia and the G7 group and the European Union over the currency denomination of gas payments led to renewed concerns about gas imports from Russia, gas prices have fallen by 30%, as markets appear to be relieved that Russian gas exports to Europe did not decrease after the Russian invasion of Ukraine. Non-energy commodity prices have declined slightly (by 2%) since the Governing Council meeting in March. This is due to the easing of concerns about potential supply shortfalls owing to the war and because the lockdowns in China pose downside risks to demand for metals. However, commodity prices in general remain above the levels observed before Russia’s invasion of Ukraine (Chart 3). The war is posing significant risks to supply, as Russia is a leading exporter of a broad range of commodities including oil, gas, aluminium, fertilisers and wheat.
Chart 3
Commodity price developments since Russia’s invasion of Ukraine
(index: 23 February 2022 = 100)
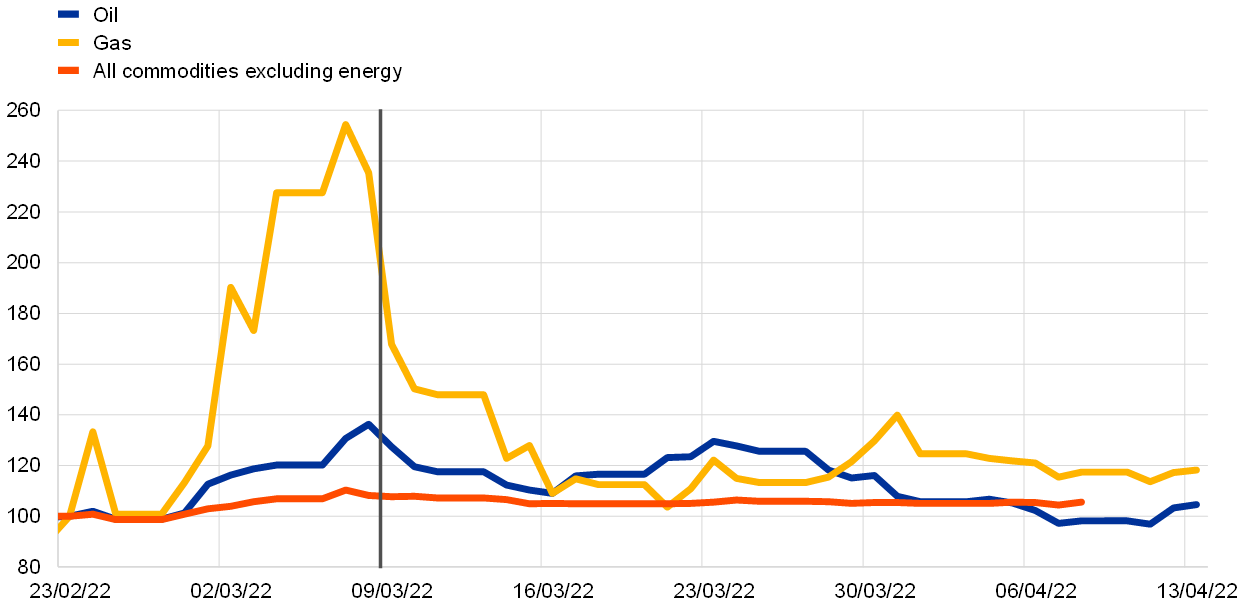
Sources: Refinitiv, HWWI and ECB calculations.
Notes: Gas refers to the Dutch TTF gas price. The vertical line marks the date of the Governing Council meeting in March 2022. The latest observations are for 13 April 2022.
In the United States, economic activity is expected to moderate in the first quarter of 2022, while a rebound is forecast for the second quarter. Although the Omicron wave is fading, waning fiscal support coupled with high inflation has led to a fall in real disposable income since the last quarter of 2021. Consequently, consumer spending – particularly in low-income households – could be dampened at the start of this year, also as a result of the impact of the war on commodity prices. Nevertheless, household balance sheets are healthy overall. In addition, a robust labour market and strong nominal incomes are expected to support economic growth over the rest of the year. Meanwhile, the labour market remains tight amid labour supply shortages, which has translated into intensifying wage pressures. Annual headline CPI inflation rose to 8.5% in March, while core inflation increased to 6.5%. Energy prices remain a significant driver of inflation, along with supply bottlenecks, which are putting pressure on goods prices. Services prices also increased amid an ongoing rise in rents, while prices also rebounded in transportation services. In response to the tight labour market and high inflation, the Federal Reserve System increased its target rate and tightened its policy stance at its March meeting.
In China, the highest recorded incidence of COVID-19 cases since the start of the pandemic is likely to hold back growth in the short term. While activity appeared relatively strong in January and February, the sharp increase in COVID-19 case numbers in March led to widespread lockdowns, which are significantly dampening growth. Local lockdowns imposed by authorities could further disrupt important supply chains. The decrease in traffic congestion in key port and finance cities such as Shanghai and Shenzhen, which account for around one-sixth of China’s exports, suggests that growth momentum was decelerating at the end of the first quarter. With cases still rising and major cities in lockdown, the economy is likely to continue to slow in the second quarter of 2022.
In Japan, the recovery in economic activity softened at the start of 2022 with the spread of the Omicron variant. High-frequency data suggest that the sharp increase in COVID-19 cases since the start of the year and the introduction of quasi-state of emergency measures in a number of prefectures contributed to a decline in consumer expenditure and confidence in January and February. With COVID-19 cases peaking in early February and the emergency measures being lifted in March, the negative impact of Omicron on economic activity is currently expected to be short-lived. Annual headline CPI inflation increased to 0.9% in February, driven by rising energy prices and, to a lesser extent, food prices, while core inflation rose slightly to -1.8%. Core inflation continues to be weighed down by the previous year’s sharp declines in mobile phone charges, after the Government asked carriers to lower their fees. As this factor starts to fade from the year-on-year data, inflation rates are expected to rise towards the 2% target.
In the United Kingdom, the economy is rebounding quickly from the impact of the Omicron variant, but surging inflation has started to weigh on consumer confidence. Real GDP softened in February after surprising to the upside in January, increasing by 0.1% month on month. While economic activity was mainly supported by an increase in consumer services, activity in the manufacturing and construction sectors fell. Looking ahead a deterioration in consumer confidence signals a marked slowdown in growth momentum. As a result of the surge in inflation, rising interest rates and tighter fiscal policy, private households are increasingly concerned about their income prospects. Annual headline CPI inflation, driven mainly by the energy component, rose to 7.0% in March, with prices for furniture and household equipment and in the hospitality sector also contributing to this rise. Meanwhile, core inflation increased to 5.7%. The Bank of England increased its policy rate from 0.50% to 0.75% at its Monetary Policy Committee meeting in March, taking into consideration the tightness in the labour market and the continued signs of robust domestic cost and price pressures.
The recent surge in commodity prices is expected to weigh on the growth prospects of commodity-importing EMEs. The deterioration in the terms of trade in commodity-importing EMEs, especially in key Asian manufacturing countries, is generating a negative income effect that weighs on economic activity. Moreover, commodity importers with current account deficits, such as India and Turkey, could be hit harder if foreign investors are unwilling to finance the higher deficits necessary to fund these countries’ commodity imports. By contrast, in key commodity-exporting EMEs, such as Iran, Nigeria and Saudi Arabia, the increases in commodity prices are expected to cushion the negative impact of falling foreign demand and the rising prices of other commodities. Monetary policy actions across EMEs have remained diverse in recent weeks, reflecting differences in inflation developments. While some countries, such as Brazil, Mexico and South Africa, have continued to increase policy rates, others, including India and Indonesia, have kept rates constant.
2 Economic activity
The euro area economy grew by 0.3% in the final quarter of 2021. It is estimated that growth remained weak during the first quarter of 2022, largely owing to pandemic‑related restrictions.
Russia’s aggression towards Ukraine is causing enormous suffering. It is also affecting the economy, in Europe and beyond. The war is already weighing on the confidence of businesses and consumers, including through the uncertainty it brings. With energy and commodity prices rising sharply, households are facing a higher cost of living and firms are being confronted with increased production costs. The war has created new bottlenecks, while a fresh set of pandemic-related measures in Asia is contributing to supply chain difficulties. Some sectors face growing difficulties in sourcing their inputs, which is disrupting production. However, there are also offsetting factors underpinning the ongoing recovery, such as compensatory fiscal measures and the possibility for households to draw on savings accumulated during the pandemic. Moreover, the reopening of those sectors that have been most affected by the pandemic and a strong labour market with more people in jobs will continue to support incomes and spending.
Fiscal and monetary policy support remains critical, especially in this difficult geopolitical situation. In addition, the successful implementation of investment and reform plans under the Next Generation EU programme will accelerate the energy and green transitions. This should help to enhance long-term growth and resilience in the euro area.
Euro area real GDP growth slowed in the final quarter of 2021, following the greater dynamism observed in the two previous quarters. Output growth moderated to stand at 0.3% quarter on quarter in the fourth quarter of last year, following stronger readings in the second and third quarters (Chart 4). This outcome was in line with the flash estimate. GDP is now 0.2% above the pre‑pandemic peak observed in the final quarter of 2019, and the carry-over effect on annual growth this year is estimated at 1.9%. Domestic demand and changes to inventories made a positive contribution to growth in the fourth quarter, whereas net trade had a negative impact. The rise in output in the fourth quarter was broad-based across countries, notwithstanding the decline in Germany. The latest estimate for 2021 puts GDP growth at 5.3%, the biggest annual rise since the early 1970s. On the production side, total value added edged upwards, rising by 0.1% quarter on quarter in the fourth quarter. Value added in industry excluding construction was unchanged, with the same being observed in the service sector, while value added in the construction sector rose by 1.1%.
Chart 4
Euro area real GDP, the composite output PMI and the ESI
(left-hand scale: quarter-on-quarter percentage changes; right-hand scale: diffusion index)
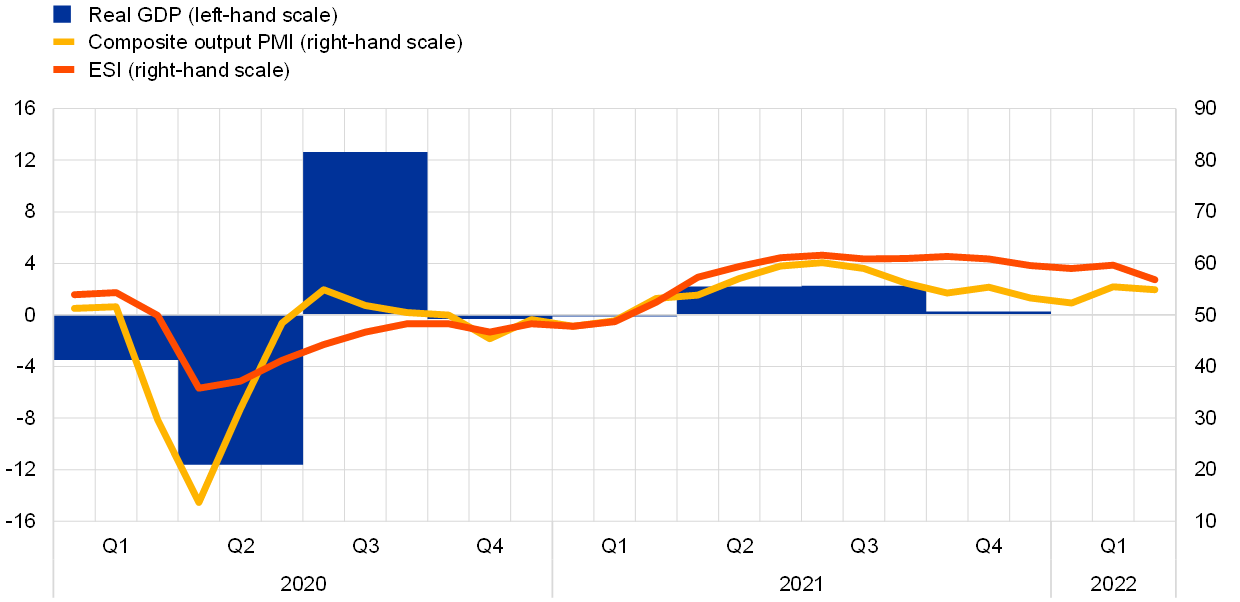
Sources: Eurostat, European Commission, IHS Markit and ECB calculations.
Notes: The two lines indicate monthly developments; the bars show quarterly data. The European Commission’s Economic Sentiment Indicator (ESI) has been standardised and rescaled so that it has the same mean and standard deviation as the Purchasing Managers’ Index (PMI). The latest observations are for the fourth quarter of 2021 for real GDP and March 2022 for the PMI and the ESI.
Growth is expected to have remained weak in the first quarter of 2022 amid the Omicron wave, the further rise in energy costs and Russia’s invasion of Ukraine. The deceleration in activity in the fourth quarter of last year and the expectations of further muted growth in the first quarter of this year are in line with the new restrictions aimed at tackling the fast-spreading Omicron variant of the coronavirus. While that relates mainly to services, Russia’s invasion of Ukraine will also have negative consequences for overall activity – particularly in the industrial sector – in the short run. Furthermore, while the supply chain disruptions caused by the pandemic had shown some signs of easing before the outbreak of war, there have been indications that bottlenecks are increasing again (e.g. as a result of a new set of pandemic-related measures in Asia). In addition, high energy costs are having an adverse effect on households’ purchasing power and creating additional headwinds for private consumption and economic activity. Information from companies operating in the non‑financial sector broadly confirms this overall narrative regarding the short‑term outlook (Box 2).
Incoming data support the view that growth was muted at the beginning of this year. The level of industrial production in January 2022 was unchanged relative to December 2021, standing 1.6% above the average level for the fourth quarter. However, the impact of current developments in Ukraine is visible in more timely survey data. For instance, the composite output PMI fell to 54.9 in March, down from 55.5 in February, entirely on the back of a softening manufacturing sector. At the same time, the PMI indicator for suppliers’ delivery times, which captures supply chain disruption in the manufacturing sector, deteriorated again, returning to the level seen at end‑2021. Furthermore, the composite indicator of business expectations 12 months ahead fell sharply in March, the second largest drop since its inception in 2012. The ESI also declined sharply in March on the back of the invasion of Ukraine. Its average for the first quarter was below the equivalent figure for the fourth quarter of 2021, but still higher than both the long‑term average and the pre-pandemic level. Sentiment weakened in almost all euro area countries in March. The ECB’s latest Survey of Professional Forecasters (which was conducted in early April) put quarterly euro area growth at 0.2% in the first quarter, representing a clear downward revision relative to the previous survey round (which had been conducted in early January).
The unemployment rate in the euro area is continuing to decline, although total hours worked remain below pre-pandemic levels. The unemployment rate stood at 6.8% in February 2022, 0.1 percentage points lower than in January and around 0.6 percentage points lower than the pre-pandemic level observed in February 2020 (Chart 5). As a result of the relaxation of pandemic-related containment measures, workers covered by job retention schemes accounted for 1.3% of the labour force in February 2022, down from around 1.6% in December 2021. The latest national accounts data indicate that total hours worked remained below pre-pandemic levels in the fourth quarter of 2021, especially in industrial and market services sectors, reflecting those ongoing job retention schemes.
Chart 5
Euro area employment, the PMI employment indicator and the unemployment rate
(left-hand scale: quarter-on-quarter percentage changes, diffusion index; right-hand scale: percentages of the labour force)

Sources: Eurostat, IHS Markit and ECB calculations.
Notes: The two lines indicate monthly developments; the bars show quarterly data. The PMI is expressed as a deviation from 50 divided by 10. The latest observations are for the fourth quarter of 2021 for employment, March 2022 for the PMI and February 2022 for the unemployment rate.
Short-term labour market indicators continued to improve in the first quarter, amid some initial signs of future weakening. The monthly composite PMI employment indicator reached 54.7 in March, 0.2 points higher than in February, thus remaining above the threshold level of 50 that indicates an expansion in employment. The PMI employment indicator has recovered strongly following its all‑time low in April 2020 and has now been in expansionary territory for 14 consecutive months. Looking at developments in different sectors, the PMI employment indicator for the manufacturing sector pointed to a weakening in March, whereas the indicator for the service sector continued to point to robust employment growth. Meanwhile, the latest European Commission survey data on the employment expectations of firms and the unemployment expectations of workers show that Russia’s invasion of Ukraine could already be weighing on labour market dynamics in the second quarter of 2022.
After contracting at the end of 2021, private consumption is expected to have remained weak at the beginning of this year amid sharp increases in energy prices and high levels of uncertainty. While the lifting of pandemic-related restrictions has supported activity, particularly in the service sector, the soaring energy prices that have followed Russia’s invasion of Ukraine are denting households’ real disposable income and eroding consumer sentiment. Against that background, consumer confidence fell in March to the lowest level since the beginning of the pandemic. At the same time, the European Commission’s latest Consumer Survey indicates that households’ expectations regarding their economic and financial situation over the next 12 months have deteriorated sharply as inflation has ramped up and uncertainty regarding the war in Ukraine has surged. Although heightened uncertainty could lead households to increase precautionary savings, the very sharp rise in energy prices could be partly cushioned, at an aggregate level, by some decumulation of excess savings. This is supported by recent evidence in March pointing to a drop in households’ intentions to save over the next 12 months (as indicated by the European Commission’s Consumer Survey), along with the saving rate falling to 13.3% in the fourth quarter of 2021 (down from 15% in the third quarter). Nevertheless, persistently high energy costs, combined with a loss of confidence, are likely to constrain consumption in the short term (see Article 1 for more detailed information on the way in which energy prices affect private consumption) and make the recovery more fragile and uneven. Low-income households are likely to bear the brunt, as they tend to spend a larger share of their income on energy and have accumulated smaller stocks of savings during the pandemic (Box 3). Over the medium term, private consumption is expected to remain the primary driver of economic growth, benefiting from solid underlying conditions as economies reopen and the labour market continues to improve.
Business investment is expected to have grown further in the first quarter of 2022, but the outlook has become more uncertain. Non-construction investment increased by 6.3% quarter on quarter in the fourth quarter of 2021 owing to intangible assets – mostly, but not only, in Ireland – as well as transport and other machinery and equipment. As regards the first quarter of 2022, capital goods production in January was 1.7% above the average level for the fourth quarter of 2021. That increase, combined with strong survey data on orders and production expectations for most of the first quarter, as well as positive – albeit weakening – loan demand, points to a rise in investment in the first quarter of the year. Looking ahead, uncertainty has increased, and Russia’s invasion of Ukraine is likely to constrain investment as a result of higher energy costs, the intensification of supply chain bottlenecks and heightened uncertainty. Meanwhile, growth in business investment will be supported by high levels of capacity utilisation, as well as funding under the Next Generation EU initiative aimed at supporting digitalisation, R&D, infrastructure and the transition to a green economy.
Housing investment continued to be supported by strong demand in the first quarter, while supply-related constraints are set to increase owing to the war. Following a rebound in euro area housing investment in the fourth quarter of 2021, several short-term indicators point to a continuation of that momentum in the first quarter of 2022. For example, building construction output in January was 3.0% above the average for the fourth quarter. Meanwhile, the PMI for residential construction output advanced further into expansionary territory on average in the first quarter, and the European Commission’s indicator of recent trends in construction activity increased significantly. According to survey data on limits to production, the recovery in the construction sector has been driven by a decline in demand-related constraints, while supply-related constraints have increased owing to shortages of labour and materials. At the same time, however, the invasion of Ukraine has led to a high degree of uncertainty regarding the outlook for housing investment in the second quarter. On the one hand, the continuation of the war is likely to exacerbate shortages of materials and increases in input costs, thus hampering construction output, as reflected in the fact that the PMI for the business expectations of construction firms fell into contractionary territory in March. On the other hand, however, the large stocks of liquidity held by households and the current dynamism of house prices could further support demand.
Euro area trade continued to recover in January, but the near-term outlook has deteriorated significantly. In January, nominal extra-euro area goods exports rebounded following a decline in December, while extra-euro area imports continued to increase. The goods trade balance remained in deficit owing to the higher cost of energy imports. While trade data for January pointed to an easing of supply chain bottlenecks, supporting export growth, March saw an increase in the numbers of goods blocked in global ports and a rise in shipping costs as a result of pandemic‑related lockdowns in China and the invasion of Ukraine, suggesting that this improvement may have come to an end. Forward-looking indicators of manufacturing exports fell into contractionary territory in March owing to the drop in demand that has resulted from the invasion of Ukraine and the sanctions imposed on Russia. Similarly, the PMI for export orders in the service sector has moved into contractionary territory despite the relaxation of pandemic-related restrictions. However, indicators of travel bookings point to a continuing recovery ahead of the summer season, especially with regard to intra-euro area travel.
Although several factors point to slow growth in the period ahead, there are also offsetting factors underpinning the ongoing recovery. The results of the latest Survey of Professional Forecasters show that GDP growth forecasts have been revised downwards for both 2022 and 2023 since the previous survey round. While the war is a major factor weighing on the outlook for the euro area economy, there are other factors which should support the ongoing recovery (such as compensatory fiscal measures and the possibility for households to draw on savings accumulated during the pandemic). Moreover, the reopening of those sectors that have been most affected by the pandemic and a strong labour market with more people in jobs will continue to support incomes and spending. Fiscal and monetary policy support remains critical, especially in this difficult geopolitical situation. In addition, the successful implementation of investment and reform plans under the Next Generation EU programme will accelerate the energy and green transitions. This should help to enhance long-term growth and resilience in the euro area.
3 Prices and costs
Inflation increased to 7.5% in March according to Eurostat’s flash estimate, up from 5.9% in February. Energy prices were driven higher after the outbreak of the war and in March stood 45% above their level a year ago. Energy prices continued to be the main reason for the high rate of headline inflation. Market-based indicators suggest that energy prices will stay high in the near term but will then moderate to some extent. Food prices have also increased sharply, reflecting elevated transport and production costs, notably the higher price of fertilisers, in part related to the war in Ukraine. Price rises have become more widespread. Energy costs are pushing up prices across many sectors. Supply bottlenecks and the normalisation of demand as the economy reopens are also continuing to put upward pressure on prices. Measures of underlying inflation have risen to levels above 2% in recent months. It is uncertain how persistent the rise in these indicators will be, given the role of temporary pandemic-related factors and the indirect effects of higher energy prices.
According to Eurostat’s flash estimate, HICP inflation saw a further sharp increase to 7.5% in March 2022 (Chart 6). This strong rise of 1.6 percentage points since February partially reflected the impact of the war in Ukraine. In this respect, the increase in headline inflation was predominantly driven by elevated energy prices, although food inflation and HICP inflation excluding energy and food (HICPX) also rose. HICPX growth was 3.0% in March, reflecting the dynamics of both service prices and non-energy industrial goods prices.
Chart 6
Headline inflation and its main components
(annual percentage changes; percentage point contributions)

Sources: Eurostat and ECB calculations.
Note: The latest observations are for March 2022.
Energy inflation reached a new record high of 44.7% in March, up from 32.0% in the previous month (Chart 7). The year-on-year rates of change in energy prices since September 2021 have all been the highest observed since the creation of Monetary Union. Data up to February suggest that gas and electricity tariffs were the main drivers of higher energy price inflation in the early months of 2022, with electricity prices partly reflecting price increases in other energy commodities. It is also likely that personal transport fuel costs, as well as elevated refining and distribution margins, made a larger contribution in March. The factors behind the latest increases in energy prices are related to the Russian invasion of Ukraine and associated concerns regarding possible energy supply disruptions. The surge in energy costs in recent months has probably also contributed to increases in other components of the HICP, including food inflation and non-energy industrial goods inflation (which stood at 5.0% and 3.4% respectively in March), given that energy is an input for both production and distribution. The war in Ukraine is also putting upward pressure on food prices, because both Russia and Ukraine are important exporters of grains, as well as of minerals used in the production of fertilisers. Mounting pressures on consumer energy prices have been partly mitigated by tax measures introduced by euro area governments.
Chart 7
HICP energy and its components
(annual percentage changes; percentage point contributions)

Sources: Eurostat and ECB calculations.
Notes: The latest observations for HICP energy are for March 2022. The percentage point contribution of fuels for March 2022 is an ECB staff estimate based on data from the European Commission’s Weekly Oil Bulletin published on 4 April. The latest observations for the rest of the series are for February 2022.
Measures of underlying inflation have risen to levels above 2% in recent months, but it is uncertain how persistent the rise in these indicators will be given the role of temporary pandemic-related factors and the indirect effects of energy prices. Measures of inflation that seek to remove the impact of volatile components and temporary factors have increased further in recent months (Chart 8). HICPX inflation rose to 3.0% in March, up from 2.7% in February. Data on other measures of underlying inflation are only available up to February. In that month, HICPXX inflation (which excludes travel-related items, clothing and footwear, as well as energy and food) increased to 2.6%, up from 2.3% in January, when it temporarily moderated. Meanwhile, the model-based Persistent and Common Component of Inflation (PCCI) rose to 4.4%, up from 4.0% in January (while the PCCI excluding energy increased to 2.7%, up from 2.4% in January). The Supercore indicator, which comprises cyclically sensitive HICP items, also edged upwards to stand at 2.8%, from 2.6% in January. It is uncertain how persistent the rise in these indicators will be given the role of temporary pandemic-related factors and the indirect effects of higher energy prices. Looking ahead developments in wages will be a key factor for the future dynamics of underlying inflation. The latest available data (for the fourth quarter of 2021) continued to point to relatively moderate annual growth in both negotiated wages (1.6%) and actual wages, where growth in compensation per hour and growth in compensation per employee stood at 1.1% and 3.5% respectively, although the latter was considerably distorted upwards owing to the impact of job retention schemes.
Chart 8
Indicators of underlying inflation
(annual percentage changes)

Sources: Eurostat and ECB calculations.
Notes: The range of indicators of underlying inflation includes HICP excluding energy, HICP excluding energy and unprocessed food, HICPX (HICP excluding energy and food), HICPXX (HICP excluding energy, food, travel-related items, clothing and footwear), the 10% and 30% trimmed means, and the weighted median. The latest observations are for February 2022, with the sole exception of HICPX (which was obtained from the March 2022 flash estimate).
Pipeline pressures on consumer prices for non-energy industrial goods have continued to build up, with indicators reaching record highs, although they still only partially reflect the impact of the war in Ukraine (Chart 9). Cost pressures have continued rising in February relative to a year ago, driven by increases in global commodity prices and, in particular, energy prices. Supply chain disruptions and the global recovery in demand have also contributed to input cost pressures. Looking at the early stages of the pricing chain, the annual growth rate of producer prices for domestic sales of intermediate goods reached 20.8% in February, up from 20.5% in the previous month. At the same time, the annual growth rate of import prices for intermediate goods edged down from a record high of 21.2% in January to 20.7% in February. Pressures also feature more prominently at later stages of the pricing chain, with producer price inflation for domestic sales of non-food consumer goods reaching a new historical high of 5.4% in February, up from 5.0% a month earlier. Import price inflation for non‑food consumer goods moderated to 6.1% in February, after standing at 6.4% in January. These import and producer price developments for non-food consumer goods imply that pressure on non-energy industrial goods inflation in the HICP is unlikely to ease in the near future.
Chart 9
Indicators of pipeline pressures
(annual percentage changes)

Sources: Eurostat and ECB calculations.
Note: The latest observations are for February 2022.
While various measures of longer-term inflation expectations derived from financial markets and from expert surveys largely stand at around 2%, initial signs of above-target revisions in those measures warrant close monitoring. Market-based measures of inflation compensation – which estimate future year-on-year inflation rates for HICP excluding tobacco – now suggest that euro area inflation will peak at around 8% during the third quarter of 2022. It is expected to fall to slightly below 7% by the end of 2022, more than one percentage point higher than at the time of the March Governing Council meeting, before settling slightly above 2.5% in 2025. Moreover, longer-term measures of inflation compensation have further exceeded the ECB’s target, with the five-year forward inflation-linked swap rate five years ahead increasing by 23 basis points in the review period and reaching levels above 2.3% for the first time since mid-2013. Overall, markets are pricing in a more persistent increase in euro area inflation. However, market-based measures of inflation compensation are not a direct measure of market participants’ actual inflation expectations, since they contain inflation risk premia compensating for inflation uncertainty. Currently, these premia are assessed to be positive, implying that actual inflation expectations are estimated to be lower and closer to 2% than the plain readings of market-based longer-term measures of inflation compensation. According to the ECB’s Survey of Professional Forecasters (SPF) for the second quarter of 2022, conducted between 1 and 4 April, average longer‑term inflation expectations (for 2026) rose further to 2.1%, from 2.0% in the January survey round.
Chart 10
Survey-based indicators of inflation expectations and market-based indicators of inflation compensation
(annual percentage changes)

Sources: Eurostat, Refinitiv, Consensus Economics, Survey of Professional Forecasters, ECB staff macroeconomic projections for the euro area and ECB calculations.
Notes: The market-based indicators of inflation compensation series is based on the one-year spot inflation rate, the one-year forward rate one year ahead, the one-year forward rate two years ahead, the one-year forward rate three years ahead and the one-year forward rate four years ahead. The latest observations for market-based indicators of inflation compensation are for 13 April 2022. The Survey of Professional Forecasters for the second quarter of 2022 was conducted between 1 and 4 April 2022. In the Consensus Economics forecasts, the cut-off date for 2024, 2025 and 2026 was 10 January 2022, and the cut-off date for 2022 and 2023 was 14 March 2022. The cut-off date for data included in the ECB staff macroeconomic projections was 2 March 2022.
4 Financial market developments
Over the review period (10 March to 13 April 2022), global financial markets continued to rebound from the sharp falls recorded after Russia’s invasion of Ukraine. Overall, risk sentiment improved to some extent. The euro short-term rate (€STR) forward curve steepened further, bringing the market-implied date for a first 25 basis point increase in the key ECB interest rates forward to September 2022. This followed the Governing Council’s announcement in March that it had revised the schedule for net purchases under the asset purchase programme (APP) in the coming months and that net purchases under the APP would be concluded in the third quarter of the year if the incoming data supported the expectation that the medium-term inflation outlook would not weaken even after the end of its net asset purchases. After the same meeting the Governing Council also announced that any adjustments to the key ECB interest rates would take place some time after the end of its net purchases under the APP and would be gradual. Long-term sovereign bond yields rose substantially throughout the review period on both sides of the Atlantic, while changes in sovereign bond spreads remained very contained. Euro area risk asset markets largely recouped the losses that had accrued since the start of the war, with corporate bond spreads declining substantially and equity prices increasing notably over the review period. The euro continued to depreciate in trade-weighted terms.
The short to medium-term maturity segments of the €STR forward curve shifted markedly higher after the March Governing Council meeting, suggesting that market participants had significantly revised their expectations for a first increase in the key ECB interest rates. The overnight index swap (OIS) forward curve based on the benchmark short-term rate €STR steepened noticeably following the March Governing Council meeting, reversing the substantial flattening observed shortly after Russia’s invasion of Ukraine. The steepening suggests that market participants had revised their monetary policy expectations against the backdrop of growing inflationary pressures and the Governing Council’s announcement that it had revised the schedule for APP net purchases and that, if the incoming data supported the expectation that the medium-term inflation outlook would not weaken even after the end of its net asset purchases, the Governing Council would conclude net purchases under the APP in the third quarter. The date implied by the market for a first 25 basis point policy rate increase was brought forward to September 2022, almost two months earlier than the date priced in at the time of the March Governing Council meeting. The €STR averaged -58 basis points over the review period, while excess liquidity increased by approximately €68 billion to €4,545 billion.
Long-term euro area bond yields have increased substantially since the March Governing Council meeting, in tandem with developments in short-term rates (Chart 11). During the period under review, the average GDP-weighted euro area and German ten-year sovereign bond yields increased by 60 basis points and 58 basis points respectively, to stand at 1.35% and 0.77%, levels last seen at the end of 2018. Investors’ reassessment of global risk – which they considered to have decreased from the extraordinary levels reached immediately after Russia’s invasion of Ukraine just prior to the March Governing Council meeting – and concerns about inflationary pressures are likely to have contributed to the increase in long-term bond yields in the euro area and globally. Ten-year US government bond yields increased broadly in line with euro area rates over the review period, by 55 basis points to 2.55%, while ten-year UK government bond yields rose by 13 basis points to 1.65%. As sovereign bond yields in the euro area broadly mirrored risk-free rates, spreads over the OIS rate remained relatively stable. The aggregate GDP-weighted euro area ten-year sovereign bond spread declined by 3 basis points to 0.13%, partially driven by a 23 basis point decrease in Greek ten-year sovereign yield spreads, as Greece benefited from a credit rating increase and the country repaid a loan from the International Monetary Fund two years ahead of schedule.
Chart 11
Ten-year sovereign bond yields and the ten-year OIS rate based on the €STR
(percentages per annum)

Sources: Refinitiv and ECB calculations.
Notes: The vertical grey line denotes the start of the review period on 10 March 2022. The latest observations are for 13 April 2022.
The improvement in risk sentiment relative to the first few days of the Russian invasion contributed to a decline in corporate bond spreads, which returned to levels seen before the war. Spreads on investment-grade non-financial corporate bonds declined by 16 basis points to 53 basis points, while spreads on financial corporate bonds fell even further. Although close to their pre-pandemic averages, spreads remain slightly above the levels seen during 2021, possibly pointing to a gradual slowdown of the economic recovery from the pandemic. Overall, corporate bond spreads appear resilient in the face of the expected normalisation of monetary policy.
Euro area equity markets largely recouped the losses they recorded at the beginning of the war in Ukraine, despite higher discount rates and lower earnings growth expectations, as risk sentiment improved. Given some deterioration in confidence indicators relating to the economic outlook, the improvement in risk sentiment possibly reflects a reassessment during the review period of the risk of the war in Ukraine escalating further. Equity prices of euro area banks and non-financial corporations increased by 4.4% and 5.2% respectively, despite significantly higher risk-free rates on the back of the expected monetary policy normalisation. Analysts’ expectations for the long-term earnings growth of listed firms decreased to some extent but remained at elevated levels. In the United States, non-financial corporation equity prices increased by more than their euro area counterparts, advancing by 4.8%. However, share prices for US banks, which rebounded from the lows recorded at the start of the war, reversed again towards the end of March, closing the review period down 4.7%.
In foreign exchange markets, the euro continued to depreciate in trade-weighted terms, reflecting a weakening against most major currencies (Chart 12). Over the review period the nominal effective exchange rate of the euro, as measured against the currencies of 42 of the euro area’s most important trading partners, weakened by 1.9%. This reflected a depreciation of the euro against the US dollar (by 2.3%) – amid rising expectations of a faster pace of monetary tightening and following the first increase in the Federal Reserve System’s target range for the federal funds rate in more than three years – as well as against the currencies of other major economies, including the pound sterling (by 1.1%) and the Swiss franc (by 1.5%). The euro also weakened against the currencies of most emerging market economies, including the Chinese renminbi (by 1.6%), but appreciated strongly vis-à-vis the Japanese yen (by 6.0%) amid growing expectations that the Bank of Japan would tighten monetary policy at a significantly slower pace than other major central banks.
Chart 12
Changes in the exchange rate of the euro vis-à-vis selected currencies
(percentage changes)
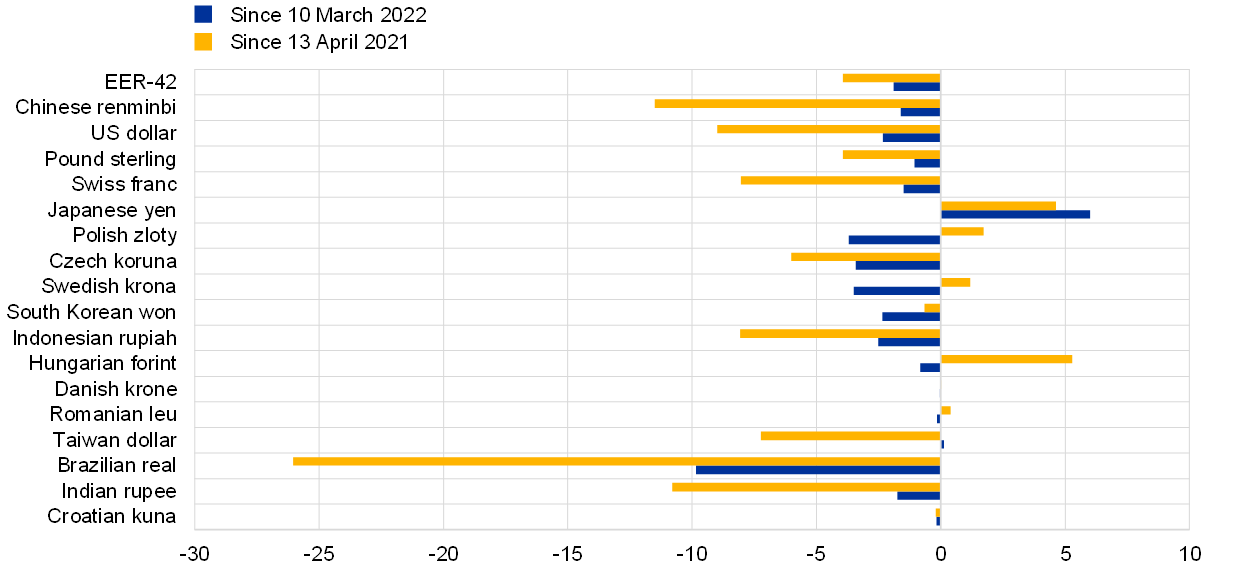
Source: ECB.
Notes: EER-42 is the nominal effective exchange rate of the euro against the currencies of 42 of the euro area’s most important trading partners. A positive (negative) change corresponds to an appreciation (depreciation) of the euro. All changes have been calculated using the foreign exchange rates prevailing on 13 April 2022.
5 Financing conditions and credit developments
Bank funding and lending conditions have tightened amid increased uncertainty regarding the economic outlook and expectations of a further normalisation of monetary policy. While they remain at low levels, lending rates for firms and households have started to reflect the increases seen in market interest rates. The latest data (as at mid-April) show that the cost of market-based debt financing for firms has increased further, albeit at a slower pace than in the previous two months. Lending to households is holding up (especially for house purchases), while lending flows to firms have stabilised. The most recent bank lending survey indicates that credit standards on loans to firms and loans to households for house purchase tightened overall in the first quarter of the year, with lenders becoming more concerned about the risks facing their customers in an uncertain environment. Credit standards are expected to tighten further in the coming months as banks factor in the adverse economic impact of the war in Ukraine and higher energy prices. While money creation has returned to a level close to its longer-term average, deposit accumulation by firms and households continues to be stronger than it was before the pandemic.
The funding costs of euro area banks have risen in recent months amid expectations of further policy normalisation. February saw a sharp increase in the composite cost of euro area banks’ debt financing (Chart 13, panel a). This was driven mainly by rising yields on bank bonds (Chart 13, panel b), and these, in turn, reflected a strong increase in risk‑free rates. At the same time, rates on deposits, which account for a large share of euro area banks’ funding, have remained stable close to their historical lows, as targeted longer-term refinancing operations (TLTROs) have also provided banks with liquidity at favourable conditions. Thus far, significant use by banks of these alternative funding sources has limited upward pressure on their overall funding costs. However, the recent rise in market rates at all maturities suggests that banks’ funding costs will be subject to more upward pressure in the coming months.
Chart 13
Composite bank funding rates in selected euro area countries
(annual percentages)
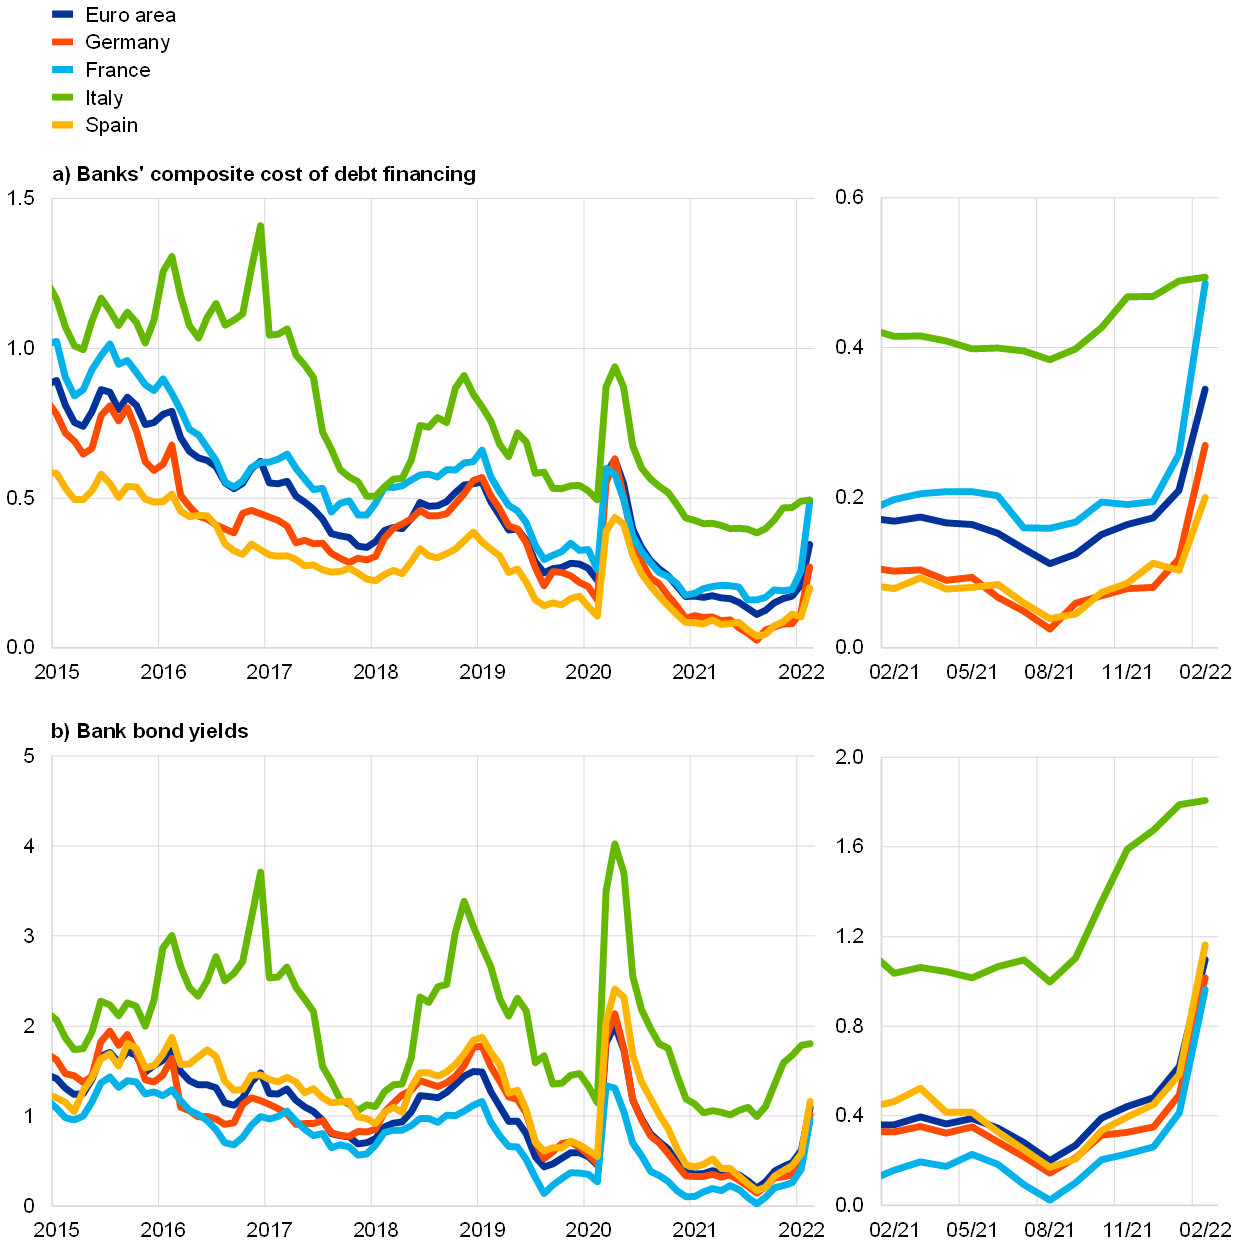
Sources: ECB, IHS Markit iBoxx indices and ECB calculations.
Notes: Composite bank funding rates are a weighted average of the cost of deposits and unsecured market-based debt financing. The composite cost of deposits is calculated as an average of new business rates on overnight deposits, deposits with an agreed maturity and deposits redeemable at notice, weighted by their respective outstanding amounts. Bank bond yields are monthly averages for senior-tranche bonds. The latest observations are for February 2022.
Bank lending rates for firms and households have started to reflect the increases seen in market rates, but they remain at low levels (Chart 14). The recent sharp increase in euro area yields has put upward pressure on domestic lending rates, but the pass-through has been very limited thus far, with financing conditions for firms and households remaining favourable. In February, the composite bank lending rate for loans to households for house purchase increased moderately to stand at 1.38%, while the equivalent rate for loans to non-financial corporations (NFCs) remained broadly unchanged at 1.41%. The increase in mortgage rates was broadly based across euro area countries. The spread between bank lending rates on very small loans and large loans was broadly unchanged amid cross-country heterogeneity and remained below pre-pandemic levels. Thus far, the ECB’s policy measures have prevented any broad-based tightening of financing conditions, which would have amplified the adverse economic impact of the pandemic and Russia’s invasion of Ukraine. Looking ahead, however, increases in banks’ funding costs may translate into more significant increases in lending rates for firms and households.
Chart 14
Composite bank lending rates for NFCs and households
(annual percentages)

Source: ECB.
Notes: Composite bank lending rates are calculated by aggregating short and long-term rates using a 24-month moving average of new business volumes. The latest observations are for February 2022.
Since the Governing Council met in mid-March, the cost of market-based debt for NFCs has increased marginally, while the cost of equity has dropped significantly. If the cost of bank borrowing is assumed to have remained unchanged at its February level, the cost of external financing is estimated to have declined, standing at 5.4% on 13 April 2022, down from 5.5% in mid-March (Chart 15). This represents a decline relative to some of the levels seen earlier this year, but it is still well above most of the rates recorded in 2020 and 2021 and close to the cyclical peak observed in March 2020. If, however, upward pressure on lending rates has resulted in an increase in the cost of bank borrowing, the overall cost of external financing will be higher than the estimated figure cited above. The slight increase in the cost of market-based debt is accounted for by a significant rise in the risk-free rate, which has more than offset the compression of non-financial corporate bond spreads. An improvement in risk sentiment, amid growing confidence that the fighting in Ukraine will not escalate further, has also been reflected in the equity market in the form of a sharp reduction in the equity risk premium. This, in turn, has led to a significant decline in the cost of equity, notwithstanding the increase in the discount rate.
Chart 15
Nominal cost of external financing for euro area NFCs by component
(annual percentages)
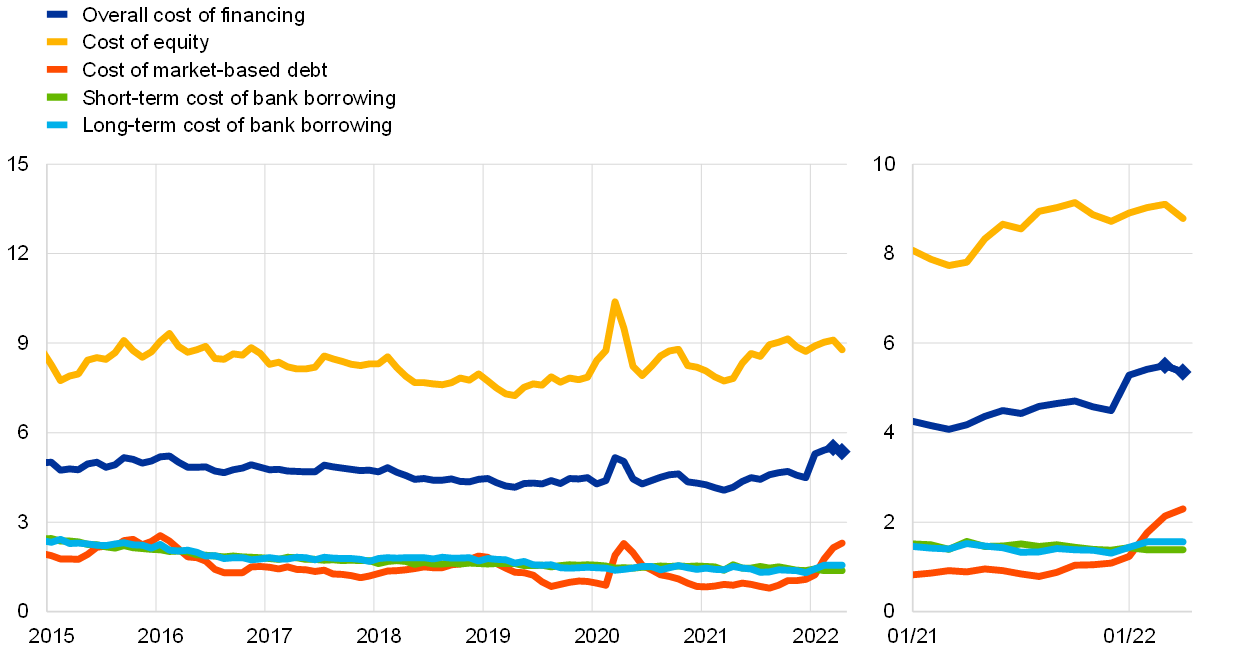
Sources: ECB and ECB estimates, Eurostat, Dealogic, Merrill Lynch, Bloomberg and Thomson Reuters.
Notes: The overall cost of financing for NFCs is calculated as a weighted average of the cost of borrowing from banks, market-based debt and equity, based on their respective outstanding amounts. The dark blue diamonds indicate nowcasts for the overall cost of financing in March and April 2022 (including data up to 13 April 2022), assuming that the cost of borrowing from banks remains unchanged at its February 2022 level. The latest observations are for 13 April 2022 for the cost of market-based debt (monthly average of daily data), 8 April 2022 for the cost of equity (weekly data) and February 2022 for the cost of borrowing from banks (monthly data).
According to the April 2022 euro area bank lending survey, credit standards on loans to firms tightened in the first quarter of 2022. Against the background of considerable uncertainty regarding the economic outlook, supply chain disruptions and high energy and input prices, banks also reported a slight tightening of credit standards on loans to households for house purchase in the first quarter of the year (Chart 16). The main factors underlying that tightening of credit standards were perceptions of increased risk and reduced risk tolerance. For the second quarter of 2022, banks expect to see considerably stronger tightening of credit standards on loans to firms, probably reflecting uncertainty regarding the economic impact of the war in Ukraine and the anticipation of less accommodative monetary policy. In addition, banks expect a moderate tightening of credit standards on loans to households for house purchase.
Chart 16
Changes in credit standards and net demand for loans to NFCs and loans to households for house purchase
(net percentages of banks reporting a tightening of credit standards or an increase in loan demand)

Source: Euro area bank lending survey.
Notes: For survey questions on credit standards, “net percentages” are defined as the difference between the sum of the percentages of banks responding “tightened considerably” and “tightened somewhat” and the sum of the percentages of banks responding “eased somewhat” and “eased considerably”. For survey questions on demand for loans, “net percentages” are defined as the difference between the sum of the percentages of banks responding “increased considerably” and “increased somewhat” and the sum of the percentages of banks responding “decreased somewhat” and “decreased considerably”. The latest observations are for the first quarter of 2022.
The results of that survey point to an increase in demand for loans on the part of firms and households in the first quarter of 2022. In the case of firms, the need for working capital made a strongly positive contribution to loan demand, reflecting supply chain bottlenecks and rising input costs, as well as demand for precautionary inventories and liquid holdings against the background of the heightened uncertainty. Fixed investment made a moderately positive contribution to firms’ loan demand, albeit that contribution was smaller than in the previous quarter. Demand for housing loans was supported mainly by the low general level of interest rates, while consumption of durable goods contributed to an increase in demand for consumer credit. For the second quarter of 2022, banks expect a further rise in firms’ demand for loans, driven by short-term loans, and a reduction in households’ demand for loans for house purchase.
The ECB’s policy measures continue to be regarded as having supported bank lending conditions, but banks expect this support to decline over the next six months. Banks indicate that the Eurosystem’s asset purchases, the TLTROs and the negative rate on the deposit facility have all had a positive impact on the volume of lending to firms and households over the last six months. The granting of loans to the non-financial private sector remains the most common use of funds obtained in the third series of targeted longer-term refinancing operations (TLTRO III), while the profitability motive remains the most important reason for banks to participate in those operations. In addition, banks continue to report that the Eurosystem’s asset purchases and the negative deposit facility rate are having a negative impact on their profitability, while TLTRO III and the ECB’s two-tier system for remunerating excess liquidity holdings have mitigated that negative impact. Banks also report that the Eurosystem’s asset purchases and TLTRO III have continued to have a positive impact on their liquidity positions and market financing conditions. However, banks expect this positive impact to decline over the next six months, turning negative in the case of asset purchases in the context of the envisaged normalisation of the monetary policy stance.
Annual growth in loans to non-financial corporations remained unchanged in February 2022, while growth in loans to households strengthened marginally. That slight increase in the annual growth rate of loans to households, which rose to 4.4% in February, up from 4.3% in January (Chart 17, panel b), reflected a pick-up in consumer credit growth and solid mortgage lending. The annual growth rate of loans to non-financial corporations remained unchanged at 4.4% (Chart 17, panel a), supported by monthly inflows for both short and longer-term loans. The increase in short-term loans was explained by the persistence of supply chain bottlenecks and rising energy costs, both of which contributed to increases in working capital needs. Although it was weaker than in the first half of 2021, growth in long-term lending continued to be supported by firms’ need to finance fixed investment. At the same time, aggregate developments at euro area level mask differences across individual countries, reflecting, among other things, the uneven impact of the pandemic and the fact that countries have made differing amounts of progress in terms of their economic recoveries.[1]
Chart 17
MFI loans in selected euro area countries
(annual percentage changes; standard deviation)

Source: ECB.
Notes: Loans are adjusted for loan sales and securitisation; in the case of non-financial corporations, loans are also adjusted for notional cash pooling. The cross-country standard deviation is calculated using a fixed sample of 12 euro area countries. The latest observations are for February 2022.
Deposit accumulation by firms and households is still stronger than it was before the pandemic (Chart 18). Sizeable inflows have been observed for overnight deposits since the start of the pandemic, reflecting the increase in economic uncertainty.[2] With coronavirus-related containment measures being relaxed, that growth in overnight deposits has moderated following the high growth rates that were observed in 2020 in the early stages of the pandemic. In February, however, the annual growth rate of overnight deposits fell only slightly, standing at 9.2%, down from 9.3% in January, coinciding with the materialisation of geopolitical risks and associated uncertainty. Growth in the deposit holdings of firms and households continues to vary across countries, reflecting differences in liquidity needs and national fiscal support measures.
Chart 18
M3, M1 and overnight deposits
(annual percentage changes; adjusted for seasonal and calendar effects)

Source: ECB.
Note: The latest observations are for February 2022.
Money creation continues to be driven by Eurosystem asset purchases. In February, the annual growth rate of M3 declined slightly to stand at 6.3%, down from 6.4% in January, thus continuing to move back towards its longer-term average (Chart 18). On the components side, the main driver of M3 growth is still the narrow aggregate M1, which is being driven by continued strong growth in overnight deposits. On the counterparts side, money creation continues to be driven by Eurosystem asset purchases. In February, the Eurosystem’s net purchases of government securities under the asset purchase programme and the pandemic emergency purchase programme made the largest contribution to annual M3 growth, but this contribution was somewhat smaller than in previous months, as purchases under these programmes are gradually being phased out. In addition, credit to the private sector continued to make a solid contribution to annual M3 growth. At the same time, money creation was somewhat dampened by net monetary outflows to the rest of the world, which probably reflected increased uncertainty regarding the impact that the war in Ukraine would have on the euro area economy.
Boxes
1 Implications of the terms-of-trade deterioration for real income and the current account
The recent sharp increase in natural gas and crude oil prices has led to a strong increase in euro area nominal energy imports. By the middle of 2021, these imports, along with import prices for gas and oil, had recovered from the economic shock induced by the coronavirus pandemic (Chart A). As of the second half of 2021, supply disruptions in combination with depleted gas inventories in importing countries led to a steep increase in energy prices, particularly for oil and gas. As economic activity and hence energy demand also recovered robustly, this resulted in euro area nominal energy imports reaching a level more than 40% higher than that seen before the outbreak of the coronavirus pandemic. In the following, we highlight the effects of the deterioration in the euro area terms of trade, the resulting negative income effect and its implications for the euro area current account.
2 Main findings from the ECB’s recent contacts with non-financial companies
This box summarises the results of contacts between ECB staff and representatives of 67 leading non-financial companies operating in the euro area. The exchanges mainly took place between 20 and 30 March 2022.[3]
3 The recent drivers of household savings across the wealth distribution
This box reviews the dynamics of household savings as derived from deposit flows across the wealth distribution from the onset of the coronavirus (COVID-19) pandemic in March 2020 to the surge in inflation that started mid-2021. Deposit flows are used as a proxy for household savings since they are a primary means of savings for households.[4] Deposit flows account for around half of the changes in households’ liquid assets and, in particular, help poorer households to smooth consumption in the face of economic shocks.[5] Mandatory and voluntary restrictions on mobility together with policy support measures produced a unique combination of declines in contact-intensive consumption on the one side and income resilience on the other. This led in turn to a large increase in deposit flows in the early phases of the COVID-19 pandemic. There has since been a slowdown in the accumulation of deposits owing to the recent surge in inflation, a recovery in demand and considerable supply bottlenecks.[6] These developments in deposit dynamics were unevenly distributed across household groups.[7] This box explores the drivers of euro area household deposit flows across the wealth distribution, where the distributional dimension has greater relevance given the potential macroeconomic implications of economic inequality.[8] The analysis focuses on the period from the onset of the COVID-19 pandemic in the first quarter of 2020 to the surge in inflation starting in the second quarter of 2021. The data used for this purpose are from the novel Distributional Wealth Accounts (DWA) for the euro area between the first quarter of 2009 and the third quarter of 2021.[9]
4 Minimum wages and their role for euro area wage growth
Minimum wages are prevalent in many euro area countries, and changes in minimum wages can have important effects on aggregate wage growth. Minimum wages exist in 15 of the 19 euro area countries.[10] Minimum wage levels are set using different methods – including predetermined formulas, expert committee recommendations and consultation with social partners – and are often also subject to government discretion. The frequency of change differs from one country to another, but most countries revise their minimum wages every one or two years. Changes in minimum wages can have a direct mechanical effect on aggregate wage growth in an accounting sense. An increase in minimum wages pushes up the wage level of those who previously received a wage below the new minimum wage. The increase of the minimum wage can – especially in the case of large increases – also push up the share of minimum wage recipients in the economy. Minimum wage changes can also have an indirect impact through knock-on effects on above-minimum wages in order to keep a certain distance from minimum wages or through the use of minimum wage increases as a benchmark for wage negotiations.
5 What explains recent errors in the inflation projections of Eurosystem and ECB staff?
Recent projections by Eurosystem and ECB staff have substantially underestimated the surge in inflation, largely due to exceptional developments such as unprecedented energy price dynamics and supply bottlenecks. Although headline HICP inflation projections for 2020 were fairly accurate despite the emergence of the coronavirus (COVID-19) pandemic, some underestimation began to occur in the first quarter of 2021, and this has become more pronounced since the third quarter of 2021. The underestimate for the first quarter of 2022 marked the largest one-quarter-ahead error for inflation since the first staff projections in 1998 – a 2.0 percentage point difference between the outturn and the December 2021 projection (Chart A, panel a). The accuracy of HICP projections, measured by the root mean squared forecast error, has declined significantly during the COVID-19 crisis (Chart A, panel b), although up to the second quarter of 2021 (green dots) the projections were still, on average, more accurate than those made during the global financial crisis, despite that period seeing smaller fluctuations in activity than during the COVID-19 period. The deterioration of projection accuracy has mainly occurred since the third quarter of 2021, when unexpected developments in energy prices, coupled with both the effects of reopening following the removal of coronavirus-related restrictions and the effects of global supply bottlenecks, led to unprecedented increases in HICP inflation (grey dots).
6 The role of speculation during the recent increase in EU emissions allowance prices
The price of emissions allowances (EUA) traded on the EU’s Emissions Trading System (ETS) has increased from below €10 per metric tonne of carbon to above €90 since the beginning of 2018 (Chart A). In general, as discussed below, EUA prices are mainly driven by demand-side factors (such as economic activity and fuel switching) and public policies. Market commentary suggests that major factors behind the increase since early 2018 are likely to have been the introduction of increasingly stringent climate change policies in the EU and globally, alongside various changes in ETS market design. In April 2018 the introduction of the revised EU ETS Directive[11] – which sets the framework for the fourth trading period, from 2021 to 2030 – appears to have enhanced the credibility of the scheme.[12] The announcement by the European Commission of the European Green Deal in late 2019 is also reported to have supported EUA prices, alongside the endorsement by the European Council of a new EU-wide emission reduction target in late 2020.
7 Gradual phasing-out of pandemic collateral easing measures
Collateral easing measures have played a key role in the ECB’s monetary policy response to the coronavirus (COVID-19) pandemic, facilitating access to Eurosystem credit operations. The temporary collateral measures (summarised in Figure A) were introduced in April 2020 to ensure that the banking sector could expand its access to central bank liquidity on favourable terms via the Eurosystem’s liquidity-providing credit operations (mainly targeted longer-term refinancing operations or TLTRO III), allowing it to continue to cover the funding needs of the euro area economy.[14] More specifically, these measures were introduced to serve the following three interconnected primary objectives.
Articles
1 Energy prices and private consumption: what are the channels?
The recent increase in energy prices raises the question of the extent to which households will reduce their consumption in response. With the global economy in the process of recovering from the coronavirus (COVID-19) pandemic, the prices of many commodities – including oil and gas – have soared over the last year or so. Since demand for energy is inelastic in the short run, those large price increases imply significant declines in households’ purchasing power, which will need to be absorbed through (i) reduced consumption of non-energy goods and services, (ii) a reduction in savings or (iii) an increase in income. This article assesses the extent to which those three margins are playing a role in the transmission of higher energy prices to aggregate consumption. In addition, it analyses the distributional impact of higher energy prices, as the effect on individual households tends to vary considerably. Since the distributional impact of such price rises has the potential to be very significant, that may warrant a separate policy response independently of the macroeconomic implications of those developments.
2 Economic inequality and public trust in the European Central Bank
In most advanced economies, income and wealth inequality have increased since the early 1980s, although the available data point to diverse national trajectories. Wealth concentration and income inequality have been shown to be rising in continental Europe, but substantially less so than, for example, in the United States and the United Kingdom.[15] The coronavirus (COVID-19) pandemic is likely to further amplify economic inequalities. Income inequality could increase as a result of higher unemployment and loss of income among younger workers, women, those in lower income and lower education groups and temporary workers.[16] Moreover, rising asset prices, such as those of stocks and real estate, together with changes in consumption and savings behaviour across different parts of the wealth distribution during the pandemic, may contribute to greater wealth inequality.[17]
Statistics
© European Central Bank, 2022
Postal address 60640 Frankfurt am Main, Germany
Telephone +49 69 1344 0
Website www.ecb.europa.eu
All rights reserved. Reproduction for educational and non-commercial purposes is permitted provided that the source is acknowledged.
This Bulletin was produced under the responsibility of the Executive Board of the ECB. Translations are prepared and published by the national central banks.
The cut-off date for the statistics included in this issue was 13 April 2022.
For specific terminology please refer to the ECB glossary (available in English only).
ISSN 2363-3417 (html)
ISSN 2363-3417 (pdf)
QB-BP-22-003-EN-Q (html)
QB-BP-22-003-EN-N (pdf)
See the box entitled “The heterogeneous economic impact of the pandemic across euro area countries”, Economic Bulletin, Issue 5, ECB, 2021.
See the box entitled “COVID-19 and the increase in household savings: an update”, Economic Bulletin, Issue 5, ECB, 2021.
For further information on the nature and purpose of these contacts, see the article entitled “The ECB’s dialogue with non-financial companies”, Economic Bulletin, Issue 1, ECB, 2021.
Total household savings go beyond changes in deposit holdings. This is because households typically save in a variety of ways, depositing money into a bank account or buying financial assets (i.e. stocks, mutual fund shares and bonds), real estate or other assets, such as non-financial business assets if households are active as sole proprietors.
In this context, liquid assets refer to the sum of deposits, bonds and listed equities. Across the wealth distribution, deposit flows represent about 80% of total flows in liquid assets for the bottom 50% of the distribution, while they represent about 70% for the next 40% and only 36% for the top 10%.
For an overview of the developments of total household savings and the drivers during the pandemic, see the box entitled “COVID-19 and the increase in household savings: precautionary or forced?”, Economic Bulletin, ECB, Issue 6, 2020, and the box entitled “COVID-19 and the increase in household savings: an update”, Economic Bulletin, ECB, Issue 5, 2021.
See, for instance, the article entitled “Energy prices and private consumption: what are the channels?” in this issue of the Economic Bulletin.
See, for instance, the article entitled “Economic inequality and citizens’ trust in the European Central Bank” in this issue of the Economic Bulletin.
The DWA are an experimental dataset that uses historical relationships between macroeconomic quarterly sectoral accounts aggregates and survey distributions to extrapolate from the net wealth distribution measured in the various waves of the Household Finance and Consumer Survey (HFCS). The DWA are under development and the first results used in this box are therefore provisional.
The four euro area countries with no statutory minimum wages are Italy, Cyprus, Austria and Finland.
Directive (EU) 2018/410 of the European Parliament and of the Council of 14 March 2018 amending Directive 2003/87/EC to enhance cost-effective emission reductions and low-carbon investments, and Decision (EU) 2015/1814 (OJ L 76, 19.3.2018, p. 3).
The Directive amended the Market Stability Reserve and increased the rate of reduction of the annual emissions cap from 1.74% to 2.2% for phase 4 of the ETS.
This box is based on extensive work related to the review of pandemic collateral easing measures. In addition to the authors mentioned above and staff of national central banks (NCBs), the following colleagues also commented and contributed: M.-A. Anghel, L. Bara de La Fuente, N. Bihrer, M. Blau, G. Camba-Méndez, S. Ciummo, T. Dzaja, B. Hartung, N. Luo, M. Micuch and P. Kusmierczyk.
See the press releases of 7 April 2020 and 22 April 2020 for the initial adoption of the package and the press release of 10 December 2020 for the extension of collateral easing measures until June 2022. The measures were described in the ECB blog post by Luis de Guindos and Isabel Schnabel, “Improving funding conditions for the real economy during the COVID-19 crisis: the ECB’s collateral easing measures”. Their relevance to supporting TLTRO III operations was highlighted in Box 1 entitled “TLTRO III and collateral easing measures” of the article entitled “TLTRO III and bank lending conditions”, Economic Bulletin, Issue 6, ECB, September 2021.
See, for example, Alvaredo, F., Chancel, L., Piketty, T., Saez, E. and Zucman, G., “Global Inequality Dynamics: New Findings from WID.world”, American Economic Review, Vol. 107, No 5, 2017, pp. 404-409; Blanchet, T., Chancel, L. and Gethin, A., “Why is Europe more equal than the United States?”, World Inequality Lab Working Papers, No 2020/19, 2020; Piketty, T. and Saez, E., “Inequality in the long run”, Science, Vol. 344, No 6186, 2014, pp. 838-843; Nolan, B. and Valenzuela, L., “Inequality and its discontents”, Oxford Review of Economic Policy, Vol. 35, No 3, 2019, pp. 396-430; and Zucman, G., “Global Wealth Inequality”, Annual Review of Economics, Vol. 11, No 1, 2019, pp. 109-138.
See, for example, the box entitled “COVID-19 and income inequality in the euro area”, Economic Bulletin, Issue 2, ECB, 2021; and the article entitled “The impact of the COVID-19 pandemic on the euro area labour market”, Economic Bulletin, Issue 8, ECB, 2020.
For more information, see also Schnabel, I., “Monetary policy and inequality”, speech at a virtual conference on “Diversity and Inclusion in Economics, Finance, and Central Banking”, 9 November 2021.