


A model-based assessment of the macroeconomic impact of the ECB’s monetary policy tightening since December 2021
Published as part of the ECB Economic Bulletin, Issue 3/2023.
The monetary policy normalisation that started in December 2021 has taken the ECB’s policy stance from a highly accommodative position into restrictive territory. In December 2021 the ECB announced that it would begin normalising its policy stance by slowing the pace of net asset purchases, with net purchases under the pandemic emergency purchase programme (PEPP) and the asset purchase programme (APP) eventually ending in March 2022 and June 2022 respectively.[1] The ECB’s interest rate guidance was revised in June 2022, and its key policy rates were increased by a total of 350 basis points between July 2022 and March 2023, rapidly tightening policy and ultimately taking rates into restrictive territory. While the speed and magnitude of this tightening is high from a historical perspective, monetary policy is transmitted to the economy with lags, implying that the full impact of the tightening will unfold over the next few years. This box uses a variety of empirical macroeconomic modelling frameworks to illustrate the impact on economic activity and inflation in the euro area.
Uncertainty about the impact of monetary policy on the economy can be addressed by drawing on a suite of models. This box presents details of a stylised exercise analysing the impact of policy tightening so far and illustrates the analytical challenges that surround such an assessment. There are two main challenges in assessing the impact of policy tightening. First, financial and macroeconomic variables are driven by a host of factors on both the demand side and the supply side. These factors need to be disentangled from the impact of monetary policy itself, calling for a model-based identification approach. And second, there is uncertainty regarding the transmission channels and lags of monetary policy, and it is therefore necessary to consider alternative methodologies with different transmission mechanisms in the interests of robustness. For these reasons, this assessment uses a suite of models: two structural DSGE models (NAWM II and MMR) and one large‑scale semi‑structural model (ECB-BASE).[2] This approach is in line with the conclusions of the ECB’s recent monetary policy strategy review, which emphasised the importance of robustness in carrying out model-based analyses within the Eurosystem.[3]
The assessment is carried out in two steps: first, by estimating the impact that monetary policy has on the yield curve, and second, by translating the impact on the yield curve into macroeconomic effects using macro models. The first step is to identify monetary policy-induced changes in short and long-term interest rates. The impact on short-term rates is calibrated on the basis of the upward shift observed in the forward curve for the euro short-term rate (€STR) at short to medium maturities since December 2021, which reflects both actual increases in policy rates and the anticipation of future increases. The impact on long-term rates is derived from the upward pressure on yields that is exerted by revisions to expected APP and PEPP holdings. In a second step, the policy-related effects on interest rates and the Eurosystem’s balance sheet are translated into macroeconomic effects using the suite of macro models, either directly or indirectly via the impact that balance sheet expectations have on long‑term rates.[4] In the DSGE models, the conditioning on the short-term interest rate is done through monetary policy shocks, which are partially anticipated in MMR and unexpected in NAWM II. In the ECB‑BASE model, short and long-term interest rates are assumed to be exogenous and the counterfactual is imposed as an alternative path relative to the baseline (i.e. the interest rate path expected in December 2021). In practice, market-based financial assumptions also change as an endogenous reaction to other drivers, such as energy prices. In order to compute the impact of monetary policy, this exercise quantifies the macroeconomic impact of policy had it not followed the historical regularities captured by market‑based financial assumptions. This counterfactual is computed using policy shocks. Sensitivity to these assumptions is explored in more detail later in the box, particularly as regards the role of the expectation formation process.
The results show that the policy tightening can be expected to exert substantial downward pressure on real activity and inflation over the period 2023-25. Since December 2021, short-term interest rates have increased by around 270 basis points on average over the projection horizon 2022‑25. Expectations for long-term interest rates, which account for anticipation, have increased by around 230 basis points over the same horizon (a significant percentage of which can be attributed to changes in APP and PEPP expectations, as Table A shows).[5] Short-term interest rate expectations began shifting upwards even before the first policy rate increase in July 2022 (Chart A), which shows the importance of accounting for policy expectations. The associated upward shift in the yield curve has an effect, in turn, on broader financing conditions and exerts a tangible impact on the economy. Averaging results across the three models, this assessment suggests that policy normalisation has exerted significant downward pressure on inflation and real GDP growth across the whole of the projection horizon (Chart B). Most of the impact on inflation is expected to be seen in the period from 2023 onward, with that impact peaking in 2024. The tightening of policy is estimated to have lowered inflation by around 50 basis points in 2022, while the downward impact on inflation is expected to average around 2 percentage points over the period 2023-25, with estimates differing substantially across the three models. The transmission to economic activity is faster, with the impact on GDP growth expected to peak in 2023 and a downward impact of 2 percentage points on average over the period 2022-25.[6] [7]
Table A
Impact on short and long-term rate assumptions over the horizon 2022-25
(basis points)
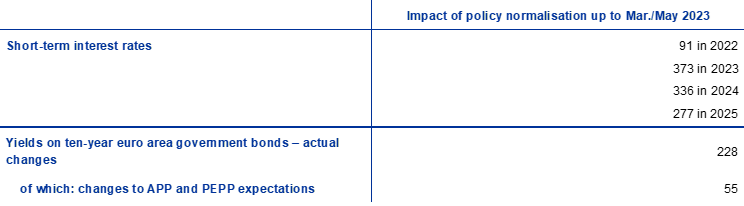
Sources: Bloomberg, Refinitiv and ECB calculations.
Notes: The impact on short-term interest rates is calculated as the average difference between the short-term interest rates expected in the December 2021 and March 2023 MPE projections. The short-term interest rate curve is based on monetary policy-dated €STR forward contracts. The impact on ten-year yields is computed on the basis of changes to balance sheet expectations in the Survey of Monetary Analysts. The estimated impact on ten-year yields in the period from October 2021 (in order to account for anticipation) to May 2023 is around 65 basis points, while the average impact on expected ten-year yields over the period from 2022 to 2025 is 55 basis points. The impact is computed as the average across two models: a term-structure model (see Eser et al., op. cit.) and a BVAR model (see Rostagno et al., op. cit.).
Chart A
Impact on the monetary policy-dated €STR forward curve
(percentages per annum)
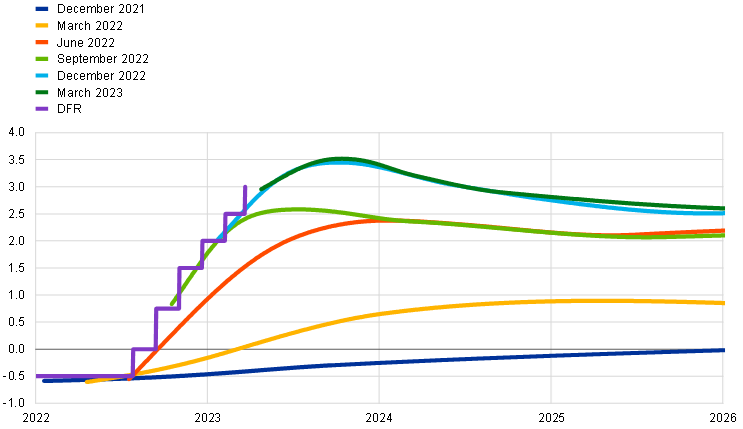
Sources: Bloomberg and ECB calculations.
Notes: This chart shows, for each Governing Council monetary policy meeting with updated economic projections, the €STR forward curve on the first available day of the maintenance period that follows the meeting. The purple line represents realised values for the deposit facility rate (DFR), with data being adjusted for the DFR space by applying a spread of 8 basis points. The cut-off dates for the data used for the various lines are based on the following final cut-off dates for projections: 23 November 2021 (December 2021), 28 February 2022 (March 2022), 17 May 2022 (June 2022), 22 August 2022 (September 2022), 25 November 2022 (December 2022) and 15 February 2023 (March 2023).
Chart B
Impact of monetary policy tightening according to a suite of models
(percentage points)
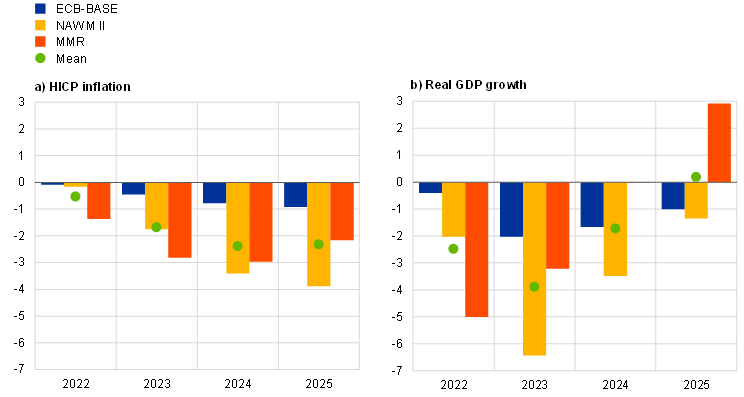
Source: ECB calculations based on the NAWM II model (see Coenen et al., op. cit.), the MMR model (see Mazelis et al., op. cit.) and the ECB-BASE model (see Angelini et al., op. cit.).
Notes: This chart reports the results of a simulation involving changes to short-term rate expectations between December 2021 and March 2023 and changes to expectations regarding the ECB’s balance sheet between October 2021 and May 2023. The reported values refer to year-on-year growth rates. “Mean” denotes the average across the three models.
The impact estimates are surrounded by significant uncertainty, reflecting differences in transmission channels across models, with the structural models displaying a stronger impact. The structural models are specifically designed for the purpose of deriving conditional correlations between identified monetary policy impulses and macroeconomic aggregates, while semi-structural models seek to achieve a satisfactory combination of identification and empirical fit. This can result in monetary policy tightening having a more limited impact, as the estimated impact based on such models probably conflates the effect of a “pure” monetary policy impulse with that of other non-policy drivers. In practice, there is a trade-off between the scale of the model and the number of drivers that can be identified, as abstracting from many of the cross-equation restrictions required for full structural identification allows a richer model structure (e.g. as regards consumption). In the DSGE models used for the simulations, consumption is closely linked to expected future short-term rates via the Euler equation. On the other hand, the richer modelling of consumption in the ECB-BASE model includes individual income risk and differing propensities to consume out of different income sources.[8] This implies that the dynamics of consumption are less dependent on expected short-term interest rates but better capture the observed persistence in consumption.
The larger impact of monetary policy in structural models also reflects stronger expectation channels. In particular, while structural models are forward‑looking, semi-structural models typically involve more backward-looking expectations, resulting in slower propagation of shocks.[9] Similarly, in DSGE models, an endogenous fall in inflation expectations in response to a rate rise leads to a further increase in real rates, thereby creating a reinforcing loop – a channel that is not present in semi-structural models, as these do not directly incorporate expectations of future inflation. This role played by expectations can be illustrated using sensitivity analysis. If it is assumed that agents do not anticipate policy decisions, the impact that the normalisation of policy has on inflation is halved in the MMR model (pale red bars in Chart C), bringing its estimates closer to those derived from the ECB-BASE model. Likewise, in the case of the NAWM II model, if the forward-looking expectations mechanism is modified to incorporate an adaptive learning scheme that makes households and firms’ expectations more backward‑looking, the impact that monetary policy has on inflation is mitigated (pale yellow bars in Chart C). Conversely, using more reactive expectations and strengthening the impact that asset prices have on the valuation of wealth in the ECB-BASE model (pale blue bars in Chart C) brings its responses closer to those produced by the two DSGE models under a tempered expectations channel.[10]
Chart C
Sensitivity to the expectation formation process
(percentage points)
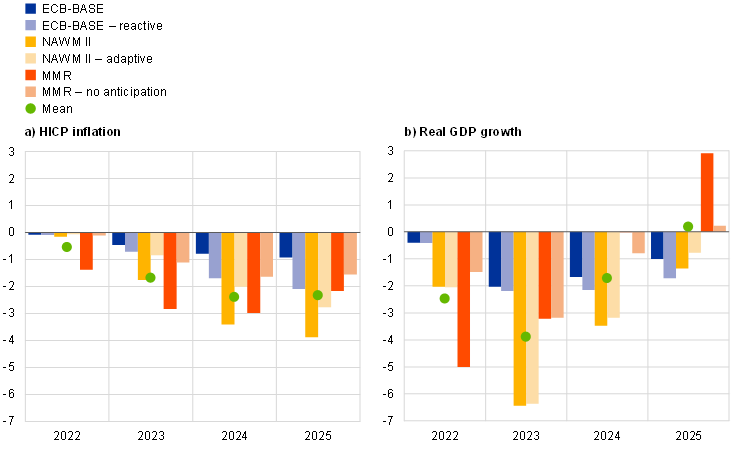
Source: ECB calculations based on the NAWM II, MMR and ECB-BASE models.
Notes: The reported values refer to year-on-year growth rates. “Mean” denotes the average across all three models using the standard expectations channel in each model, and is therefore equivalent to the mean in Chart B.
This model-based assessment can serve as a useful cross-check, but is no substitute for a data-dependent approach to the setting of policy and the monitoring of transmission over time. First, the current situation is characterised by exceptionally high levels of uncertainty about economic relations. The pandemic, the large energy shock, the fiscal responses to those two events and the unprecedented pace of the tightening of monetary policy are all likely to affect economic decisions and structures in ways that go beyond the historical regularities captured by available models. This uncertainty is compounded by the fact that macroeconomic outcomes reflect shocks from many different sources beyond monetary policy, and those shocks will propagate differently across the various models. Second, these estimates do not capture the prevention of any adverse non‑linear dynamics that might have materialised in the absence of monetary policy tightening, such as a risk of destabilising inflation expectations. Finally, the results point to considerable lags in the transmission of monetary policy to the economy. For all those reasons, while this model-based assessment can serve as a complementary cross-check, it is necessary to monitor indicators such as financial and credit variables, as well as leading indicators of activity and prices, to establish a timely and comprehensive medium-term inflation outlook.
Furthermore, in December 2022 the ECB announced its intention to reduce the size of the APP portfolio by not reinvesting some of the principal payments from maturing securities. The APP portfolio will decline by €15 billion per month on average until the end of June 2023, and the Governing Council expects to discontinue all reinvestments thereafter.
For details of the NAWM II model, see Coenen, G., Karadi, P., Schmidt, S. and Warne, A., “The New Area-Wide Model II: an extended version of the ECB’s micro-founded model for forecasting and policy analysis with a financial sector”, Working Paper Series, No 2200, ECB, November 2018 (revised December 2019); for information on the MMR model, see Mazelis, F., Motto, R. and Ristiniemi, A., “Monetary policy strategies for the euro area: optimal rules in the presence of the ELB”, Working Paper Series, No 2797, ECB, March 2023; for details of the ECB-BASE model, see Angelini, E., Bokan, N., Christoffel, K., Ciccarelli, M. and Zimic, S., “Introducing ECB-BASE: The blueprint of the new ECB semi-structural model for the euro area”, Working Paper Series, No 2315, ECB, September 2019. NAWM II is a fully micro-founded small open economy model with (i) an explicit intertemporal substitution channel, (ii) a banking sector with a financial accelerator mechanism, (iii) central bank asset purchases, (iv) interest rate-sensitive investment decisions and (v) a foreign economy block allowing for international spillovers. The MMR model is a closed economy DSGE model with (i) optimising households and firms, (ii) central bank asset purchases and (iii) a time-varying neutral interest rate. It also estimates the degree of attention to central bank communication, thereby helping to address the forward guidance puzzle encountered in standard DSGE models. ECB-BASE is a large semi-structural model designed to combine theoretical considerations with a good empirical fit and a comprehensive structure, reflecting its role as a workhorse model in the context of projections and policy simulations at the ECB. Its monetary policy transmission mechanism is stronger than in standard semi‑structural models, thanks to the explicit (VAR-based) role played by expectations and a multitude of financial channels.
See “Review of macroeconomic modelling in the Eurosystem: current practices and scope for improvement”, Occasional Paper Series, No 267, ECB, September 2021.
Both structural models capture asset purchases directly via the inclusion of the central bank’s balance sheet. In the ECB-BASE model, asset purchases are captured indirectly via their effect on long-term rates, so the impact of monetary policy normalisation is computed using both short and long-term interest rates.
The impact that monetary policy has on short-term rates is computed on the basis of the upward shift observed in the forward curve for the €STR over the 2022-25 horizon. As increases in policy rates are typically transmitted one-to-one to the overnight rate, it is assumed that all changes in the €STR forward curve can be attributed to the tightening of policy. For long-term rates, the tightening impact stems from changes in expectations regarding balance sheet reduction. The impact of the latter is computed by mapping changes in balance sheet expectations derived from the Survey of Monetary Analysts into yields using an average across two models: (i) a term-structure model with a quantity variable and duration risk (see Eser, F., Lemke, W., Nyholm, K., Radde, S. and Vladu, A., “Tracing the impact of the ECB’s asset purchase programme on the yield curve”, Working Paper Series, No 2293, ECB, July 2019); and (ii) a large BVAR model where the impact of policy is identified using a dense event study (see Rostagno, M., Altavilla, C., Carboni, G., Lemke, W., Motto, R. and Saint Guilhem, A., “Combining negative rates, forward guidance and asset purchases: identification and impacts of the ECB’s unconventional policies”, Working Paper Series, No 2564, ECB, June 2021). The exchange rate is allowed to move endogenously.
In all models, monetary policy is neutral in the long run. This implies that GDP growth will eventually turn positive after the initial negative impact. This happens earlier with the MMR model, as the exercise is conducted with expected shocks, hence the impact of policy is more frontloaded. This is illustrated in Chart C, which shows that, when shocks are unexpected, the profile of GDP growth is more similar to those of the other models.
The May 2023 median expectations for the ECB’s balance sheet tightening are broadly consistent with the discontinuation of reinvestments under the APP programme as of July 2023. The tightening of balance sheet expectations is expected, on its own, to lower annual inflation by slightly more than 10 basis points in each year over the period 2023-25 and reduce GDP growth by the same amount over the period 2022-25.
In contrast, there are fewer differences between ECB-BASE and the two DSGE models in terms of the modelling of the investment sector, with ECB-BASE featuring a financial accelerator mechanism.
In the ECB-BASE model, expectations are modelled using VARs.
More reactive expectations are obtained by increasing the elasticity of short-term inflation expectations relative to movements in interest rates (whereby greater elasticity is obtained by estimating the underlying VAR used for expectation formation using a different sample and an OLS estimator) and by allowing actual inflation developments to have a stronger effect on the perceived long-term inflation target. The impact that asset prices have on the valuation of wealth is strengthened by endogenising house prices and by increasing the elasticity of the revaluation term in financial wealth relative to movements in returns on financial assets.