


Published as part of the ECB Economic Bulletin, Issue 3/2023.
Modest global demand, supply bottlenecks and surging energy costs have weighed on euro area export performance in the past year. While euro area exports rebounded sharply immediately after the coronavirus (COVID-19) pandemic, the past two years have seen relatively anaemic euro area export growth. The euro area export weakness was partly a reflection of subdued global trade dynamics as firms struggled with supply chain disruptions. However, the pick-up in the summer of last year notwithstanding, euro area exports have tended to lag the global recovery in trade, with euro area exporters failing to recover market shares lost during the pandemic (Chart A). The recent easing of supply bottlenecks should help bolster global trade prospects in the short term, including for the euro area. However, exporting firms, particularly those in the euro area, also face the challenges of still elevated energy costs. This box examines empirical evidence on the role of the energy price shock in affecting price competitiveness and euro area export performance.
Chart A
Extra-euro area goods exports and global imports
(3-month-on-3-month percentage growth)

Sources: Eurostat and CPB Netherlands Bureau for Economic Policy Analysis.
Energy supply constraints affect euro area exports through two main channels. First, higher global energy prices tend to dampen global demand, as income is redistributed from energy-consuming countries to energy-producing ones, which typically have a lower marginal propensity to spend. Second, because energy costs are a critical component of production costs, higher energy prices can also undermine the ability to compete in global markets. That has been particularly relevant recently because the recent energy shock has affected the euro area disproportionately. While global energy prices rose sharply in 2021 and 2022, euro area energy prices rose substantially more. For example, in 2022 wholesale gas prices in the euro area were on average 13 times higher than in 2020, while those in the United States and Asia were 3.5 and 9 times higher than their respective 2020 levels.[1]
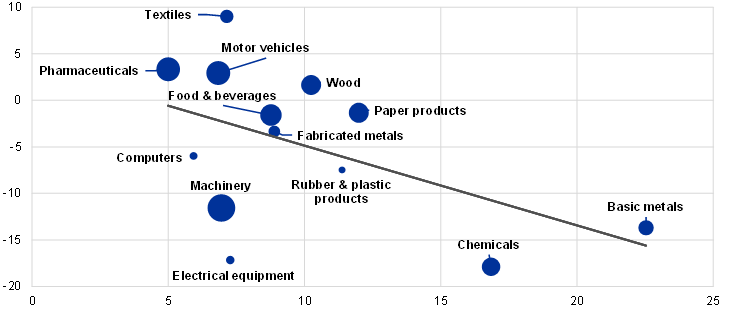
Empirical evidence suggests that the energy price shock has dampened euro area exports over the past year. A historical shock decomposition derived from a structural vector autoregression (SVAR) for aggregate extra-euro area goods exports shows that the chief drivers of export dynamics in the past year have been shifts in global demand conditions and the effects of supply bottlenecks (Chart B). The energy supply shock has played a less significant role in dampening export growth, lowering export growth by about 0.6 percentage points on average over the past year. As this shock is identified through variations in global oil prices and production – it does not fully capture the effect of the energy crisis evident in the sharp increases in gas prices following Russia’s invasion of Ukraine.[2] Indeed, cross-sectional analysis shows that euro area exports have decreased strongly in high energy-intensive sectors over the past year (Chart C). The contraction in exports was most evident for the basic metal and chemical industries, which are highly energy-intensive and saw contractions of 18% and 14% respectively in the fourth quarter of 2022.[3]
Chart B
Historical decomposition of extra-euro area goods export volumes using a SVAR model
(3-month moving average of year-on-year percentage changes, percentage point contributions)

Sources: Eurostat, Organisation for Economic Co-operation and Development (OECD), CPB, US Energy Information Administration, Federal Reserve Bank of New York and ECB calculations.
Notes: The SVAR model is based on global and euro area data from January 2003 to January 2023. The assumed sign restrictions on impact are: demand shocks imply Brent (+), oil production (+), world imports (+), world consumer prices index (CPI) (+), supply chain pressure (+), euro area exports (+); bottleneck shocks imply world imports (-), world CPI (+), supply chain pressure (+), euro area exports (-); energy supply shocks imply Brent (+), oil production (-), world real imports (-), world CPI (+), supply chain pressure (0), euro area exports (-).
Chart C
Energy intensity and extra-euro area export growth
(x-axis: energy intensity, percentages; y-axis: year-on-year growth in Q4 2022, percentages)
Sources: Eurostat, OECD Trade in Value Added (TiVA) database and ECB staff calculations.
Notes: Energy intensity is calculated as energy input as a percentage of total output. Data for energy inputs refer to 2018. Extra-euro area export growth for each sector refers to quantities. Bubble sizes refer to the share of each sector in extra-euro area export values.
Indicators reflecting producer prices point to a deterioration in export price competitiveness. Measures of the real effective exchange rate – based on the GDP deflator or unit labour costs (ULC) – suggest that euro area price competitiveness improved in 2021 and in the first part of 2022, before the recent appreciation of the euro partially unwound this effect (Chart D). Several factors explain these developments: (i) foreign exporters competing in the same markets also witnessed an increase in input costs as raw material and energy prices surged globally; (ii) other production costs (compensation of labour and capital) have remained contained relative to competitors; and (iii) significant depreciation of the euro at the start of the energy crisis bolstered euro area price competitiveness (Chart D, green line).[4] However, the producer price index (PPI)-based measure, which better reflects relative price pressures for tradeable goods, suggests a bigger hit to euro area competitiveness. During 2022 the gains in competitiveness from the depreciation of the euro were offset by relative PPI price increases, suggesting a more pervasive role of the energy price shock for the euro area than for its competitors.
Chart D
Effective exchange rate of the euro
(index: March 2019=100)

Sources: ECB and ECB staff calculations.
Notes: REER and NEER refer to the real/nominal effective exchange rate of the euro against the currencies of 18 of the euro area’s most important trading partners. A positive (negative) change corresponds to an appreciation (depreciation) of the euro.
The medium-term outlook for competitiveness may be less benign. At the peak of the recent energy crisis, gas prices increased more in the euro area than in the United States or Asia. Despite the fall in energy prices (particularly gas prices) since the summer of 2022, energy prices remain elevated relative to pre-pandemic levels (TTF gas prices, the reference series used for the euro area, are currently three times higher, while the US benchmark is on a par with its December 2019 levels). Moreover, the euro area still faces significant challenges related to energy supply. While the near-term picture is relatively benign following a mild winter, the euro area still needs to find a replacement for Russian gas supplies on a sustained basis over the medium term. Alternative sources could imply structurally higher prices (gas futures for 2025 are three times higher in the euro area than the equivalent in the United States) and more volatile import prices. At the same time, in the medium term the euro area also needs to factor in the potential costs of the necessary green energy transition, which in Europe could amount to 6.5% of GDP between 2021 and 2050 – the highest spending among advanced economies.[5] These investments are likely to bring efficiency gains and lead to positive effects over the longer term, including via a substantial decrease in energy costs.[6] However, during the transition phase, an increase in energy input costs would entail higher production costs, which could weaken euro area price competitiveness in the medium term, as recent developments in PPI-based real effective exchange rate measures suggest.
The benchmark series used are Natural Gas at the Title Transfer Facility (TTF) Virtual Trading Point for the euro area, the Henry Hub Natural Gas Spot Price for the United States and the Japan Korea Marker (JKM) spot price index for liquified natural gas (LNG) for Asia.
We obtain similar results using a synthetic energy price index for euro area oil and gas prices. With this alternative identification, bottleneck shocks are distinguished from energy supply shocks by assuming a positive effect on the ratio of euro area industrial production in energy intensive sectors to that in non-energy intensive sectors for the former and a negative sign for the latter. According to this specification, the energy supply shock has lowered export growth by about 0.8 percentage points on average over the past year.
In some industries the energy shock may have exacerbated ongoing longer-term trends. Moreover, empirical evidence shows that in energy-intensive sectors imports substituted production as domestic energy prices were higher. See the box entitled “How have higher energy prices affected industrial production and imports?”, Economic Bulletin, Issue 1, ECB, 2023.
In relation to other production costs for competitors, see the box entitled “Inflation developments in the euro area and the United States”, Economic Bulletin, Issue 8, ECB, 2022.
Estimation based on a Net Zero 2050 scenario and referring to spending on physical assets for energy and land-use systems. See “The net-zero transition: What it would cost, what it could bring”, McKinsey Global Institute, 2022. Estimations vary according to the scenario (Paris Agreement benchmark or Net Zero 2050 scenario), underlying assumptions and the way costs are defined. The European Commission estimates that average annual investment needs in the energy system and for transport in the EU amount to €1.24 trillion at 2022 prices (see “Investment needs assessment and funding availabilities to strengthen EU’s Net-Zero technology manufacturing capacity”, Commission Staff Working Document, European Commission, March 2023).
For an impact assessment, see “Stepping up Europe’s 2030 climate ambition – Investing in a climate-neutral future for the benefit of our people”, COM(2020) 562 final, European Commission, 17 September 2020.