
What is driving the recent surge in shipping costs?
Published as part of the ECB Economic Bulletin, Issue 3/2021.
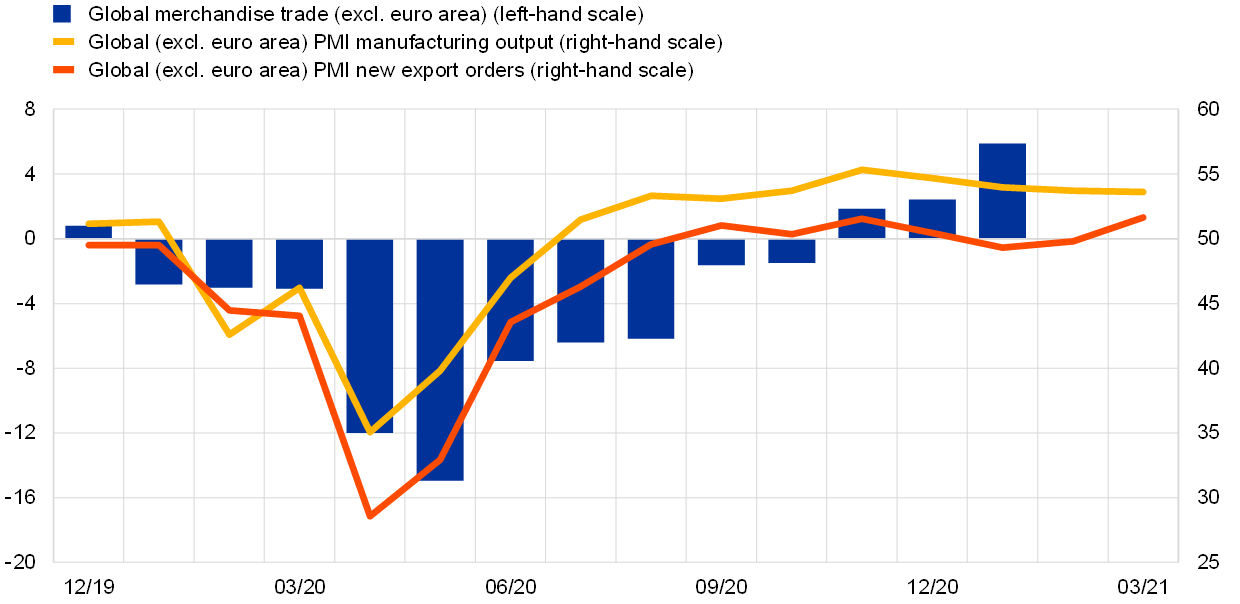
In the second half of 2020 global economic activity and trade staged a sharp rebound driven mainly by the manufacturing sector, while services sector activity was and has remained subdued. In the third quarter of 2020 global economic activity recovered swiftly as a result of the easing of the pandemic and associated containment measures as well as the significant policy support deployed at the peak of the crisis. Despite a slowdown in the last quarter of the year, reflecting a worsening of the pandemic, the pace of the global economic recovery in the second half of 2020 was overall stronger than initially estimated (ECB 2021, IMF 2021).[1] It was driven to a significant extent by the manufacturing sector (Chart A, upper panel), as production activities restarted and the demand for goods recovered. At the same time the services sector, and especially the most contact-intensive activities, lagged behind owing to continued social distancing and some remaining limitations. These also hit the travel and tourism sectors particularly hard. Following the collapse in global trade in the first half of 2020 (ECB 2020), global merchandise imports recovered, and by November 2020 they had reached their pre-crisis level again. [2] However, the recovery has progressed at different speeds across countries, with China – the first country to bring the virus under control – already returning to its pre-crisis level in June 2020 (Chart A, lower panel). It was only towards the end of the year that the recovery in trade started to spread to other key global economies.
Chart A
Developments in global economic activity and trade
Global merchandise trade and PMI indices
(left-hand scale year-on-year, percentage changes; right-hand scale diffusion indices)
Global merchandise trade and country contributions
(left-hand scale index, December 2019 = 100; right-hand scale contributions)

Sources: Markit, CPB and ECB calculations.
Notes: The global aggregate excludes the euro area. The latest observations are for March 2021 (PMI) and January 2021 (global merchandise trade).
The sharp rebound in global manufacturing activity caused a strong rise in international orders and resulted in some supply bottlenecks. Supply frictions are evidenced by rising supplier delivery times, which in turn are reflected in higher container shipping costs and, more generally, in higher input prices. In particular, the Global Purchasing Managers’ Indices (PMIs) for different manufacturing sub-sectors show how the sharp rebound in new orders for inputs of production since the trough in the second quarter of 2020 has been accompanied by a strong rise in supplier delivery times and an increase in input price pressures (Chart B). The sectors experiencing stronger disruptions in supply chains are basic materials, machinery and equipment, and cars. A particularly severe shortage in the supply of semiconductors is causing delays in car production globally.[3]
Chart B
Supplier delivery times and input prices
Global PMI Indices (diffusion indices)
(y-axis – PMI suppliers’ delivery times (reversed); x-axis – PMI new export orders, change between February 2021 and Q2 2020)
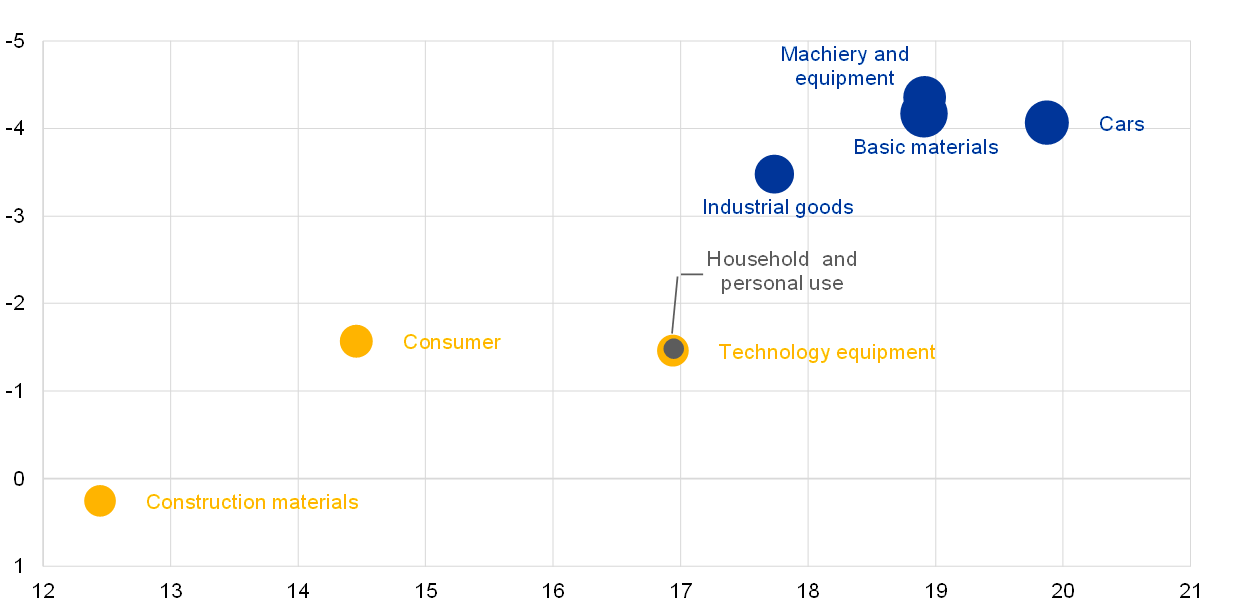
Sources: IHS Markit, Haver analytics and ECB staff calculations.
Notes: The size of the bubbles is proportional to the change in the PMI index for input prices between February 2021 and Q2 2020. Grey dots reflect increases in the PMI index for input prices below 10, yellow dots reflect increases between 10 and 15 and blue dots reflect increases in the PMI index greater than 15.
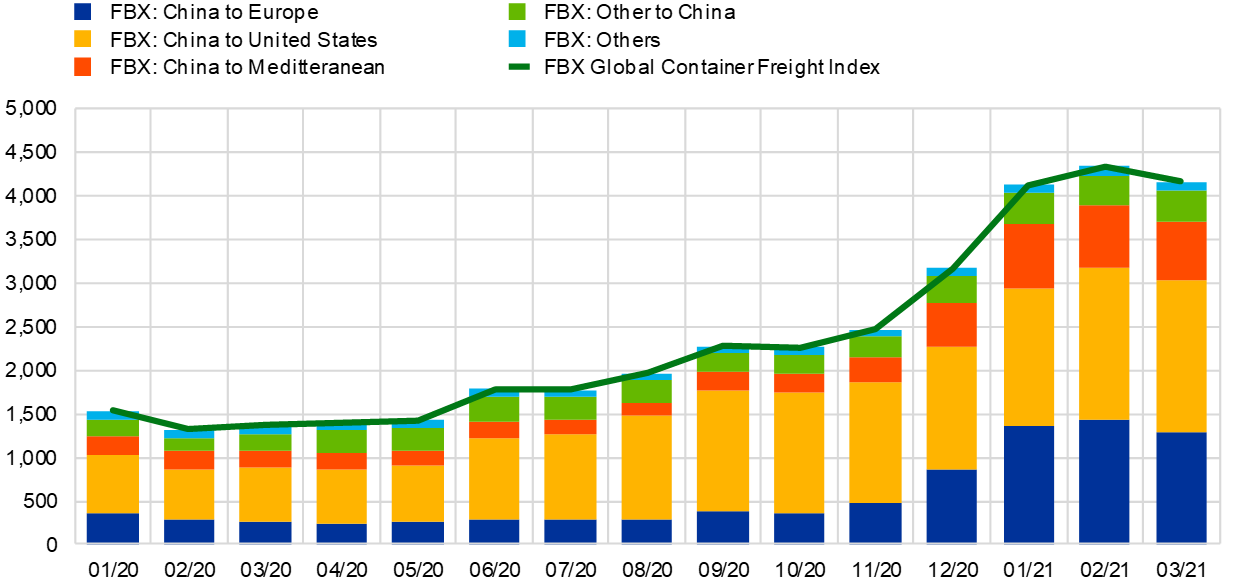
Rising ocean freight shipping costs are another sign of supply bottlenecks (Chart C, upper panel). Since the second half of 2020, global freight shipping costs have been on a steady recovery path from the lows reached in the midst of the pandemic. In recent months, however, they have reached levels not seen since after the Great Financial Crisis, while growth rates have risen above those observed since 2015. At the same time, transport costs on shipping routes from Asia and China to Europe and the Mediterranean, as well as the United States, have experienced a particularly sharp rise since the second half of the year. They appear to have peaked recently (Chart C, lower panel). Two factors are associated with the increase in shipping costs. On the one hand, the strong rise in demand for intermediate inputs on the back of stronger manufacturing activity raised the demand for Chinese exports and the demand for container shipments. At the same time, shortages of containers at Asian ports have exacerbated supply bottlenecks and further increased shipping costs as companies in Asia are reported to be paying premium rates to get containers back.[4] Reportedly, ports in Europe and the United States are congested amid logistics disruptions related to the coronavirus (COVID-19) pandemic and idle containers remain in several ports on the back of the uneven recovery of trade. Notably, available data point to a decrease in container ship traffic from important Asian ports, with the Asia-EU trade lane having experienced the biggest decrease (as indicated by the largest reduction in Chart D). In this context, the reliability of the schedules of global container services has declined to the lowest levels on record, according to new data from SeaIntelligence Consulting.[5] The rise in shipping costs has been further exacerbated by limited air freight capacity as international flight volumes have plunged due to travel restrictions and flight cancellations.
Chart C
Global and regional shipping costs
Global shipping costs
(year-on-year, percentage changes)
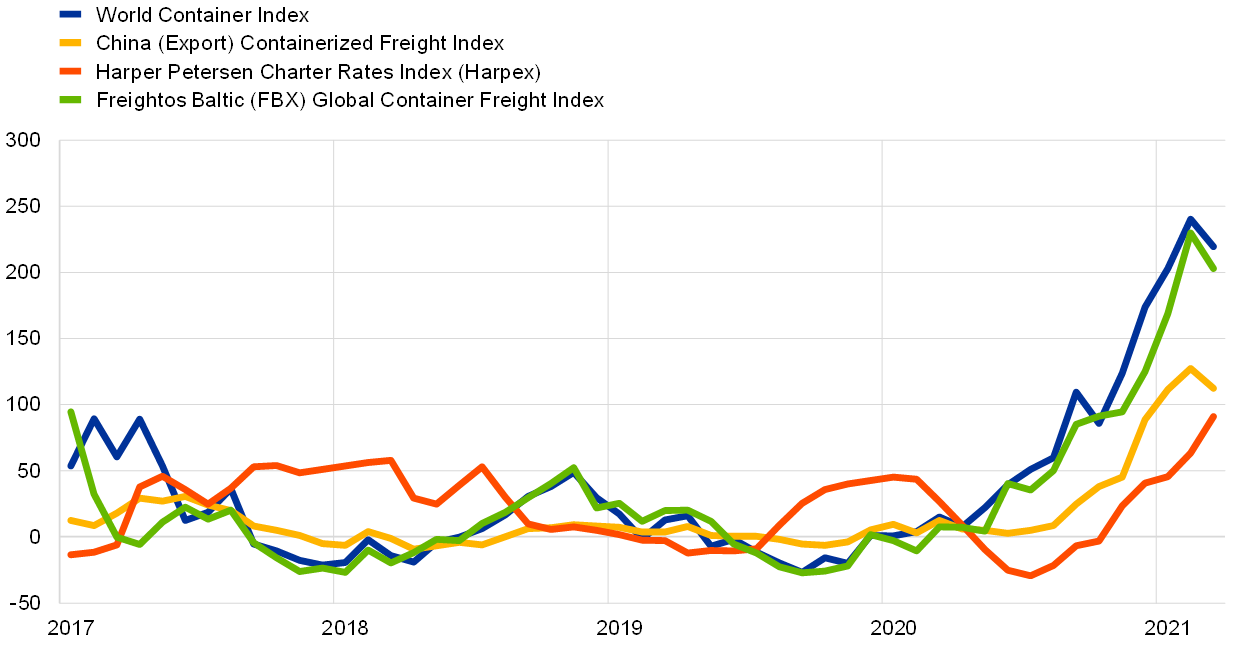
Freightos Baltic Index
(USD per forty-foot equivalent unit shipping container, contributions of sub-indices)
Sources: Bloomberg, Refinitiv, and ECB calculations.
Notes: The latest observations are for March 2021. The World Container Index (WCI) is a composite indicator of container freight rates for eight major trade lanes between Asia, Europe and North America. The China (Export) Containerized Freight Index (CCFI) is a composite indicator of container freight rates from all major ports in China. The Harpex is a composite indicator of weekly container shipping rate changes in the time charter market for eight different classes of container ships. The Freightos Baltic Global Container Freight Index (FBX) is a composite indicator of container freight spot rates across twelve major global trade lanes.
Chart D
Shipping capacity
(deadweight tons (DWT); 1 DWT=1,000 kilograms)
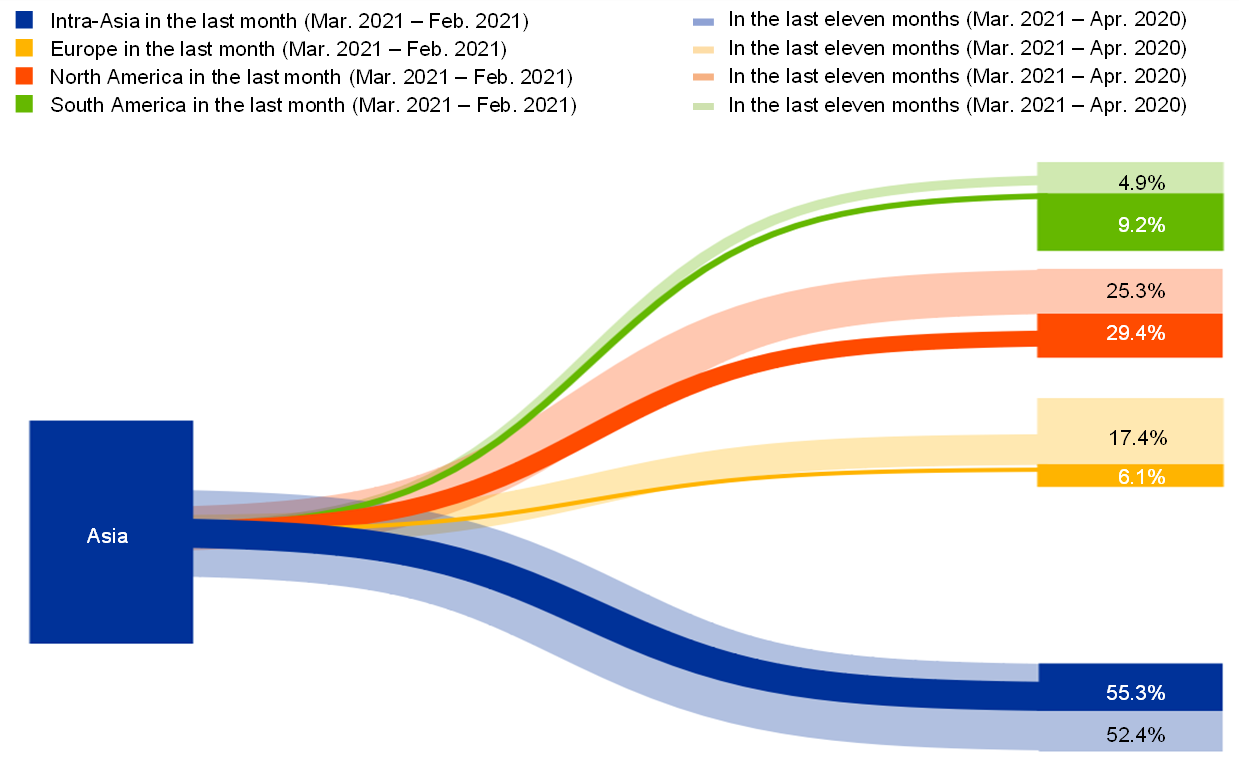
Sources: Bloomberg, IHS and ECB calculations.
Notes: Container ship vessels include container ro-ro cargo, container, deck cargo and general cargo vessels. Port of departure includes major Asian ports (Shanghai, Singapore, Shenzhen, Ningbo, Busan, Hong Kong and Klang). Port of destination, in addition to major Asian ports, includes major European ports (Rotterdam, Antwerp and Hamburg), major North American ports (Los Angeles, Long Beach and New York/New Jersey) and major South American ports (Santos, Colon and Cartagena). Shaded areas refer to the volume of traffic – when vessels are fully loaded – in April 2020, whereas the solid areas refer to the volume of traffic in February 2021. The thickness of edges is proportional to the aggregate deadweight tonnage (DWT) and percentages refer to the share of each destination out of total outbound DWT from Asia in April 2020 (shaded area) and February 2021 (solid areas) respectively.
The rise in global container shipping costs at the end of 2020 largely reflected stronger demand (Chart E). We use econometric analysis to disentangle the relative importance of the demand and supply forces.[6] The analysis suggests that at the start of 2020 supply constraints explained rising shipping costs, as containers were grounded as a consequence of the measures adopted to contain the spread of COVID-19. While such pressures persisted in the second quarter of the year, amid stringent containment measures globally, these were more than offset by the great trade collapse which led to a sharp decline in the Harpex. Shipping costs remained subdued in the third quarter as supply chain disruptions begun to subside, and global demand was on a path of gradual recovery and feeding only slowly into higher trade flows.[7] In the fourth quarter, however, the rise in shipping costs reflected above all the more vigorous recovery in global demand, and only to a smaller extent supply constraints in the shipping industry.[8] The surge in global oil and fuel prices further contributed to the spike in shipping costs.
Chart E
Historical decomposition of global shipping costs
(percentage point deviations from trend, contributions)
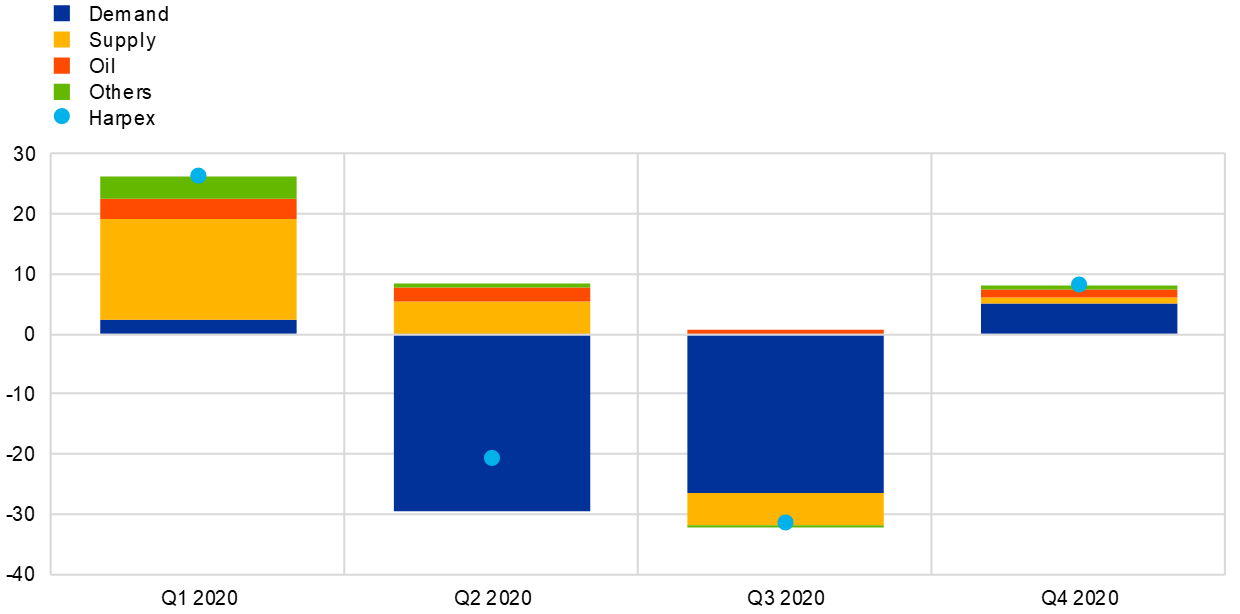
Sources: ECB staff calculations.
Notes: The decomposition is based on an SVAR model that employs: total shipping containers (measured in twenty-foot equivalent units (TEUs)), Harper Petersen Charter Rates Index (Harpex) of shipping costs and fuel prices. The model is identified using sign restrictions whereby a positive demand shock leads to an increase in both TEUs and the Harpex, while a positive supply shock leads to an increase in TEUs and a decline the Harpex (both have no contemporaneous impact on the oil price). An oil price shock leads to an increase in the oil prices and the Harpex, and a decline in TEUs. The model is estimated on monthly data (expressed in annual dynamics) from January 2013 to January 2021.
The surge in shipping costs raised the question to what extent these are passed on through the pricing chain. Importers commonly pass on part of rising transportation costs to consumers through higher prices, which could give rise to inflationary pressures. In order to gauge the potential magnitude of this effect, a structural vector autoregressive (SVAR) model has been estimated for the US economy, following Herriford et al. (2016).[9] The analysis suggests that after one year, the pass-through of shipping prices into US Personal Consumption Expenditures (PCE) inflation is rather limited.[10] Even a 50% annual increase in the Harpex – similar to that experienced leading up to January 2021 – could raise annual PCE inflation by up to 0.25 percentage points one year later. The size of this effect is also explained by the fact that international shipping costs make up only a relatively small share of the final cost of manufacturing output.[11] Overall, given that supply challenges are largely driven by transportation rather than production constraints, the rise in transportation costs is expected to have only a modest impact on global economic activity.[12]
As supply adjusts to higher demand freight costs might decline again. Overall, higher shipping costs and longer delivery times have caused temporary frictions in supply chains. However, as supply adjusts to increased demand, these bottlenecks should delay but not derail the global recovery.[13] At the same time, as lockdowns are lifted and consumers rebalance their spending towards services, some easing of the current supply bottlenecks should be expected, with knock-on effects on shipping costs.
- See Box 2 in “ECB Macroeconomic Staff Projections for the Euro area”, March 2021, and “World Economic Outlook Update”, January 2021.
- See Box 2 “The great trade collapse of 2020 and the amplification role of global value chains”, Economic Bulletin, Issue 5, ECB, July 2020.
- Supply shortages in the semiconductor industry are also attributed to the fact that while car production collapsed in the second quarter of 2020, demand for semiconductors remained relatively buoyant as the pandemic also led to a surge in demand for electronic equipment (e.g. computers). As a result, once the recovery in car production materialised and with little slack left in the semiconductor industry, shortages in production of semiconductors have started to emerge.
- Bloomberg, “Freight-Cost Pain Intensifies as Pandemic Rocks Ocean Shipping”, February 2021.
- The SeaIntel schedule reliability report covers 34 different trades and more than 60 lines. It reports that for the last six months reliability has been at its lowest levels since the index was introduced in 2011.
- The decomposition is based on a structural vector autoregressive model estimated over the period January 2013 to January 2021 that employs total containers (measured in twenty-foot equivalent units (TEUs)), using the Harper Petersen Charter Rates Index (Harpex) of shipping costs and fuel prices. The model is identified using sign restrictions whereby a positive demand shock leads to an increase in both TEUs and the Harpex, while a positive supply shock leads to an increase in TEUs and a decline in the Harpex (neither has any contemporaneous impact on the oil price). An oil price shock leads to an increase in the oil prices and the Harpex, and a decline in TEUs.
- The gradual recovery in demand is more visible in monthly data as it started picking up in September. However, on quarterly aggregates the contribution is still negative, albeit smaller than in the previous quarter. This also implies some delay in the response of global container shipping to reviving global demand.
- The model results for January 2021, the latest available observations, also confirm that the sharp rise experienced at the start of the year in the Harpex is consistent with the findings of Chart E. Namely there was a positive contribution from surging demand, followed by supply constraints and fuel price dynamics.
- Herriford, T., Johnson, E., Sly, N. and Lee Smith, A., "How Does a Rise in International Shipping Costs Affect U.S. Inflation?," Macro Bulletin, Federal Reserve Bank of Kansas City, pages 1-3, December 2016.
- The model uses the West Texas Intermediate (WTI) spot price, the Bureau of Labor Statistics’ (BLS) nonpetroleum import price index, the Harper Petersen Charter Rate Index (Harpex), and the core PCE price index. The model is estimated using monthly data from January 2001 to December 2020 and uses year-on-year growth rates and 12 lags for each variable. Shocks to the variables are identified using Choleski ordering. The BLS import price index omits shipping costs, which is consistent with import prices being ordered before shipping costs.
- According to the World Input-Output Tables, shipping costs make up less than 3% of the final cost of manufacturing output, implying that international shipping costs make up less than 1%.
- Goldman Sachs Report, “The Inflation Boost From Supply Chain Disruptions: Here Today, Gone in 2022”, March 2020.
- At the same time, the blockage of the Suez canal at the end of March will add to the short-term pressure on global shipping costs worldwide.