
Economic developments in the euro area and the United States in 2020
Published as part of the ECB Economic Bulletin, Issue 2/2021.
The coronavirus (COVID-19) pandemic has profoundly affected both Europe and the United States. Despite the pandemic reaching the United States later than the euro area and US population density being lower, the number of new COVID-19 cases has generally been higher in the United States than in the euro area, particularly so from mid-November 2020 to the end of February 2021. This higher incidence of infection in the United States may reflect the effectiveness of lockdown policies as measured by Goldman Sachs’ Effective Lockdown Index (ELI) (Chart A).[1] To the extent that the United States was subject to fewer restrictions than the euro area, the short-term responsiveness of the economy to policy stimulus was also likely greater. Against this background, the box compares economic developments in the euro area and the United States, focusing on 2020.
Chart A
COVID-19 infection in the euro area and the United States and the effectiveness of lockdown policies
(left-hand scale: new cases of infection per 1 million people, seven-day moving average; right-hand scale: Effective Lockdown Index)

Sources: ECB staff calculations, Oxford Economics and Goldman Sachs.
Notes: Goldman Sachs’ Effective Lockdown Index (ELI) is a combination of the Oxford COVID-19 Government Stringency Index and Google Mobility data. The latest observations are for 7 March 2021 for new COVID-19 cases and 26 February 2021 for the Effective Lockdown Index. Euro area(4) refers to the PPP-weighted indices for Germany, France, Italy and Spain.
In 2020 real GDP declined more in the euro area than in the United States, possibly related to several factors. While the more severe lockdowns in the euro area have likely been an important factor behind this stronger decline in GDP, differences may also relate, inter alia, to different economic structures, growth potential and policy responses, as well as the timing of the pandemic waves. The cumulative activity loss in the fourth quarter of 2020, compared with pre-crisis levels, amounted to 4.9% in the euro area and 2.4% in the United States (Chart B). In both regions, based on 2019 figures, about three-quarters of real value added was related to the adversely affected services sector, while only 15% and 11%, in the euro area and the United States respectively, stemmed from the manufacturing sector. Across demand components, private consumption contributed to GDP by broadly similar amounts in the two regions throughout the year, despite almost twice as much income support being provided in the United States (Chart C). This suggests that the smaller-sized but more targeted policies in the euro area (i.e. through short-time work schemes) might have been effective in cushioning an even larger fall in consumption. In the first two quarters of 2020, euro area firms postponed their investment plans to a larger extent than US firms, the euro area corporates appearing to be more sensitive to increasing uncertainty, falling demand and reduced profits. In contrast, the euro area saw a stronger cumulated rebound in investment in the second half of the year. Exports were more adversely affected in the euro area in the first half of 2020 owing to the economy’s exposure to China and Eastern Europe, while the United States was more negatively impacted by weak foreign demand from Canada and Latin America in the first half of the year, and from the euro area (and the rest of Europe) thereafter. Overall, the net trade contributions were more subdued in the United States than in the euro area.
Chart B
Real GDP and expenditure components for the euro area and the United States in 2020
(left-hand scale: quarterly percentage changes, percentage point contributions; right-hand scale: Q4 2019 = 100)
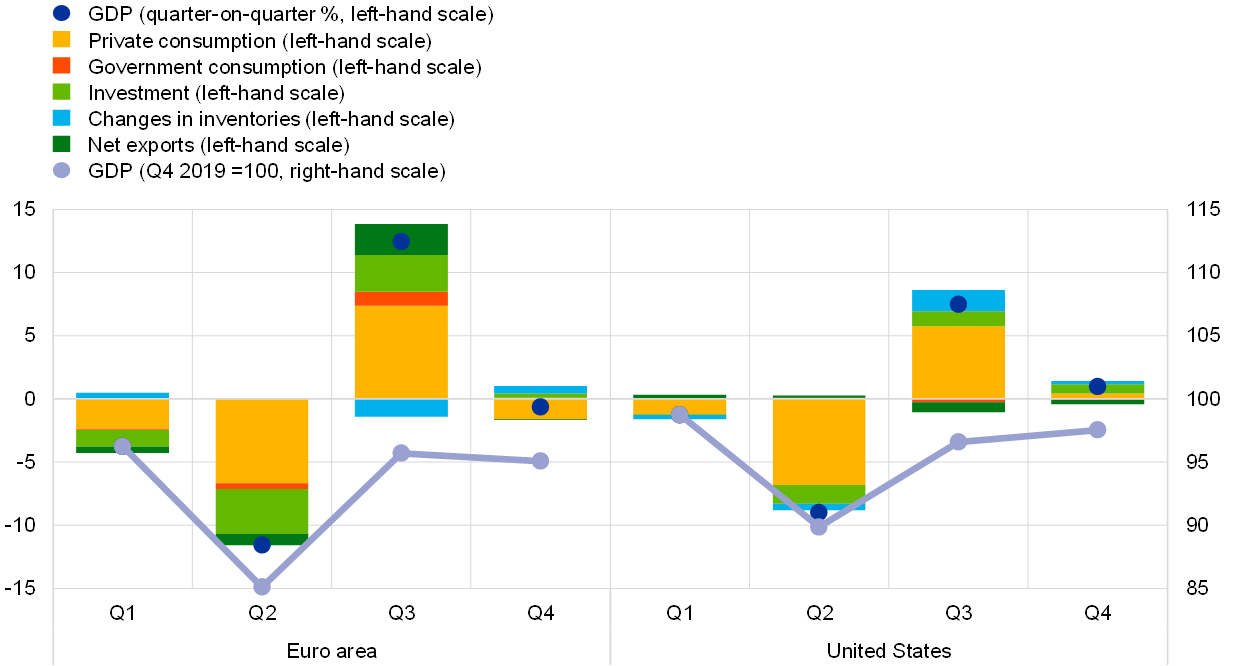
Sources: ECB staff calculations, Eurostat and US Bureau of Economic Analysis.
In 2020 the discretionary fiscal policy response to the COVID-19 crisis was very substantial in both the euro area and the United States, although the response in the latter was stronger (Chart C). In the euro area, the fiscal response to the pandemic consisted mainly of subsidies and transfers to firms and households, including job retention schemes.[2] Support to households and firms was also the main driver in US fiscal policy, particularly via direct transfers and unemployment benefits. Government consumption growth was higher in the United States than in the euro area and included a larger increase in health-related expenditure. Overall, while consistent data comparisons are difficult, the discretionary component of the fiscal response to the pandemic is estimated to have amounted to about 4¼% of GDP in the euro area and about 7¾% of GDP in the United States.
If the impact of automatic stabilisers is included, the total fiscal impulse in the euro area in 2020 comes closer to the equivalent impulse in the United States. Automatic stabilisers – proxied as the change in the cyclical component and other factors – are assessed to have been larger in the euro area.[3] Together with the discretionary measures, their fiscal impact amounts to close to 7% of GDP in the euro area compared with around 10% of GDP in the United States. This total fiscal impulse, or broadly speaking the budget balance cost of the pandemic, corresponds to the estimated change in the primary balance from 2019 to 2020. Caveats to these comparisons stem from the lack of fully consistent data, the timing of the forecast and the assessment methods used, as well as the unavailability of the final budget execution for 2020.
Chart C
Fiscal impulse in response to the pandemic in the euro area and the United States in 2020
(percentage point contributions to changes in the primary budget balance-to-GDP ratio)
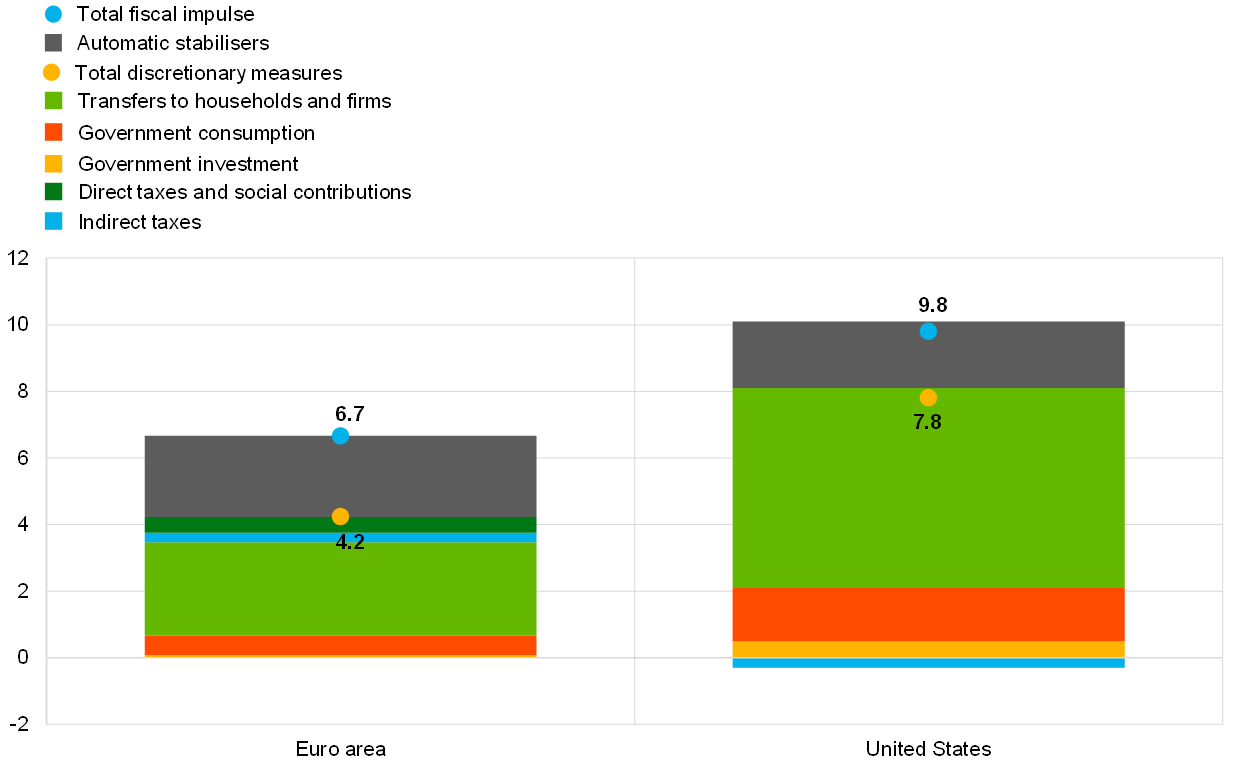
Sources: ECB staff calculations, March 2021 ECB staff macroeconomic projections for the euro area, Eurosystem staff estimates for the discretionary measures for the euro area, and IMF World Economic Outlook, October 2020 for the United States.
Notes: The total fiscal impulse refers to items with an impact on the budget balance, i.e. discretionary fiscal measures in response to the COVID-19 crisis and automatic stabilisers (proxied as the change in cyclical component and other factors). The total fiscal impulse broadly corresponds to the change in the general government primary balance from 2019 to 2020. For the euro area, for consistency across countries, parts of the job retention schemes (related to regular rules) in Germany and Belgium are included under discretionary measures.
Additional liquidity support was provided in both the euro area and the United States. Governments extended various forms of liquidity support to firms, which in the euro area consisted of guarantees for loans within a total envelope of 17% of the combined GDP of member countries (5.7% in the United States).[4] Other liquidity support measures in the euro area took the form of substantial tax deferral schemes and capital injections.
The monetary policy reaction was significant but stronger in the United States than in the euro area. In terms of the monetary policy reaction, while both the ECB and the US Federal Reserve System responded forcefully to the pandemic shock, the decline in the federal funds rate from 1.50-1.75% to 0-0.25% and the depreciation of the US dollar provided additional stimulus in the United States.
In the euro area the substantial increase in employed workers covered by job retention schemes left the unemployment rate broadly unchanged, while in the United States those layoffs that were temporary in nature caused the US unemployment rate to rise (Chart D).[5] The euro area would have recorded a much larger decline in employment had all workers subject to job retention schemes, as indicated by the yellow portion of the bars in Chart D, become unemployed or inactive. These schemes prevented unemployment and inactivity in the euro area from increasing by amounts comparable to those observed in the United States. By the end of the fourth quarter of 2020, employment in the euro area was 1.9% below its level for the fourth quarter of 2019, while in the United States it had fallen by 5.5% over the same period, as recourse to job retention schemes in the euro area increased again with new lockdowns and the US employment recovery slowed.[6] Recourse to job retention schemes in the euro area implied a stronger adjustment through average hours worked.
Chart D
Labour market developments in the euro area and the United States in 2020
(percentage point contributions to quarterly percentage changes in the working age population; percentages of labour force; quarterly percentage changes)

Sources: ECB staff calculations, Eurostat and US Bureau of Labor Statistics.
Notes: For the euro area, the blue portion of the bars does not include employed workers in job retention schemes. For the United States, the red portion of the bars does not include temporarily unemployed workers.
During the pandemic, the rates of both headline and underlying inflation have declined strongly in the euro area and the United States due to falling oil prices and a significant drop in demand. Underlying inflation in the United States fell more quickly in the first half of the year before increasing moderately thereafter, while in the euro area it declined moderately at first and was further subdued in the second half of the year, partly on account of the temporary VAT reduction in Germany (Chart E). In both the euro area and the United States, the decrease in underlying inflation is mainly attributed to items that are adversely impacted by social distancing. The most severely hit items include travel-related/transportation services and clothing and footwear/apparel.[7] While the inflationary contribution from other goods was positive in the United States, they were negative in the euro area (Chart E).[8] When correcting for the impact of the German VAT reduction, the fall in the Harmonised Index of Consumer Prices excluding energy and food (HICPX) in the euro area in the second half of 2020 would have been less pronounced but still significantly below pre-pandemic levels[9].
Chart E
Underlying inflation in the euro area and the United States in 2020
(annual percentage changes; percentage point contributions with respect to February 2020)

Sources: ECB staff calculations, Eurostat and US Bureau of Labor Statistics.
Notes: Shares in the underlying basket are given in brackets. For the euro area, HICPX stands for the HICP excluding energy and food. For the United States, the core CPI excludes food and energy prices. The latest observations are for December 2020.
In conclusion, more stringent pandemic-related measures and, to some extent, the lower level of fiscal support in the euro area than in the United States may have contributed to the different economic outcomes. Inflation was more subdued in the euro area, also on account of special factors like the temporary reduction in German VAT. Euro area policies appear to have been more supportive of employment, while in the United States the focus was on broader income policies.
- See Aron, J. and Muellbauer, J. “The US excess mortality rate from COVID-19 is substantially worse than Europe’s”, VoxEU, 29 September 2020.
- For a review of the support measures in the euro area countries, see the article entitled “The initial fiscal policy responses of euro area countries to the COVID-19 crisis”, Economic Bulletin, Issue 1, ECB, 2021.
- Automatic fiscal stabilisers refer to elements built into government revenues and expenditures that reduce fluctuations in economic activity without the need for discretionary government action. For more details on the size and effectiveness of automatic stabilisers in the euro area countries, including a comparison with the United States, see the article entitled “Automatic fiscal stabilisers in the euro area and the COVID-19 crisis”, Economic Bulletin, Issue 6, ECB, 2020. In practice, it is difficult to fully distinguish between automatic stabilisers and discretionary measures. Some measures can be considered quasi-automatic fiscal stabilisers, while other non-discretionary factors (such as revenue shortfalls or windfalls) are usually not captured in the cyclical component.
- The take-up rate of these guarantees has been rather low at the euro area aggregate.
- See the article entitled “The impact of the COVID-19 pandemic on the euro area labour market”, Economic Bulletin, Issue 8, ECB, 2020.
- Without temporary layoffs, as a proxy to euro area job retention schemes, the US unemployment rate falls below 5% over 2020.
- In the euro area, international travel accounts for most of the negative price impact from travel; see the box entitled “Prices for travel during the COVID-19 pandemic: is there commonality across countries and items?” Economic Bulletin, Issue 1, ECB, 2021.
- Part of the differences in inflation rates can potentially be explained by differences in the basket weights of items. However, weight differences are unlikely to explain fully the different developments since the onset of the pandemic: for example, other non-energy industrial goods (NEIG) inflation has been declining in Europe (also on account of the temporary German VAT reduction), whereas non-apparel goods inflation has contributed positively to US inflation in recent months. For the impact of changes in HICP weights in euro area inflation in 2021, see Box 6 in this issue of the Economic Bulletin.
- See, for example, Chart 8 in Economic Bulletin, Issue 1, ECB, 2021.