
Inflation measurement in times of economic distress
Published as part of the ECB Economic Bulletin, Issue 3/2020.
The Harmonised Index of Consumer Prices (HICP) is compiled on the basis of consumption weights that are kept constant within a given calendar year. This reflects the index’s purpose of measuring pure price changes without accounting for adjustments in consumption patterns. In times of sharp economic contraction such as those triggered now by the coronavirus (COVID-19) pandemic, such adjustments can occur over shorter horizons. This box explains inflation measurement issues both in the context of general economic downturns and in the current situation triggered by the COVID-19 shock.
The extent to which consumers will adjust their consumption patterns in response to the COVID-19 crisis is surrounded by considerable uncertainty. According to the ECB analysis, the euro area’s real GDP is expected to contract by between 5% and 12% in 2020, according to three assumed scenarios.[1] Policy responses will, to some extent, mitigate the recessionary effects on household disposable incomes. Nevertheless, the impact on income and the increased uncertainty will most likely trigger significant changes in household consumption patterns. Moreover, the direct effects of the lockdown measures have already had an impact on consumption patterns, with some goods and services becoming temporarily unavailable.
Households adjust consumption patterns in response to income and relative price shocks. For instance, when facing a reduction in disposable income, consumers tend to switch away from relatively more expensive to relatively less expensive goods or switch more strongly to “necessities”.[2] This substitution happens across items and categories (e.g. food versus recreation) as well as across varieties within items (different brands of the same product).[3] In extreme circumstances, consumers may even stop buying certain goods and services if their budget constraint becomes binding. However, the HICP does not reflect such imminent and possibly temporary shifts. Its inflation numbers therefore tend to be higher than the increase in total household expenditure inflation, as households practise substitution, opting for less expensive items.[4]
Chart A
Euro areaHICP weights adjustment during the 2008-2009 downturn

Sources: Eurostat and author’s calculations.
Note: The chart shows the HICP weights for each category at different points in time. For each category, the weights are normalised so that the inner circle represents the lowest (weight) value since 2001 and the outer ring represents the highest (weight) value since 2001.
Past episodes of economic distress provide evidence for changes in consumption weights. Taking the 2008 financial crisis as an example, Chart A shows the weights across main HICP categories at two different points in time, normalised so that the inner and outer circles capture the minimum and maximum values for each category in the sample in the period 2001 to 2020.[5] The recession episode saw lower expenditure shares for durable and semi-durable goods as well as housing and transport services, while shares for recreation and communication as well as energy, food and non-durable goods increased.[6]
At the current juncture, household consumption is affected by supply-side constraints, such as closure of retailers or scarcity of products on the shelves. High-frequency data suggests that the expenditure changes triggered by the current crisis might imply weights for individual categories outside the historical boundaries.[7] For example, as a result of the lockdown, consumption has moved away from energy, durable and semi-durable goods in favour of non-durable goods and food items. Potentially, these changes in consumption patterns are unprecedented but most likely also temporary. In Chart A, this could imply that the weight for food items based on consumption patterns during the lockdown could lie on the outer edge of the graph for most categories, as it would be at the upper boundary of its historical range. Similarly, the implied weight for recreation based on consumption data for services like restaurants, cafes and holiday items would lie at the inner edge of the historic weight developments. Having said this, the actual household consumption profile for the current year remains underpinned by a high degree of uncertainty.[8]
Chart B
Heterogeneity of euro area HICP items’ inflation rates
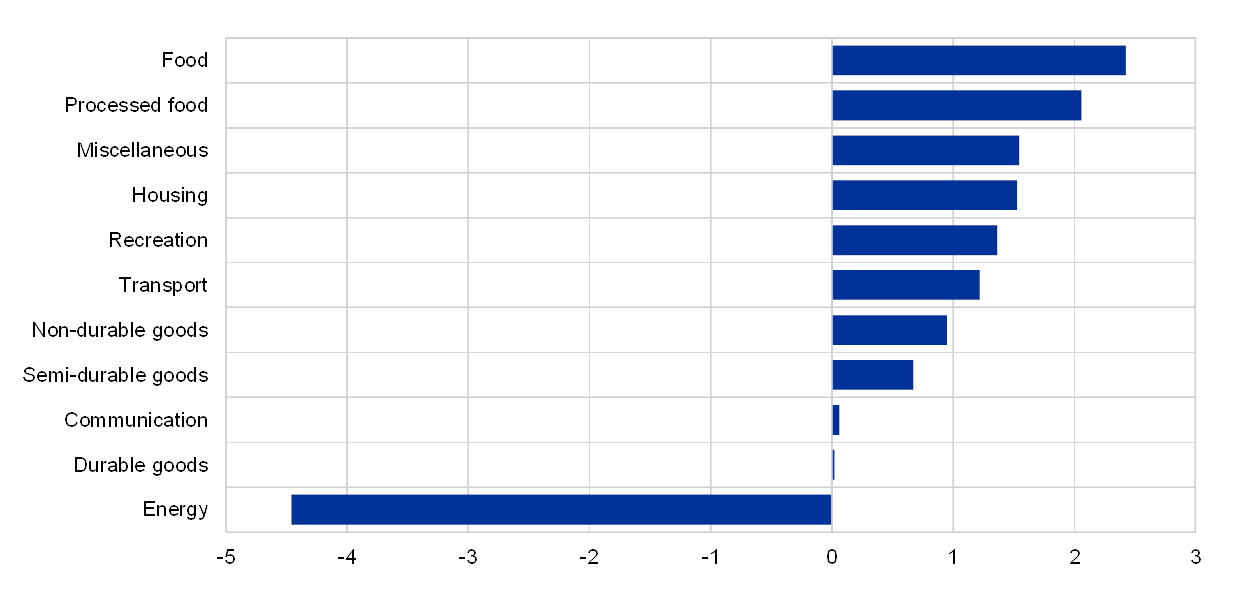
Sources: Eurostat and author’s calculations.
Note: The chart shows the latest available year-on-year inflation rate in each HICP subcategory. Data are until end-March.
When inflation rates differ across sub-categories, accounting for changes in consumption weights would play a role in the aggregated HICP inflation. Given that HICP sub-categories typically show different inflation rates, switching from HICP items with high inflation rates to those with low ones (or vice versa) would affect the profile of aggregate inflation rates if the switching were taken into account.[9] Chart B shows the heterogeneity in inflation rates in each sub-category in March 2020. Currently, the sub-category posting the highest inflation rate is food, with energy seeing the largest contraction. Additionally, prices will respond endogenously to demand conditions; therefore, switching to or from a category might increase or decrease its inflation rate, respectively. For example, in the current situation, an increased demand for food or pharmaceutical items might lead to an additional increase in their prices.
The restrictive measures implemented by European governments in reaction to COVID-19 – such as closures of shops or travel restrictions – also have a direct impact on price collection. The lockdown disrupted the collection of prices needed to compile the HICP in several countries, sometimes even when outlets remained open.[10] The HICP framework mandates the imputation of missing prices, which may be done either by referring to other price indices from the same or a higher product category (as far up as the all-items level) or by carrying forward prices that were actually collected in a previous month.[11] Seasonality in price indices may be imputed by referring to the seasonal profile from the previous year. Eurostat and the national statistical institutes provide metadata on the imputation methods applied and a list of the sub-indices affected. In terms of expenditure shares, 4.8% of price indices[12] for the March euro area HICP are labelled as being of “low reliability”. This percentage is expected to increase in April.[13] Metadata already published by Eurostat in the flash estimate of 30 April show that 35% of the prices of the euro area HICP were imputed.[14]
The imputations will increase the relative importance of the reliable indices in the HICP. Their weight is implicitly increased if missing items are imputed using either other single sub-indices or aggregates thereof. The HICP figures will therefore be driven by aggregate sub-indices for which there is a reasonable hypothesis that sales have continued and for which the underlying prices are largely based on actual transactions, like food (19.1%) and energy (9.8%), which together account for about 29% of the total HICP basket. These two categories accounted for most of the variance in the HICP in the last couple of years.[15] Other categories that could provide reliable information are communication services and rents as they may have been less affected by the lockdown. On top of these compilation issues, the possibility that some specific items show large price changes because of supply shortages cannot be ruled out. Overall, the impact of price collection issues on the HICP cannot be anticipated and upcoming HICP releases should be interpreted with caution.
The COVID-19-related economic developments pose challenges for inflation analysts. HICP aggregations will be harder to interpret in real time as the underlying consumption patterns are changing and individual price indices may suffer from measurement issues for some time. Against this backdrop, complementing the analysis of the HICP with a more in-depth examination of sub-indices’ price-level developments might be prudent. Analysts need to be aware of and track these (temporary) measurement issues.
- See the three scenarios for the impact of COVID-19 on real activity shown in the box entitled “Alternative scenarios for the impact from the COVID-19 pandemic on economic activity in the euro area” in this issue of the Economic Bulletin.
- Additionally, a reduction in income may increase the extent that a household switches within product categories, creating measurement challenges. For example, assuming that the price of product X (the higher-quality product) falls faster than that of product Y (the lower-quality product) would normally suggest a shift in expenditure shares towards product X. However, if income constraints become binding, then consumers may switch to products or items with lower prices (product Y) even if their relative price has increased. Such switches and substitution does not apply only to products but also to outlets.
- See for example studies based on micro-level and scanner data from Coibion, O., Gorodnichenko, Y. and Hong, G. H., “The Cyclicality of Sales, Regular and Effective Prices: Business Cycle and Policy Implications”, American Economic Review, Vol. 105, No 3, pp. 993-1029, March 2015, for a comparison on observed and effective prices in the US, or Kouvavas, O., “Trading Down and Inflation”, Unpublished manuscript, 2019, on the changes of the products consumed with respect to their quality during business cycles and the impact on effective prices versus aggregate statistics. Both studies estimate the bias that leads to an increased cyclicality of effective prices.
- It should be noted that some euro area countries- notably Belgium and the Netherlands, already make use of scanner data with a formula that captures changes in the quantities of product items sold. As an example, see Chessa, A., “A new methodology for processing scanner data in the Dutch CPI”, EURONA 1, pp. 49-69, July 2016.
- A limitation to this analysis is that before 2010, HICP weights were only updated every five years in some countries and with a considerable delay (for example, for Germany, only three years later, so weights representing the base year 2000 were introduced in 2003 and used until 2008). For this reason, we checked the evidence presented in Chart A using the weights of the personal consumption deflator (PCD) rather than the HICP. Overall, the evidence in Chart A was largely confirmed by the PCD weights.
- The weights presented in Chart A are an ex post reflection of expenditure changes as recorded in Eurostat weights for the year 2009. In practice, they might underestimate changes in real-time expenditure shares and could be interpreted as a lower boundary given the timing of the weights adjustment, especially during a severe downturn.
- For services, see data from the OpenTable page entitled “The state of the restaurant industry”. Additionally, see data from the following: “Then and now: consumer CPG behavior during economic downturns”, IRI Consumer Spending Tracker, March 25, 2020, and “Italy provides insights into a new normal”, IRI report, April 8, 2020. For the US case, see for example Baker et al., “How Does Household Spending Respond to an Epidemic? Consumption During the 2020 COVID-19 Pandemic”, NBER working paper, April 2020, or “Tracking the unprecedented impact of COVID-19 on U.S. CPG shopping behavior”, Nielsen report, March 2020. See also Carvalho et al., “Tracking the COVID-19 Crisis with High-Resolution Transaction Data”, BBVA working paper No 20/06, April 2020.
- Consumers might face – at least in the short term – some shortage of items and possibly higher prices. Switching might depend on variety availability in certain item categories leading to higher relative expenditure on higher qualities or prices. This happens when the demand for a product category exceeds supply, leading to all varieties being sold out, which has an impact on the average composition of cheap to expensive varieties sold.
- In the HICP, weights are updated annually in February with the January release of the index. The weights for year “t” are based on national accounts’ data from year t-2 (the last available full year at the time of their release), which are updated to reflect the consumption pattern of year t-1. See “Harmonised Index of Consumer Prices – Methodological Manual”, Eurostat, November 2018.
- For more details, see “Guidance on the treatment of COVID-19-Crisis effects on data”, Eurostat methodological note, 26 March 2020.
- In this case, the estimated price change is assumed to be zero over the period of imputation. The guidelines (see footnote 10) allow this procedure in duly justified cases, where it can be expected that the price will be the same when the product becomes available again (museums, for example). However, “carrying forward” in this way has the disadvantage of introducing bias in the index to zero price change.
- In this context, price index refers to the lowest level in each euro area country of the European Classification of Individual Consumption according to Purpose.
- Respective metadata for April will be published by Eurostat on 20 May.
- These data are available in the file published by Eurostat on the methodology page referring to COVID-19.
- See Chart 7 in the section entitled “Prices and Costs” in this issue of the Economic Bulletin.