
The role of wages in the pick-up of inflation
Published as part of the ECB Economic Bulletin, Issue 5/2018.
In current forecasts and projections, a pick-up in labour costs is considered an important precondition for a sustained increase in underlying inflation. However, the signals provided by different labour cost indicators have been mixed for some time. While wage growth as measured by compensation per employee or by compensation per hour worked has clearly strengthened over the past two years, unit labour cost growth, i.e. wage growth adjusted for productivity growth, has remained rather flat over the same period (see Chart A). This begs the question: which labour cost indicators provide the relevant signal for the pass-through to, and the outlook for, underlying inflation? This box tries to shed some light on this issue by analysing the transmission of two different types of macroeconomic impulse, namely certain kinds of supply and demand shock, in the context of the New Area-Wide Model, and by comparing the results with the patterns of development observed in the recent past.[1]
Chart A
Compensation per employee/hour worked and unit labour costs
(year-on-year percentage changes)

Sources: Eurostat and ECB calculations.
A typical negative supply shock in the labour market lifts both wages and unit labour costs but dampens profit margins in the short run. Chart B shows the impact of a supply shock in the labour market[2] from the New Area-Wide Model on the GDP deflator, a measure of underlying inflation, and its components. The supply shock implies a pick-up in wages and thereby increases companies’ costs and prices. This leads to a reduction of demand, output and employment. The decline in employment is typically smaller than that in GDP, implying a decrease in labour productivity.[3] This decrease adds to the accumulating price pressures from wages and implies an increase in unit labour costs beyond that of wages. Companies facing a downward-sloping demand curve and price-setting rigidities will only partly and gradually pass the cost increases through to prices, with profit margins acting as a buffer. The observable patterns of responses to the supply shock hence show an increase in both wages and unit labour costs, whose impact on price pressures is partly buffered by decreasing profit margins.
Chart B
Stylised pass-through of a wage increase to the GDP deflator following a supply shock in the New Area-Wide Model
(year-on-year percentage changes; percentage point contributions)
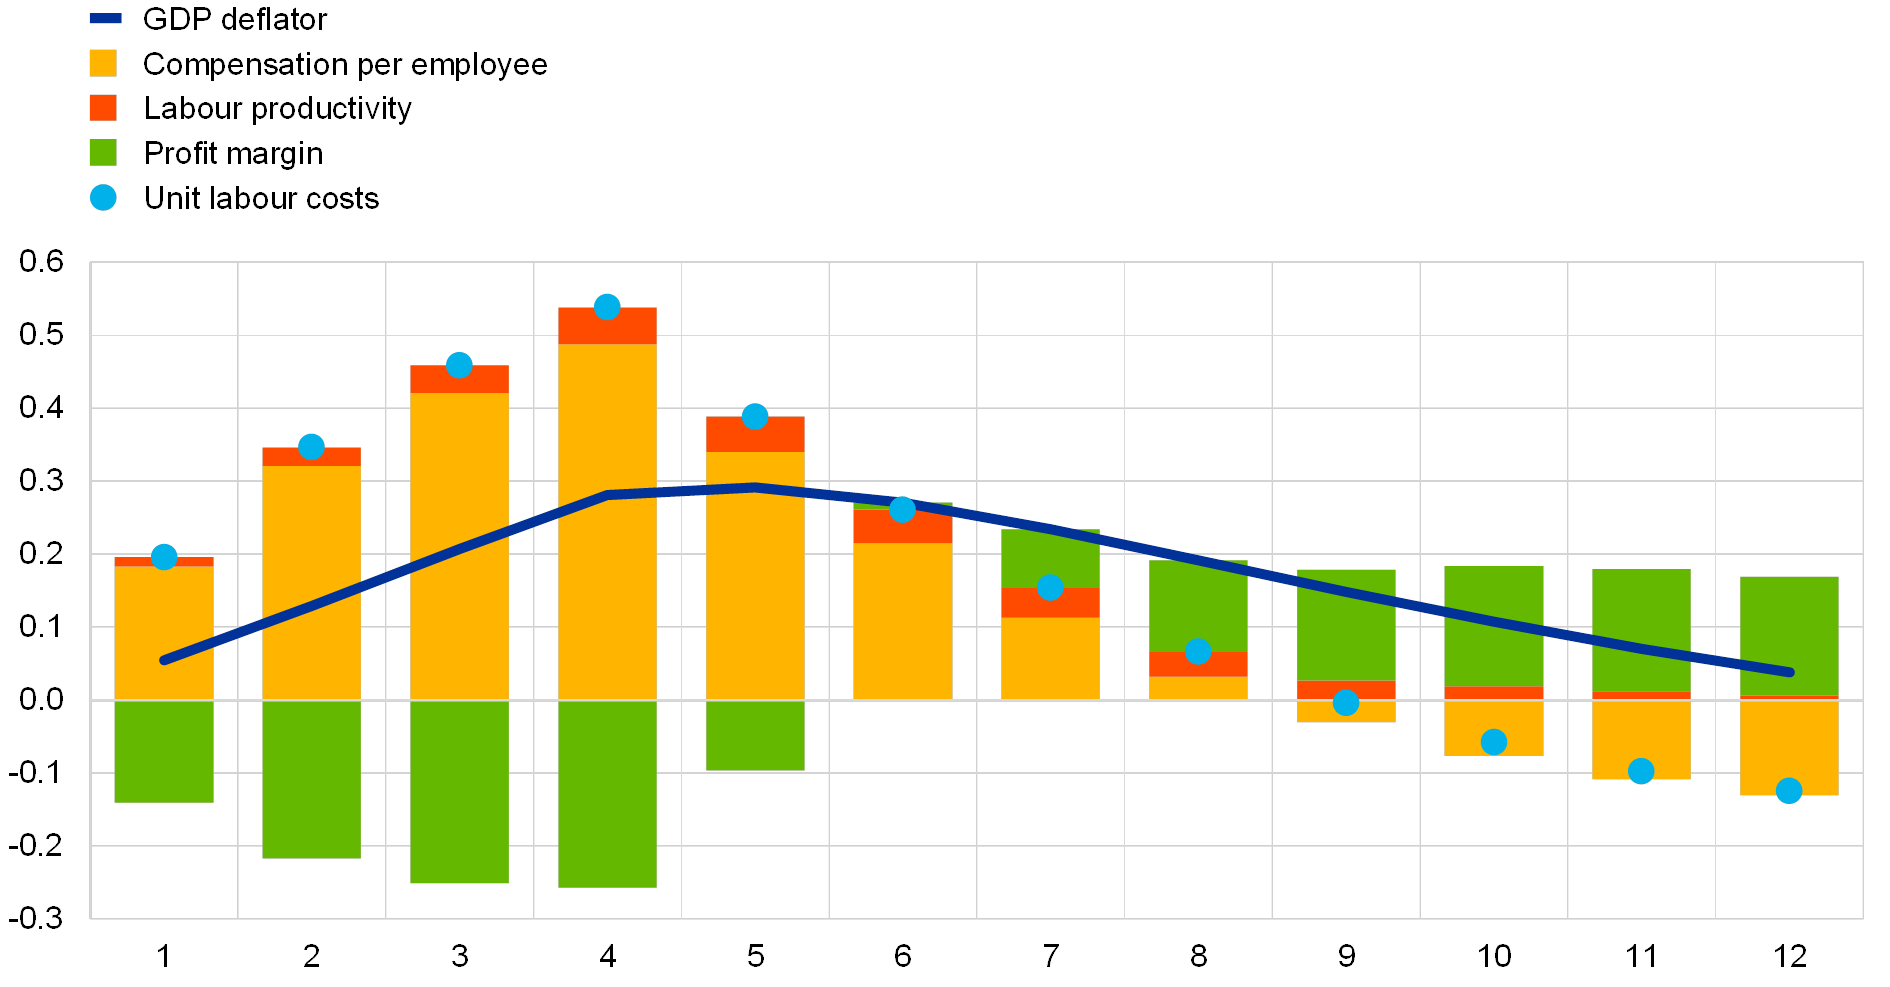
Sources: Eurostat, ECB and ECB calculations.
Notes: The x-axis indicates the quarters following the shock. The supply shock refers to a wage mark-up shock in the New Area-Wide Model. For more information on the model, see Christoffel, K., Coenen, G. and Warne, A., “The New Area-Wide Model of the euro area: A micro-founded open-economy model for forecasting and policy analysis”, Working Paper Series, No 944, ECB, October 2008. The magnitude of the shock is normalised to a cumulated increase in compensation per employee of 1% over the first year following the shock. It is assumed that indirect taxes net of subsidies respond proportionally to real GDP in such a way that this component does not contribute to changes in the GDP deflator. In the New Area-Wide Model wages and productivity are defined in terms of persons.
The response pattern of wages and unit labour costs following a demand shock is qualitatively distinct from the case of a supply shock. Chart C shows the impact of a demand shock[4] in the New Area-Wide Model on the GDP deflator and its components. The demand shock leads to an increase in production and a higher demand for capital and labour inputs, increasing both wages and employment. Again, the impact on employment is smaller than that on GDP, leading in the case of a positive demand shock to a pick-up in labour productivity with a dampening impact on unit labour costs.[5] Given the favourable demand prospects, companies can pass on the cost increase to prices so that the productivity gains and their downward impact on unit labour costs are absorbed by the companies via their profit margins. In the case of the demand shock therefore, wages pick up but unit labour costs are initially dampened and rise only with some delay. This is different to the responses in the case of a supply shock, where the wage increases amplified by the productivity losses lead to an immediate increase in unit labour costs (at the cost of profit margins). In essence, the analysis shows that the source of the shock matters for the transmission of wage developments to prices. In the case of a demand shock, the upward price pressures are initially only correctly signalled by compensation per employee, while unit labour cost developments in the first few quarters even provide contradictory signals.
Chart C
Stylised pass-through of a wage increase to the GDP deflator following a demand shock in the New Area-Wide Model
(year-on-year percentage changes; percentage point contributions)

Sources: Eurostat, ECB and ECB calculations.
Notes: The x-axis indicates the quarters following the shock. The demand shock refers to a domestic risk premium shock in the New Area-Wide Model. For more information on this model, see Christoffel, K., Coenen, G. and Warne, A., “The New Area-Wide Model of the euro area: A micro-founded open-economy model for forecasting and policy analysis”, Working Paper Series, No 944, ECB, October 2008. The magnitude of the shock is normalised to a cumulated increase in compensation per employee of 1% over the first year following the shock. It is assumed that indirect taxes net of subsidies respond proportionally to real GDP in such a way that this component does not contribute to the changes in the GDP deflator. In the New Area-Wide Model wages and productivity are defined in terms of persons.
The constellation of developments in the components of the GDP deflator over the past two years resembles that of a more demand-driven pick-up in wages and the GDP deflator. The pick-up in the growth rate of the GDP deflator over that period materialised in a context of rising wage growth and profit margins supported by a pick-up in labour productivity growth which held down and even led to a temporary decrease in unit labour cost growth (see Chart D). This pattern broadly resembles the situation following a demand shock, as shown above. The observed increases in compensation per employee should therefore be interpreted as signalling upward pressures on prices and the recent turnaround and pick-up in unit labour cost growth appears consistent with the situation of a more mature demand shock where unit labour cost growth follows the increase in compensation per employee growth with some lag.
Chart D
GDP deflator and contributions
(year-on-year percentage changes; percentage point contributions)
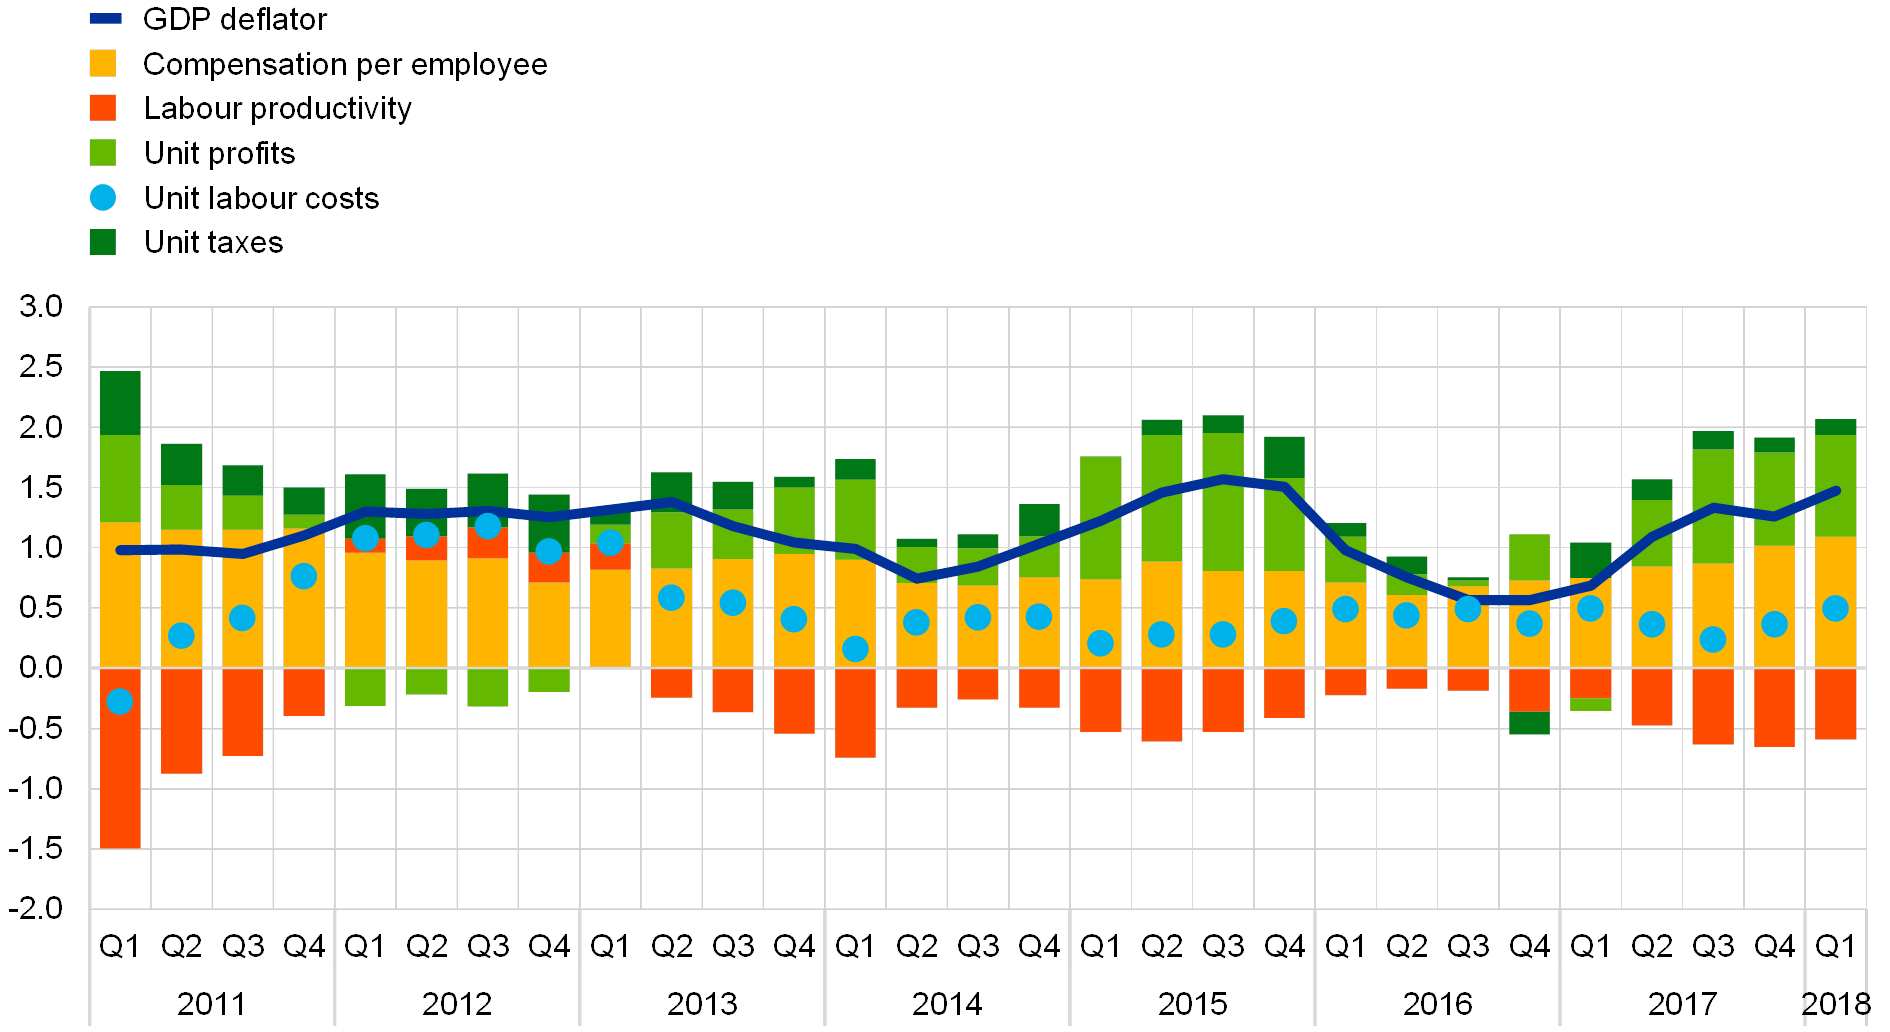
Sources: Eurostat and ECB calculations.
To conclude, the analysis underpins the notion in current forecasts and projections that rising wage growth will lead to upward pressures on prices. The constellation of the components of the GDP deflator resembles that of a more demand-driven pick-up in wages. This is in line with the strong output and employment growth observed in recent quarters, and implies that the increase in wage growth (rather than the relatively flat unit labour cost growth) reflects the relevant signal concerning upward cost pressures on underlying inflation.[6] This underpins the recent policy focus on wage growth as a precondition for rising inflation and determines the importance of the increased confidence in the rise in wage growth as corroborated, for instance, by the latest negotiated wage data and by the broad-based nature of the pick-up in wage growth across sectors and countries.
- For more information on the New Area-Wide Model, see Christoffel, K., Coenen, G. and Warne, A., “The New Area-Wide Model of the euro area: A micro-founded open-economy model for forecasting and policy analysis”, Working Paper Series, No 944, ECB, October 2008. A similar analysis can be carried out with a wide range of other models.
- The supply shock more specifically refers to the wage mark-up shock in the New Area-Wide Model. This shock captures frictions in wage setting, e.g. the impact of structural reforms, or non-linearities such as downward wage rigidity.
- This holds for employment measured both in terms of persons or hours worked, though for the latter the adjustment is generally stronger, given that it is easier, and therefore the drop in labour productivity smaller.
- The demand shock corresponds to the domestic risk premium shock in the New Area-Wide Model. This shock reflects a wedge between the interest rate controlled by the monetary authority and the return required by households when taking their decisions, affecting both consumption and investment. An example of a risk premium shock is an increase in uncertainty in the economy.
- As in the previous case, this holds for wages and employment measured both in terms of persons or hours worked. Again, the adjustment in terms of hours worked is typically more pronounced, leading to a lower response of wages and a higher response of employment with labour productivity measured in hours worked rising more slowly.
- Note that, if we focus on wages and employment in terms of hours worked rather than persons, the wage response would be smaller, as mentioned before. Therefore the signalling message of rising wage growth is reinforced by the fact that not only compensation per employee has been increasing but also compensation per hour.
European Central Bank
Directorate General Communications
- Sonnemannstrasse 20
- 60314 Frankfurt am Main, Germany
- +49 69 1344 7455
- media@ecb.europa.eu
Reproduction is permitted provided that the source is acknowledged.
Media contacts