


Fiscal policy and high inflation
Fiscal policy and high inflation
Published as part of the ECB Economic Bulletin, Issue 2/2023.
1 Introduction
The euro area, like other advanced economies, has been facing challenges posed by the rapid and strong increase in inflation. Since mid-2021, inflation in the euro area has increased at a pace last seen in the 1970s and early 1980s, after having been below the ECB’s 2% target for almost a decade. Headline year-on-year inflation, as measured by the Harmonised Index of Consumer Prices (HICP), rose from 1.9% in June 2021 to 10.6% in October 2022, before falling to 9.2% in December 2022. The steep increase in inflation has to a large extent been the result of supply-side external shocks and, to a lesser extent, demand-driven internal factors.[1]
The relation between inflation and public finances runs in both directions and depends on several factors. Conventionally, a higher inflation rate is expected to improve public finances, at least in the short term. This is due to the fact that a higher inflation rate raises government revenues, while public expenditure tends to only increase with a lag. However, as this article shows, the fiscal implications of an inflationary shock depend on several factors, most importantly: (i) the nature and size of the inflation shock; (ii) the discretionary fiscal response to the inflation shock; (iii) institutional aspects of government budgets (e.g. price indexation of some public expenditure and characteristics of tax systems); and (iv) the monetary policy reaction. In turn, the fiscal policy reaction affects the inflation outlook itself, according to the size of the impulse and its composition, among other factors.
This article assesses the relation between fiscal policy and inflation, with focus on the euro area and based on the December 2022 Eurosystem staff macroeconomic projections.[2] Following a literature overview in Section 2, Section 3 analyses the impact of inflation on public finances. A distinction is made between the discretionary measures taken by governments to alleviate the burden from high inflation on the economy and other adjustments on both the expenditure and the revenue side of government budgets. The analysis also encompasses the impact of the current inflation shock on long-term public debt projections. Section 4 presents model simulations gauging the impact of discretionary fiscal policy measures on inflation and growth. A box on the distributional aspects of fiscal policy measures, particularly those on the income side of households, supplements this analysis. Section 5 concludes.
2 Findings from the literature
Inflation affects several components of public finances.[3] These include: (i) primary spending and revenues, and thus the primary budget balance; (ii) market interest rates, which reflect the impact of inflation on the interest paid by the government to bond holders; (iii) the public debt-to-GDP ratio and the real value of debt, the evolution of which also reflects the primary balance and market interest rates.
Conventionally, inflation is considered to have a positive impact on public finances, at least in the short run. Following unanticipated (moderately) higher inflation, government expenditure tends to be rigid in the short run, for instance due to already approved budgets or backward-looking price indexation schemes. On the revenue side, inflation can affect public finances positively if tax bases and collections adjust without significant lags and grow more than nominal GDP. A positive effect of this nature is mainly due to “fiscal drag” in the presence of a progressive tax system.[4] Progressive personal income taxes, as in euro area countries, imply that increases in income in line with inflation raise government real tax revenues by pushing nominal incomes into higher tax brackets. This effect occurs when tax brackets are not adjusted to inflation. In line with these considerations, several empirical studies that seek to explain developments in the primary budget balance find a positive, but relatively weak, impact from inflation.[5]
However, when the inflation is generated by an external shock and runs at a high level, its positive impact on public finances can be reversed. The nature of the inflation shock is likely to influence the impact on public finance, as shown in several empirical and model-based analyses.[6] An external supply-side inflationary shock, for instance higher imported oil or gas prices (akin to the current energy shock in the euro area), can have a more detrimental impact on public finances than a domestic shock. An increase in imported energy prices will gradually feed into consumer prices, thus reducing household real income, moderating consumption spending and overall activity, and eventually reducing tax revenues. By comparison, an inflationary domestic demand or supply shock (associated with, for instance, a higher propensity to consume, higher wages or larger mark-ups by domestic firms) could lead to higher output and prices for longer (at least until monetary policy reacts) and, thus, to higher tax revenues. The less favourable fiscal effects of an external terms of trade shock – as experienced by the euro area following the Russian war in Ukraine – can be compounded if: (i) inflation is very high, putting stronger pressure on public spending through both discretionary measures and automatic adjustments[7]; and (ii) monetary policy reacts to counter the inflation shock, which may result in a decline in real growth and an increase in the debt burden. The sensitivity to inflation of the government debt-to-GDP ratio[8] depends crucially on the pass-through from inflation to nominal sovereign interest rates and the maturity structure of government debt (the higher the share of short-term debt, the quicker the pass-through of interest rate increases to interest payments).[9]
Turning to the impact of fiscal policy on inflation, one main issue discussed in the literature is the conditions under which fiscal policy considerations influence the price determination process. The early monetarist view holds that inflation, in the sense of sustained increases in price levels, is solely determined by money growth, and fiscal policy plays no role unless it is money-financed.[10] By contrast, according to the so-called fiscal theory of the price level[11], an unbacked fiscal policy expansion – a public debt increase that is not matched by (expected) higher future primary surpluses – implies that economic agents perceive that their real wealth has increased, leading to higher consumption and prices. More generally, if the present value of future primary surpluses is less than the amount of outstanding nominal debt, the equilibrium price level must increase (reducing the real value of debt) to assure fiscal solvency if an explicit sovereign default is excluded. Finally, in widely used macroeconomic models such as New Keynesian models, discretionary fiscal policy – in conjunction with monetary policy – can be an effective short-run macroeconomic stabilisation tool. This is especially the case in situations where monetary policy is constrained at the lower bound or in deep recessions, when fiscal policy can help prevent deflationary episodes.[12]
The empirical literature suggests that expansionary fiscal policy tends to lead to higher inflation, although the evidence is not always conclusive. Surveys of historical records find that this is especially the case in wartime, when fiscally stressed governments resort to inflation to erode their debt, or in cases of financial repression, such as those that occurred between the mid-1960s and the early 1980s.[13] Some recent studies for the euro area find that fiscal policy has a temporary effect on inflation, especially through the output gap channel and for specific instruments, particularly indirect taxes and government consumption through the public wage component.[14]
3 How does inflation affect public finances in the euro area?
Focusing on the current inflation episode, this section provides estimates for both the automatic and the discretionary impact of high inflation on euro area public finances. The discretionary component is defined as the fiscal policy measures adopted by governments to alleviate the burden of high energy prices and inflation on households and firms, as assessed in the December 2022 Eurosystem staff projections.[15] The automatic impact refers to all other reactions of revenues and nominal expenditures to inflation, where the expenditure side covers the indexed budget items, as well as estimated nominal adjustments to inflation. Finally, this section provides estimates for the impact of inflation on the budget balance and government debt. The estimates are provided for the euro area aggregate following a bottom-up approach at the country level.
Discretionary fiscal support in reaction to high energy prices and inflation
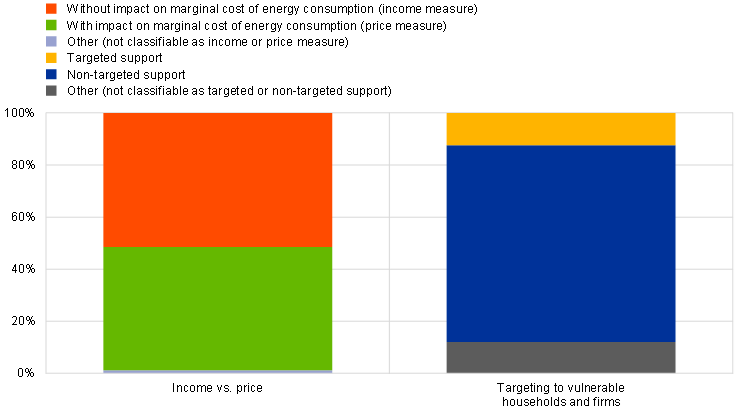
Euro area discretionary fiscal measures in response to the energy and inflation shock are estimated to be significant in size in 2022-23. Fiscal support increased strongly in 2022 (Chart 1, panel a) in response to the spike in energy prices and inflation following Russia’s invasion of Ukraine.[16] In the context of government approval of draft budgets for 2023, some of these measures have been extended and additional support was introduced for this year, bringing the total gross stimulus close to 2% of GDP in both years. The ultimate budget impact of these measures is clouded in uncertainty. In addition to the general intricacies related to their specific design and implementation, some of these measures depend on developments in the market prices of energy.[17] This is particularly the case for measures that affect prices directly. While difficult to classify precisely, about half of the total support in the euro area over the 2022-23 period is assessed as affecting prices directly (via lower marginal costs of energy consumption), with income measures making up the remainder.[18] Similarly, although estimates vary according to the methodology employed, about 12% of the total support is estimated to target vulnerable households and, to a smaller extent, firms directly affected by the hike in energy prices (Chart 1, panel b).[19] Since the cut-off date of the December 2022 projections, some countries have announced their intention to recalibrate some of the previously approved across-the-board measures to make them more targeted. In terms of composition by fiscal instrument, most measures over 2022-23 take the form of “net indirect taxes” – reductions in indirect taxes and increases in subsidies. Transfers, in particular to households, also accounted for a significant share, especially in 2022.
Chart 1
Euro area discretionary fiscal measures in response to high inflation
a) Size of support and composition by fiscal instrument over the projection horizon
(percentages of GDP, annual levels)
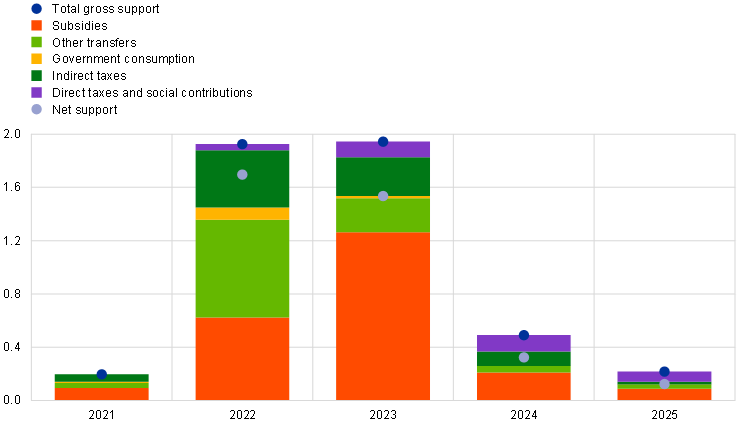
b) Targeting of fiscal support over 2022-23
(percentages of total 2022-23 support)
Source: ECB calculations based on the December 2022 Eurosystem staff macroeconomic projections for the euro area.
Notes: Panel a) – the size of the bars denotes the budget balance impact of stimulus measures (gross terms). “Net support” denotes the gross budget support, adjusted for discretionary financing measures (mostly taxes on energy sector windfall profits). “Other transfers” mostly denotes transfers to households.
Panel b) – the shares are calculated based on the total policy measures in 2022 and 2023. The categories ‘Other (not classifiable as income or price)’ includes e.g. government purchases to fill gas storage. "Other (not classifiable as targeted or non-targeted)' includes, in addition, equity support to gas dealers. For households, a measure is considered targeted if there is some form of means-testing. For firms, a measure is considered targeted if it applies to specific energy-intensive activities as defined by the European Commission.
Fiscal support in response to high energy prices and inflation is currently expected to be largely withdrawn over 2024-25. Broadly based on measures approved in the context of 2023 budgets, the December 2022 Eurosystem projection baseline for 2024 embeds fiscal support of around 0.5% of GDP (down from close to 2% of GDP in 2023), as many measures are set to expire, or their budget impact is expected to fade. About half of the stimulus in 2024 relates to further subsidies, while the rest consists mainly of extensions of cuts in energy prices and other indirect taxes, as well as inflation compensation measures in the form of lower direct taxation. A further withdrawal of measures is assumed for 2025, bringing their estimated budget cost down to 0.2% of GDP. Overall, the size of these measures over the projection horizon will depend on governments’ further fiscal policy decisions, as well as future energy price and inflation developments.
The automatic reaction and other adjustments of public finances to high inflation
At the euro area aggregate level, the share of automatically indexed expenditure in 2022 is estimated to be almost one-third of total government expenditure. As shown in Chart 2, most of this spending (around three-quarters) is indexed to inflation (price indices), while the rest is mainly indexed to wages (economy-wide wages, minimum wage). The indexation, especially for pensions and wages[20], is mostly backward-looking and lagged by one year. Public pensions make up the largest share of total expenditure (21%), followed by unemployment benefits and other social benefits in cash (6%) and public wages (4%). Finally, “other spending” (1%) refers mostly to interest payments related to inflation-indexed debt.
Chart 2
Automatic indexation of public spending in the euro area in 2022
(percentages of total public expenditure at euro area aggregate level)

Source: ECB staff calculations based on a Working Group on Public Finance questionnaire.
Note: Data are aggregated at euro area level, based on a bottom-up approach at country level.
In addition to automatic indexation, an unanticipated increase in the prices of goods and services has direct consequences for other government spending. While nominal expenditures are approved annually in a discretionary manner in the context of the budgetary process, which is usually anchored in medium-term strategies, an inflation shock – especially when large – is likely to at least partly feed into nominal public spending, even in the short run. This is particularly the case for government purchases of goods and services and, to some extent, also investment (the latter may be set by longer-term contracts, in which case high inflation could lead to delays in execution).
Estimated impact of the inflation surprise on the euro area budget balance
This subsection attempts to gauge the effect of inflation on the euro area budget balance that materialises even without governments implementing discretionary fiscal measures. The analysis follows a bottom-up (country-by-country) approach and makes use of the ECB fiscal projection model, which embeds a broad set of fiscal variables that are linked to prices. Most notably, it accounts for country-specific spending indexation arrangements, as described in the previous subsection.[21] As a result, this analysis examines the direct (partial) effect of the inflation surprise that materialised within the last year on the budget balance (including its components) over the 2022-24 period. [22]
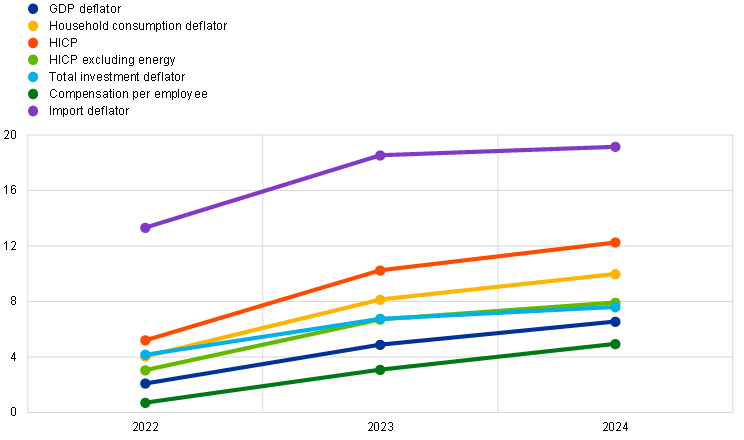
The inflation surprise used in the simulation is proxied by the price forecast revisions since inflation started surging in the euro area. The reference projection exercise for calculating the revisions is the December 2021 Eurosystem staff projections.[23] Since then, inflation prospects, especially for 2022 and 2023, have been significantly revised upwards (Chart 3, panel a). The import price deflator, in particular, has recorded the largest revision, pointing to the mainly external nature of the inflation shock. This contributed to large revisions in the overall HICP and the household consumption deflator – both indices with a meaningful import content. Other domestic price indices, like the GDP deflator and average compensation, were subject to only limited upward revisions. The simulations therefore solely evaluate how the budget balance and its components are affected by the revisions to price variables (i.e. real and financial variables are kept constant as per the partial-equilibrium nature of the analysis and the foreseen discretionary fiscal measures are not taken into account).
Chart 3
The inflation surprise and its effects on the euro area budget balance
a) Inflation surprise: revisions to price variables in the December 2022 versus December 2021 Eurosystem projections
(deviations in cumulative growth rates, percentage points)
b) Direct (partial) effect of the inflation surprise on the budget balance and overall budget balance revisions
(percentages of GDP; dotted line = percentage points)

Source: ECB staff calculations based on the December 2021 and December 2022 Eurosystem staff macroeconomic projections for the euro area.
Notes: Panel b) – the black budget balance line and the bars (its components) reflect the simulation results of the direct (partial) impact (automatic indexation and other adjustments) of the inflation surprise. These exclude the discretionary response of fiscal policy described at the beginning of this section and the indirect effects, such as the impact of monetary policy reaction on interest payments, output and tax bases. For example, the category “interest payments*” in this chart captures only the direct impact of the inflation revisions on interest payments related to inflation-indexed bonds. All effects of indirect channels, including the full interest payment impact and discretionary fiscal policy reaction – together with other factors – are captured in the dotted line, which denotes total revisions in the budget balance-to-GDP ratio between the December 2022 and December 2021 projection vintages. The category “Direct taxes and social security contributions” denotes the impact on these items, which are paid by both households and firms.
According to the simulations, it takes one year for the euro area budget balance to be adversely affected by the inflation surge (Chart 3, panel b). The limited, albeit instantaneous, rise in taxes and the partial reaction on the expenditure side lead to a broadly neutral overall effect on the budget balance in 2022. In subsequent years, however, spending pressures intensify and more than offset the benefits on the revenue side, leading to nearly 0.5% of GDP deterioration in the budget balance level in 2024. The overall slight adverse impact of price pressures on public finances derives from the nature of the inflation surprise, which is predominantly originating from an external supply shock. This type of inflation leads to more limited gains on the revenue side, which in turn can easily be outweighed by extra spending pressures.[24] As explained before, the simulations in this framework capture the “direct” impact of the inflation surprise on the primary balance, while in terms of interest payments the impact is limited to inflation-indexed bonds. Thus, the effects are likely to be a lower-bound estimate since the exercise is not incorporating other relevant channels, such as a dampening effect of the monetary policy tightening on the real economy or the discretionary response of fiscal policy described at the beginning of this section. These channels (together with other factors that may not be directly related to the high inflation shock) are captured in the (much larger) revision of the fiscal balance between the December 2021 and December 2022 Eurosystem staff projections (dotted line in Chart 3, panel b).
Estimated impact of the inflation surprise on euro area public debt
As regards the euro area public debt-to-GDP ratio, only considering the revisions to prices would imply a favourable impact of the inflation surprise through the effect on the denominator. The simulations conducted in line with the methodology laid out in the previous subsection point to a fall of close to 5 percentage points in the debt-to-GDP ratio in 2024. This is caused by the denominator effect on account of the revisions to the GDP deflator, which is assessed as growing by about 6 percentage points more than in the projections from one year ago. However, these results do not reflect all the consequences of inflation (and the monetary policy reaction to it), such as the increase in the cost of financing (except for inflation-indexed bonds), the downside revisions to real growth or the discretionary fiscal measures implemented in response to the high inflation. By contrast, the revisions compared with December 2022, which recognise all these factors (including some unrelated to the inflationary shock), point to a rise in the debt-to-GDP ratio (see dotted line in Chart 4, panel a) and its full decomposition in Chart 4, panel b). For longer-run effects, stylised simulations of an inflationary external supply shock in a general equilibrium framework lead to similar conclusions (Box 1).
Chart 4
The inflation surprise and its effect on the euro area government debt ratio
a) Direct (partial) effect of price revisions in the December 2022 versus December 2021 Eurosystem projections on the debt-to-GDP ratio
(percentage points)
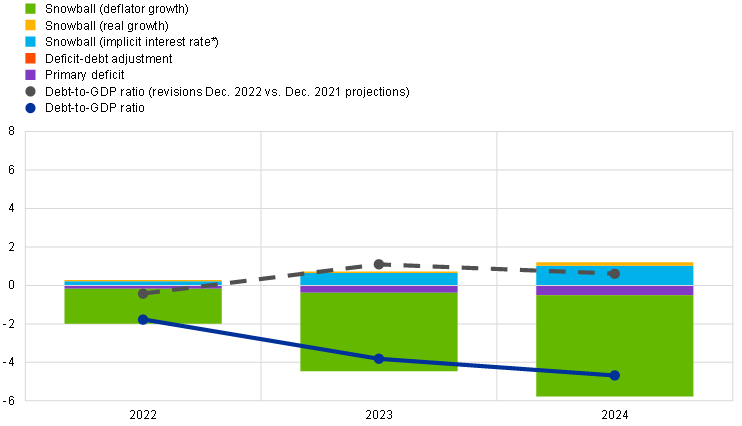
b) Decomposition of the overall revisions in the debt-to-GDP ratio in the December 2022 versus December 2021 Eurosystem projections
(percentage points)

Source: ECB staff calculations based on the December 2021 and December 2022 Eurosystem staff macroeconomic projections for the euro area.
Notes: The snowball effects in both charts refer to the change in the debt-to-GDP ratio on account of the differential between the effective interest rate paid on the stock of debt and the nominal GDP growth (further decomposed in the chart into real GDP growth and GDP deflator growth).
Panel a) illustrates the effect of the revisions to price variables on the debt-to-GDP ratio only, consistent with the methodology followed in the previous subsection. In this context, the category of “Snowball (implicit interest rate*)” reflects only the direct impact of the inflation revisions on interest payments related to inflation-indexed bonds. The dotted line denotes revisions in the debt-to-GDP ratio between the December 2022 and December 2021 projection vintages, excluding base effects of revisions in the debt ratio from 2021.
Panel b) reflects the overall revisions in the debt-to-GDP ratio and its drivers between the December 2021 and December 2022 Eurosystem staff projections.
Box 1
Stylised simulations of the longer-run effect of an inflationary shock on government debt in a general equilibrium framework
This box examines the implications of a stylised inflationary supply shock on the euro area’s government debt outlook using a general equilibrium approach. The simulation results show that a negative impact on economic activity from an adverse external supply shock may outweigh the positive impact of higher inflation on debt ratios, while an internal demand shock would reduce the debt burden in the medium term.
The analysis aims to illustrate the main propagation channels of a standardised external adverse shock to terms of trade, resembling certain features, but not the size, of the recent inflation increase. The shock is calibrated to lead, in the absence of a monetary policy reaction, to a 1 percentage point increase in HICP inflation over three years. It is designed as a series of unexpected cost push shocks originating in the rest of the world on their export of goods. To illustrate the difference compared with an internal demand-driven shock, a favourable domestic risk premium reduction shock is also considered over three years, which would boost internal demand and, therefore, inflation. These two shocks are analysed using the Euro Area and Global Economy (EAGLE) model[25], a multi-country dynamic stochastic general equilibrium (DSGE) model calibrated for the four largest euro area countries, the rest of the euro area and the rest of the world.[26] No discretionary fiscal policy measures in response to the inflation shock are considered. As regards the automatic reaction of public finances, a simplified approach is applied based on the analysis in Section 3. Similarly to the baseline projections in the Eurosystem staff macroeconomic projections for the euro area, as of 2025 the structural balance is projected to record some improvement. Monetary policy is assumed to react to the HICP inflation shock by increasing the main financing rate according to a standard Taylor rule. The induced sequence of interest rate increases will be fully passed on to short-term sovereign debt yields and, through the expectations component, partially passed on to long-term rates.
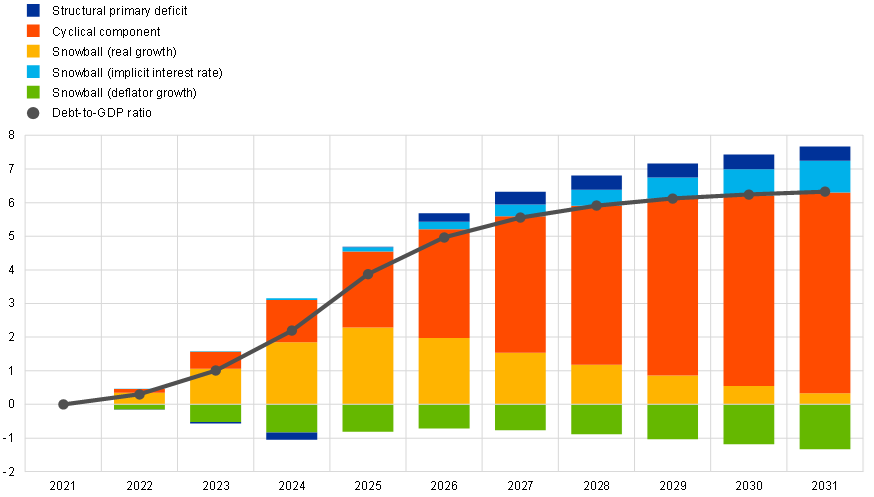
In the case of an external supply shock with a standard Taylor rule monetary policy reaction, the simulations show an adverse impact on the debt-to-GDP ratio, mainly through the real GDP channel that dominates the favourable impact from higher inflation (Chart A, panel a). In this scenario, the shock has a detrimental impact on economic activity. The fall in GDP is due to two main factors: the direct recessionary effects of an import price increase and the monetary policy reaction to counteract the ensuing higher inflation. Their impact is exacerbated by the unexpected nature of the shock.[27] The effect of lower GDP is estimated to be at least twice as large as the positive debt ratio-reducing effect of the higher GDP deflator. The cumulative effect on the debt ratio would be significant over the ten-year horizon.
Chart A
The impact of an inflationary shock on the government debt-to-GDP ratio – aggregate of four largest euro area countries
a) External supply shock
(percentage points)
b) Internal demand shock
(percentage points)

Source: ECB staff calculations.
Notes: In this chart, the contributions from the structural primary deficit and the cyclical component add up to the contribution of the primary deficit (see also the notes to Chart 4 in the main text for the other components included in the debt ratio decomposition). The strong cumulative contribution of the cyclical component stems from the fact that the output gap is only expected to close over the simulation horizon and not to return to positive territory (standard features in DSGE models). Therefore, the budgetary losses are not compensated for, even though the GDP level will ultimately return to its steady state (potential GDP).
In the case of high inflation driven by internal demand, the effect on real GDP and the debt outlook would be mildly favourable (Chart A, panel b). In this scenario, economic agents will increase their consumption and investment as they expect the real interest rate in the economy to decline.[28] As a result, the debt ratio would benefit from two debt-reducing effects: (i) higher real GDP growth and its positive effects on the denominator and the budget balance; (ii) higher inflation and therefore a higher GDP deflator (denominator effect). The two sets of results should be viewed as polar opposites, as the inflationary period the euro area has been experiencing since mid-2021 is very likely the result of a combination of supply and, to a lesser extent, demand-side shocks.
4 How does fiscal policy affect inflation and growth in the euro area?
This section uses model simulations to assess the impact of discretionary fiscal policy measures on inflation and growth in the euro area. The simulations distinguish between the impact stemming from: (i) discretionary fiscal support in response to high energy prices and inflation (Chart 1); and (ii) all remaining discretionary fiscal policy measures embedded in the December 2022 projection baseline. The latter include consolidation measures related to the financing of the energy packages and the partial reversal of support related to the COVID-19 crisis and subsequent recovery. The macroeconomic effects of these fiscal shocks are aggregated at the euro area level, based on country-specific simulation results in the context of the Eurosystem staff projections.[29] The simulation results are surrounded by significant uncertainty stemming from the size, design and transmission of the fiscal shocks given their unprecedented nature. These shocks are in turn contingent on developments in the price of energy and other fiscal policy decisions.
The discretionary fiscal support to shield the euro area economy from high inflation is estimated to have positive growth effects while reducing inflationary pressures, over 2022-23. However, these effects are broadly reversed over the rest of the projection horizon. This is mainly because the fiscal support in response to the energy shock is assessed to be temporary and, based on currently approved policies, to be mostly withdrawn as of 2024. The fiscal support is estimated to have reduced inflation in 2022 and to lower it further in 2023, with a broad reversal of the effect in 2024 and 2025, leading to stronger inflation persistence. Overall, given the nature and composition of the fiscal response (as described in Section 3), its impact on HICP inflation materialises mainly through the energy component. Effects on HICP inflation, which arise from higher demand following the fiscal stimulus, build up more gradually. See Chart 5 (bars) for the simulation results. For a discussion on the distributional impact of the government measures to compensate households for the high inflation, see Box 2.
Chart 5
Macroeconomic effects of euro area discretionary fiscal policy measures
(percentage points)

Sources: December 2022 Eurosystem staff macroeconomic projections for the euro area and ECB staff calculations.
Notes: Macroeconomic effects are shown at the euro area aggregate level as percentage point deviations from a baseline without the fiscal policy measures. Simulations are conducted under the simplifying assumption of fiscal shocks being exogenous and there being no monetary policy response.
Beyond the energy and inflation support, the recent discretionary fiscal policy measures have somewhat smaller effects overall, on both growth and inflation over the projection horizon. On account of the timing and composition of the overall discretionary fiscal measures, the impact on growth is assessed to be positive only in 2022, before turning mildly negative in 2023 and more strongly negative over the 2024-25 period, when a larger share of measures, including those related to the COVID-19 crisis and recovery, are withdrawn. The impact on inflation is less pronounced than in the case of the direct energy/inflation compensatory measures in the first two years of the projection horizon, on account of other compensatory measures and the reversal of some of the pandemic-related measures (in particular, a decline in subsidies in 2022 compared with 2021 in some of the largest euro area economies). See Chart 5 (triangles) for the simulation results. Taking into account the cumulative effect of all fiscal stimulus measures embedded in the baseline since 2020 (compared with the pre-pandemic period of 2019), fiscal policy is assessed to continue to have a positive impact on euro area GDP (cumulatively about 2.3 percentage points over the 2020-25 period compared with a scenario of “no fiscal policy change”), but also on HICP (about 0.8 percentage points).
Box 2
The distributional impact of fiscal measures to compensate for high consumer price inflation[30]
Governments across the euro area have made sizeable fiscal efforts to cushion the impact of the current inflationary shock for households. Lower-income households are generally thought to be more strongly affected by high consumer price inflation. This is particularly true for energy price-driven inflation, as lower-income households are more exposed to increases in electricity, gas and heating costs than higher-income households.[31] The measures taken by governments so far are mostly aimed at containing price increases (price measures), but some also support household income directly (see Section 3).
But how successful have euro area governments’ inflation compensation measures been in addressing the inflation gap opened by the inflationary shock? This box summarises analyses of the Working Group on Public Finance on the distributional impact of government measures to compensate for high consumer inflation in 2022. The study uses a tax-benefit microsimulation model for the European Union (EUROMOD) with microdata as the input (EU-SILC) for quantifying the impact of income measures, as well as some back-of-the-envelope calculations to assess the distributional impact of price measures.[32] The analysis is partial, in that it does not account for likely substitution effects in consumption away from energy or energy-intensive products for example. It also does not account for the effect on wealth distribution or the distributional effect of future higher public debt repayment.
On average, government measures mitigated about one-quarter of euro area household income loss on account of inflation in 2022 (Chart A). First, measures aimed at containing price increases have temporarily lowered consumer prices. For the euro area aggregate – proxied by the four largest euro area countries as well as Greece and Portugal – consumer inflation is projected to have been above 9% in 2022 (excluding owner-occupied housing and rent). Our estimates suggest that the rise in consumer prices could have been around 1.7 percentage points higher in the absence of price measures, particularly those aimed at limiting the increase in heating, petrol and electricity prices.
Second, measures aimed at supporting household income contributed to the increase in households’ nominal disposable income. Overall, a 5.8% increase in disposable income compensated for around 60% of the 2022 rise in inflation in the euro area. Increases were mainly on account of the expected rise in the market component of household income (3.6%), reflecting the indexation of public wages and pensions, among other factors (see Section 3). However, discretionary government income support measures accounted for an increase in disposable income of 0.9 percentage points.[33] These measures include: cash transfers to private households, families with children, students or pensioners; increases of transport subsidies for commuters; and income tax allowances or reductions that are assumed to be usually of a temporary nature.
Chart A
Consumer inflation and nominal disposable household income in the euro area
(percentage changes in equivalised disposable household income per decile)

Source: ECB staff calculations.
Notes: Results for nominal disposable income growth are based on microsimulations with EUROMOD using EU-SILC data. Data on quintile-specific consumer inflation update those presented in the box entitled “The impact of the recent rise in inflation on low-income households”, Economic Bulletin, Issue 7, ECB, 2022, based on Eurostat data. Consumer price inflation differs from the HICP rate as it does not include owner-occupied housing and rent, among other variables. Counterfactual consumer price inflation assumes household energy expenditure would have been higher by the same volume as the volume of price measures adopted by government. The calculation accounts for quintile-specific energy expenditure.
While the bulk of measures did not target only lower-income households, they did mitigate the inflation gap created by high inflation to some degree (Chart A). Households in the lower quintiles of the income spectrum experienced higher consumer inflation than households in the higher-income quintiles.[34] This implies that, for the same nominal disposable income growth, lower-income households will have had a stronger decline in purchasing power than high-income households. This gap amounts to around 2 percentage points between the lowest and the highest-income quantile, and could have been even bigger in a counterfactual scenario without price measures (close to 3 percentage points). Price measures benefited lower-income households somewhat more on account of the higher shares of energy and energy-intensive products in their consumption baskets.[35] All households benefited from the fiscal measures on the income side. Some of these measures specifically targeted the lowest-income households. As a result, they increased household income by 2.4 percentage points in the lowest quintile, where they contributed to more than one-third of total disposable income growth. At the same time, they accounted for around 0.4 percentage points of disposable income growth for the richest household quintile. Overall, the inflation gap remaining between the highest and lowest quintile is estimated to be around 1.2 percentage points after taking account of both price and income measures.
When addressing the differential impact of inflation across income groups, there is room for euro area governments to improve the economic efficiency of their fiscal measures. Only about one-tenth of the support is estimated to have targeted lower-income households, which are typically credit-constrained and where higher inflation immediately constrains consumption.[36] Most of the public money benefited households that had the means to more easily weather a temporary rise in consumer inflation unaided. This unnecessarily burdens public finances, which are vulnerable in several euro area countries. At the same time, many early measures aimed at containing energy price increases in 2022 disincentivised the reduction of fossil energy use. Governments should continue recalibrating inflation compensation measures, making them better targeted and more efficient, to also facilitate the green transition.
5 Conclusions
Beyond the short run, euro area public finances may turn out to be negatively affected by the current high inflation episode. This would be the case even without considering governments’ discretionary policy response to the high energy prices and inflation (assessed at close to 2% over the 2022-23 period). This negative impact can primarily be explained by the nature and size of the inflation shock in the euro area –mainly a large, external energy shock that generates less tax revenues in relation to its size, negatively affects firms’ profitability and growth and puts high pressure on nominal public spending. Moreover, the monetary policy reaction required to avoid this inflation shock leading to undue second-round effects is being translated into an increase in interest payments on government debt. In terms of the euro area debt-to-GDP ratio, the analysis shows that, beyond the short run and conditional on the monetary policy reaction, a negative impact on economic activity from an adverse supply shock may outweigh the positive impact of higher inflation on debt ratios.
In turn, discretionary fiscal policy measures adopted by euro area governments in response to the high energy prices and inflation are found to have significant, but only temporary, macroeconomic and distributional effects. These measures are estimated to lower inflationary pressures over the 2022-23 period, before this effect broadly reverses, leading to higher inflation over the 2024-25 period. The degree to which fiscal measures and their composition will be effective in influencing price dynamics, however, is highly uncertain given their unprecedented nature. The discretionary fiscal support in reaction to the high energy prices and inflation is also found to initially increase GDP growth and support households’ nominal disposable income. However, despite being progressive, some fiscal measures are not very efficient from an economic perspective. Only a relatively small share of the support is estimated to target lower-income households. Moreover, the additional burden on public finances, especially if the support is to be extended through more long-lasting measures, may pose additional challenges in an environment of rising interest payments, particularly in highly indebted countries.
The overall fiscal and macroeconomic outcomes depend on many factors, including how fiscal and monetary policy react in the period ahead. Fiscal measures that are not temporary, targeted and tailored to preserving incentives to consume less energy are likely to exacerbate inflationary pressures, which would necessitate a stronger monetary policy response. Fiscal policies should therefore be oriented towards making the euro area economy more productive, rebuilding fiscal buffers and gradually bringing down high levels of public debt.[37]
ECB, “June 2022 Eurosystem staff macroeconomic projections for the euro area”. These projections show that energy remained the main driver of HICP inflation, particularly after Russia’s invasion of Ukraine on 24 February 2022 and further supply chain disruptions, with all main subcomponents (fuels, electricity and gas) recording high price dynamics. For an empirical decomposition of HICP inflation excluding energy and food, see the box entitled “The role of demand and supply in underlying inflation – decomposing HICPX inflation into components”, Economic Bulletin, Issue 7, ECB, 2022.
See ECB, “December 2022 Eurosystem staff macroeconomic projections for the euro area”. This article was pre-released on 13 February 2023, drawing on the latest projections at the time.
For a review of the literature see, among others: Tanzi, V., Blejer, M.I. and Teijeiro, M.O., “Inflation and the Measurement of Fiscal Deficits”, Staff Papers, Vol. 34, No 4, International Monetary Fund, December 1987; and Attinasi, M.G. et al., “The effect of low inflation on public finances”, in Banca d’Italia, Beyond the Austerity Dispute: New Priorities for Fiscal Policy, No 20, March 2016.
For more details, see Morris, R. and Reiss, L., “A decomposition of structural revenue developments for euro area member states”, Working Paper Series, No 2455, ECB, August 2020.
See the analysis in Attinasi, M.G. et al., op. cit., which finds for samples of euro area and EU countries over the period 1970-2013 that a 1 percentage point increase in the GDP deflator growth is associated with a 0.1 to 0.2 percentage point increase in the primary balance ratio. Similar evidence is found in about half of 13 EU countries investigated – see Berti, K. et al., “Fiscal Reaction Functions for European Union Countries”, European Economy Discussion Papers, No 028, April 2016.
For a model-based analysis of the impact of an external (oil price) versus internal (profit mark-up) supply shock, see de Cos, P.H., Hurtado, S., Marti, F. and Perez, J., “Public finances and inflation: the case of Spain”, Documentos Ocasionales, No 1606, Banco de España, 2016. A recent analysis (Burriel et al., “Inflation and public finances across EMU countries”, Documentos Ocasionales, Banco de España, (forthcoming) 2023) for the euro area finds that an external oil shock has a very small and short-lived positive impact on the budget balance (initial increase in revenue and a fall in expenditure), which turns significantly negative and reaches a trough by the middle of the second year following the shock. A demand shock, on the other hand, induces an increase in the budget balance during the first and second years (greater increase in revenues than in spending) after the shock, followed by a fall in the third year.
In certain countries, such as Belgium, some automatic spending adjustments take place only when inflation-based indices exceed 2% (see also Section 3 of this article). A more recent empirical analysis for a panel of euro area countries finds evidence that HICP inflation (actual and surprise) has non-linear effects on the primary balance (inverse U-turn relationship). See Briodeau, C. and Checherita-Westphal, C., “Inflation and public finances in the euro area: is there a threshold effect?”, Occasional Paper Series, forthcoming, ECB, 2023.
All else being equal, an unexpected increase in inflation erodes the public debt-to-GDP ratio (and the real value of debt) via the “denominator effect” that operates on outstanding debt issued prior to that increase. The interest payments on the existing stock of debt are also directly affected by the higher inflation to the extent that bonds are automatically indexed to inflation. More generally, in line with the theoretical literature, nominal interest rates ultimately adjust to changes in expected inflation through the so-called “Fisher” effect. While the full Fisher effect posits a one-to-one adjustment in nominal interest rates, some empirical evidence points to a partial effect, typically on the ten-year benchmark sovereign yield (see Attinasi, M.G. et al., op. cit.).
For a quantification of the costs and benefits of inflation surprises for government debt, see Andreolli, M. and Rey, H., “The Fiscal Consequences of Missing an Inflation Target”, NBER Working Paper Series, No 30819, National Bureau of Economic Research, January 2023. The effects can be sizeable, and they crucially depend on debt level and maturity.
For an overview of theoretical approaches (and historical trends), see Bordo, M.D. and Levy, M.D., “Do enlarged fiscal deficits cause inflation? The historical record”, Economic Affairs, Vol. 41, No 1, February 2021, pp. 59-83.
For more information about the development of this theory, see (among others): Leeper, E.M., “Equilibria under ‘active’ and ‘passive’ monetary and fiscal policies”, Journal of Monetary Economics, Vol. 27, No 1, February 1991, pp. 129-147; and Sims, C.A., “A simple model for study of the determination of the price level and the interaction of monetary and fiscal policy,” Economic Theory, Vol. 4, May 1994, pp. 381-399. For a comprehensive discussion, see Cochrane, J., The Fiscal Theory of the Price Level, Princeton University Press, 2023.
Work stream on monetary-fiscal policy interactions, “Monetary-fiscal policy interactions in the euro area”, Occasional Paper Series, No 273, ECB, September 2021.
See the review of the historical record in Bordo, M.D. and Levy, M.D, op. cit.; and Reinhart, C. and Sbrancia, M., “The liquidation of government debt”, Economic Policy, Vol. 30, No 82, April 2015, pp. 291-333.
For a review of the recent empirical literature and an analysis for euro area countries, see Checherita-Westphal, C., Leiner-Killinger, N. and Schildmann, T., “Euro area inflation differentials: the role of fiscal policies revisited”, Working Paper Series, No 2774, ECB, February 2023. Evidence for the role of several fiscal instruments, in particular indirect taxes and government consumption, is also found in the box entitled “Fiscal policy and inflation in the euro area: a VAR-based analysis”, in Work stream on monetary-fiscal policy interactions, op. cit.
Based on the fiscal questionnaires provided by the Eurosystem members of the Working Group on Public Finance. This updates the analysis presented in the box entitled “Euro area fiscal policy response to the war in Ukraine and its macroeconomic impact”, Economic Bulletin, Issue 5, ECB, 2022.
Additional support has been granted in response to the war (for defence, refugee support, etc.), bringing the total estimate for energy and other war-related support to around 2.1% of GDP over 2022-23, 0.7% of GDP in 2024 and 0.5% of GDP in 2025. This refers to fiscal support measures with an impact on the general government budget balance. In addition, euro area governments extended liquidity support for firms affected by the war and the energy crisis in the form of equity acquisitions (with an impact on public debt through the deficit-debt adjustment) and government guarantee schemes (which represent contingent liabilities and can only affect the budget balance when called).
Fiscal measures for which the costs depend on market prices for energy are diverse, but most importantly they refer to price ceilings for gas and electricity, where the government pays or reimburses energy providers for any price differences above the imposed ceiling.
At the country level, the share of measures that have a direct impact on prices is higher in the majority of countries. In Germany, the gas and electricity price brake measures, which are very large in terms of budget impact, are assessed as “income” support since households and firms receive transfers that depend on their past energy consumption. Nonetheless, such measures (classified mostly as subsidies) are assessed as having a direct impact on lowering prices over the period in which they are applied.
In the Eurosystem staff assessment in the context of fiscal projections, some form of means-testing needs to be applied for a measure to be classified as targeted. In addition, some measures are classified as “Other” (see notes to Chart 1, panel b). If this category is removed, the share of targeted measures for the euro area increases to 21% for 2022. In its 2022 Autumn Package, the European Commission estimates that around 25% of the EU-wide support in 2022 was targeted.
For details on these two major items, see Checherita-Westphal, C. (ed.), “Public wage and pension indexation in the euro area: an overview”, Occasional Paper Series, No 299, ECB, August 2022. In some cases, the indexation to past inflation is only partial or has a longer lag. For instance, in Italy public wages are automatically indexed to inflation based on national CPI excluding energy. This is done retrospectively at the end of the three-year wage agreement.
This was part of an extension of the fiscal projection platform prepared for the purpose of this analysis. The extension was possible thanks to information collected from the Eurosystem members of the Working Group on Public Finance through a standard questionnaire on the indexation of expenditure items.
As a partial equilibrium framework, the platform depicts only the most direct link between prices and fiscal variables and, as such, it does not capture all forces at play. Most notably, it lacks the capacity to represent the dampening effect of an inflationary shock on consumption or the impact of monetary policy tightening. Considering these indirect channels would tilt the assessment of the impact of inflation on the budget balance in a more negative direction. In a similar vein, the standard tax elasticities of the platform will not capture the materialisation of the tax buoyancy observed in some countries, in particular in relation to indirect taxes and direct taxes on corporations amid the post-pandemic recovery and strong expansion in nominal bases. This, by contrast, constitutes an upside risk for the analysis.
Proxying the inflation surprise as the difference between two forecast rounds is in line with other recent exercises conducted in an empirical framework, such as the IMF’s 2022 World Economic Outlook.
The fiscal forecasting model of the ECB embeds tax elasticities, which link tax receipts to macro bases. When justified, particularly for the progressive income taxes, their values exceed unity in order to capture the fiscal drag (see part 2). In some countries, discretionary measures taken to adjust the tax brackets to the high inflation are captured under the fiscal support shown in section 3.1.
For a detailed description of the model, see Gomes, S., Jacquinot, P. and Pisani, M., “The EAGLE: A model for policy analysis of macroeconomic interdependence in the euro area”, Economic Modelling, Vol. 29, No 5, September 2012, pp. 1686-1714.
To limit the substitutability between imported goods from the rest of world and euro area tradable goods, the elasticity has been lowered to take into account euro area countries’ high dependency on commodities imports.
Simulations of a shock of the same size that is fully expected by economic agents show a lower negative impact on GDP and therefore a less unfavourable impact on the debt-to-GDP ratio.
As there is no risk of inflation expectations de-anchoring, the model does not factor in the negative macro impact of persistently higher inflation. Therefore, the positive effect on real activity should be seen as an upper bound of its expected positive effect.
Alternative simulations have been performed using two other models: Basic Model Elasticities (BMEs) and the ECB-BASE. The BMEs summarise the effects of changes in assumptions (including fiscal assumptions) on macroeconomic variables. Their advantages and limitations are discussed in more detail in ECB, “A guide to the Eurosystem/ECB staff macroeconomic projection exercises”, July 2016. For details on the ECB-BASE model, see Angelini, E., Bokan, N., Christoffel, K., Ciccarelli, M. and Zimic, S., “Introducing ECB-BASE: The blueprint of the new ECB semi-structural model for the euro area”, Working Paper Series, No 2315, ECB, September 2019. In these models, particularly in the ECB-BASE, the effects on HICP inflation are somewhat stronger than those shown in Chart 5.
The authors would like to thank Simeon Bischl for his valuable research assistance and contribution to this box.
See the box entitled “Who foots the bill? The uneven impact of the recent energy price shock”, in this issue of the Economic Bulletin. On the concept of energy poverty, see Faiella, I. and Lavecchia, L., “Energy poverty. How can you fight it, if you can’t measure it?”, Energy and Buildings, Vol. 233, February 2021.
The full analysis using an extended version of EUROMOD and consumer survey data is presented in Amores, A. et al., “The distributional impact of fiscal measures to compensate consumer inflation”, Occasional Paper Series, ECB, forthcoming.
Other factors contributing to disposable household income growth are government measures not directly linked to inflation, such as changes in income tax rates or brackets, and changes to benefits.
See the box entitled “The impact of the recent rise in inflation on low-income households”, Economic Bulletin, Issue 7, ECB, 2022.
Given that energy accounts for a greater share of consumption in the lower-income quintiles, price measures reduce quintile-specific inflation more for these households than for households in higher-income quintiles. In absolute terms, however, higher-income quintiles may benefit more from price measures than lower-income quintiles as they consume more energy overall.
For more information on consumption inequality, see Attanasio, O.P. and Pistaferri, L., “Consumption Inequality”, Journal of Economic Perspectives, Vol. 30, No 2, 2016, pp. 3-28.
ECB, “Monetary Policy Statement”, 15 December 2022.