

Guaranteeing freedom of payment choice: access to cash in the euro area
Guaranteeing freedom of payment choice: access to cash in the euro area
Published as part of the ECB Economic Bulletin, Issue 5/2022.
The Eurosystem is committed to the principle that every individual in the euro area should be able to decide how to make day-to-day payments, regardless of their individual payment preference, geographical location or technological savviness. On the basis of the ECB’s most recent data, despite the gradual decline in cash transactions, cash is the most popular payment instrument among euro area citizens for day-to-day transactions at the point of sale or person-to-person payments. In addition, cash is used for savings and liquidity, especially in times of crisis or uncertainty. Satisfying demand for cash requires a sophisticated physical infrastructure involving central banks and private intermediaries in the distribution of banknotes and coins to both citizens and businesses. However, as seen in other economies, a decline in the use of cash for payments may lead to a reduction in the cash services provided by credit institutions. This can in turn make it more difficult or costly to withdraw cash, especially for vulnerable groups or those living in geographically remote areas, who sometimes have no access to other means of payment. To help prevent this situation, the Eurosystem carefully monitors the development and extent of cash services in the euro area and analyses current measures to counter any deterioration in cash services in a timely manner. The Eurosystem does this as part of its responsibility to ensure freedom of payment choice and access to cash for all citizens. This article looks at the issue of access to cash (Section 1), recent trends in cash access points (Section 2), ways to measure access to cash (Section 3) and initiatives to guarantee access to cash (Section 4).
1 Why is access to cash important?
Cash is the payment instrument most frequently used by euro area citizens, but its declining use in transactions may lead to changes in the cash infrastructure that reduce citizens’ access to cash. In 2019 around three out of four transactions at the point of sale in the euro area were made in cash.[1] However, in recent years there has been a declining trend in the use of cash[2] (which accelerated during the coronavirus (COVID-19) pandemic)[3]. In parallel, there has been a decrease in the number of bank branches per inhabitant throughout the euro area. The number of automated teller machines (ATMs) per inhabitant has slightly increased, partly offsetting the bank branch closures. However, in some euro area countries, such as Belgium and the Netherlands, the network of ATMs has also shrunk. There is a relationship between the decline in the use of cash for day-to-day transactions and the decrease in the number of cash service points. On one hand, reduced transactional use of cash puts pressure on private-sector providers to reduce cash-related costs (e.g. by closing cash service points which are no longer profitable) or to increase revenues (e.g. fees) related to cash services. This is because the cash infrastructure involves substantial fixed costs, meaning that lower cash use increases per-unit costs. On the other hand, fewer cash access points may increase the effort it takes for citizens to obtain cash, which could further reduce demand and add to the pressure to reduce cash service points. This second effect may not be very strong at present in the euro area, but in the future the cash infrastructure could deteriorate to a point where the availability of cash affects payment choice.
The consequences of a weakened cash infrastructure are more visible in countries where cash use has decreased faster and the need for initiatives to guarantee access to cash has become more evident. A prominent example is Sweden, which has seen a marked decline in the use of cash.[4] Many bank branches in Sweden now refuse to handle cash, many retailers are accepting cashless payments only, and even some basic services will not take cash (for example, hospitals have refused cash payments from patients).[5] In addition, the potential lack of a non-digital fall-back system in case of system failure is perceived as a real risk. Some of these developments have led to a strong negative reaction among sections of the population and prompted discussions among politicians of all parties aimed at finding legislative solutions (see Section 4).
If such trends were to occur in the euro area, they could adversely affect many euro area citizens who prefer to use cash or simply want cash as a payment choice or savings option. As digitalisation has driven improvements in many areas of daily life, it is often taken for granted that a “cashless economy” would be beneficial for all segments of society. Some observers have advocated measures to restrict the use of cash (e.g. promotion of digital payments or strict cash payment limits). However, in these discussions the perspective of cash users is often overlooked, or the benefits they derive from cash are underestimated. Recent assessments of specific policies that restrict the use of cash have found that, in some settings, the costs of these policies outweigh their social benefits.[6] In the euro area, the large numbers of citizens who prefer to use cash in transactions do so for different reasons. For example, survey data show that many consumers use cash because it provides a clear overview of expenses.[7] Citizens also mention additional reasons to use cash for payments, such as its widespread acceptability, ease of use, speed, safety and anonymity.[8] Consumers also tend to prefer cash to digital means of payment in certain circumstances. For example, cash is overwhelmingly preferred when making low value payments or in certain locations (such as shops or restaurants), and it is used more often in rural areas.[9] Surveys also show that a majority of citizens in the euro area would still like to have the option to pay with cash, even if some of them report that they have a preference for digital means of payment.[10] In addition, estimates suggest that cash is increasingly used as a safe haven asset in both normal times and times of crisis, both inside and outside the euro area.[11] In summary, the behaviour of many citizens indicates that cash provides them with added value compared with other means of payment or other savings options, and hence they would be negatively affected by reduced access to cash.
Furthermore, the loss of access to cash would have a greater effect on citizens who cannot use other means of payment and are at risk of financial exclusion.[12] Around 13.5 million people in the euro area are unbanked (i.e. have no bank account or access to financial services) and largely rely on cash to make payments independently. An even greater number of individuals are underbanked, meaning that they do have a bank account, but lack convenient access to financial services. Regarding the specific issue of access to cashless means of payment, ECB survey data show that in 2019 around 2% of euro area citizens over 18 years old had no access to cashless payment methods and hence relied solely on cash or on other people to make payments.[13] This percentage is higher for certain population groups, such as those aged 65 or over (3%), those with only primary or secondary education (4%), or those from certain countries, such as Cyprus, Greece or Malta (around 10%). Against this background, central banks around the world have shown renewed interest in ensuring financial inclusion by providing widespread access to central bank money. As one of the new policy options, some central banks are considering introducing central bank digital currencies (CBDCs) which would be available to the public.[14] However, a divide exists between people who are increasingly using digital means of payment and others who cannot use them or are reluctant to adopt them. As there are several sources of financial exclusion, digital solutions may help in some settings, but some analysts argue that, in certain contexts, ensuring widespread availability of cash may be more effective in preventing exclusion than other strategies.[15] Consequently, it is important to also explore solutions that ensure that cash remains accessible and accepted. In the euro area, these considerations are in line with the general position of the Eurosystem regarding the introduction of a digital euro, which, like cash, would be a form of central bank money backed by the Eurosystem.[16] If a digital euro is introduced, the Eurosystem has stated that it would not replace cash but complement it.
For the above reasons, the Eurosystem’s cash strategy[17] establishes a commitment to support cash and its related infrastructure to ensure access to cash. At present, the overall situation of access to cash in the euro area does not raise any concerns.[18] However, experience in countries in which cash use has strongly declined shows that public authorities and central banks should remain vigilant about evolving problems with access to cash. To prevent such problems and guarantee citizens’ freedom to choose how to pay, and to prevent the financial exclusion of certain social groups, the Eurosystem’s cash strategy aims to ensure widespread availability of, access to and acceptance of euro banknotes and coins.
2 Cash access points in the euro area
Analysing the cash access points available to citizens and businesses is key to assessing access to cash in a territory. Supplying cash to citizens entails a sophisticated infrastructure and distribution system involving several players, such as banknote printing works, central banks, cash-in-transit companies and credit institutions. But members of the public only interact with the last link in the supply chain – cash access points, such as ATMs and bank branches – where they can withdraw and deposit cash.
In the euro area, the overall number of cash access points is decreasing, although trends vary across countries. Chart 1 shows the number of traditional cash access points (bank branches and ATMs) per 100,000 inhabitants in selected euro area countries. Although there seems to be a clear declining trend in the number of bank branches per 100,000 inhabitants on average in the euro area, the number of ATMs per 100,000 inhabitants slightly increased over the period 2016-20. This is because some countries are resisting a downsizing of their ATM network (e.g. Germany) or even increasing it (e.g. Italy and Austria). A related general trend is towards a greater share of cash recycling machines (CRMs), i.e. more modern ATM machines which allow customers to deposit banknotes and which recycle banknotes deposited by customers in previous transactions. These machines are used by banks and other cash handlers to partly offset the reduction in cash services provided by branches at their counters and in the number of ATMs that only dispense banknotes.
Chart 1
Cash access points per 100,000 inhabitants in selected euro area countries, 2016-20
(per 100,000 inhabitants)

Sources: ECB and World Bank.
Notes: ATMs include all types of customer-operated cash machines (cash dispensers and machines with deposit functionality, some of which also recycle banknotes deposited by customers in previous transactions after conducting mandatory authenticity checks). Data on bank branches and ATMs (the numerator) are from the ECB, while population data (the denominator) are from the World Bank.
The main reasons for the decline in the number of cash access points include supply-side factors (such as banks’ cost-reduction strategies or the increasing digitalisation of banking services) and population trends. Despite the major social and economic implications of the closure of cash access points,[19] there has been little research into the drivers of this trend, although some of them have been identified. As shown in Chart 1, France and the Netherlands are clear examples of reductions in both bank branches and ATMs. In these countries, general economic conditions put pressure on banks to cut costs, leading to the closure of less profitable bank branches or those that were located near other branches.[20] As with most other countries shown in Chart 1, the bank branch rationalisation was stronger than the decline (if any) in ATMs. This is also partly due to banks’ new cost-cutting strategies. For example, qualitative surveys of euro area banks conducted by the Eurosystem suggest that some are “nudging” customers away from bank counters towards automated cash services provided via ATMs. This means that the reduction in cash services traditionally offered by bank branches is at least partly offset by the installation of new ATMs in branches or in other locations where demand for cash is high (e.g. shopping centres, airports). The reduction in cash access points may also be due to depopulation in remote areas or the decline in opportunities to use cash as businesses close or migrate to more densely populated locations.[21]
However, a decrease in the number of traditional cash access points does not necessarily imply reduced access to cash. Although a decline in traditional cash access points means that citizens have fewer locations where they can withdraw and deposit cash, a more detailed analysis is needed to assess whether access to cash is still adequate. First, access to cash is mainly a geographical problem; hence the precise location of cash access points should be factored in. It could be that closures mostly occurred in areas where cash access points were previously too close together and would therefore have had little impact on the availability of cash for citizens. Conversely, if closures happened in geographical locations where there are no other options for accessing cash, citizens in those areas would have been adversely affected. Second, alternatives to traditional cash access points, e.g. access provided by retailers and post offices, may have proliferated. This could partially offset the decline in traditional access points. Finally, the fees charged for cash services are also important. For example, increasing fees for cash withdrawals from commercial banks would effectively worsen cash access. The following section looks at how to define, measure and analyse the issue of access to cash.
3 Measuring access to cash
To assess whether access to cash is adequate, central banks and governments need to design and produce proper metrics and analyse all relevant factors. Metrics should include density of cash access points and consider their geographical proximity to citizens. As problems with access to cash may be visible only at the local level, metrics should be produced at the highest levels of disaggregation possible. Other factors, such as direct costs borne by citizens or the risk of exclusion of vulnerable populations, should also be monitored. The following subsections explain the main elements in measuring access to cash.
Key elements in measuring access to cash: two different problems
The issue of access to cash can be sub-divided into two separate problems: (i) the distance or coverage problem and (ii) the capacity problem. The distance or coverage problem refers to the question of whether a large share of the population is sufficiently close to a cash access point. For example, if most citizens in a region are within 5 km of a cash access point, analysts or regulators might consider access to cash to be adequate. However, there is no one-size-fits-all definition of adequate coverage, as individual circumstances may vary. For example, a 10 km distance may be unproblematic for an individual if the cash access point is on their daily route to work, while a 3 km distance could be problematic for someone without adequate transport.[22] Hence, additional measures should be considered to further analyse the problem of access to cash. The capacity problem supplements the coverage problem, as it refers to the number of points of access to cash needed in each location to meet the demand for cash. For example, in densely populated areas or areas where demand for cash is strong, a single ATM may theoretically cover a large share of the population but may not be sufficient to meet demand, and additional ATMs should be installed in the same location. Thus coverage and capacity are equally important when assessing whether access to cash is adequate.
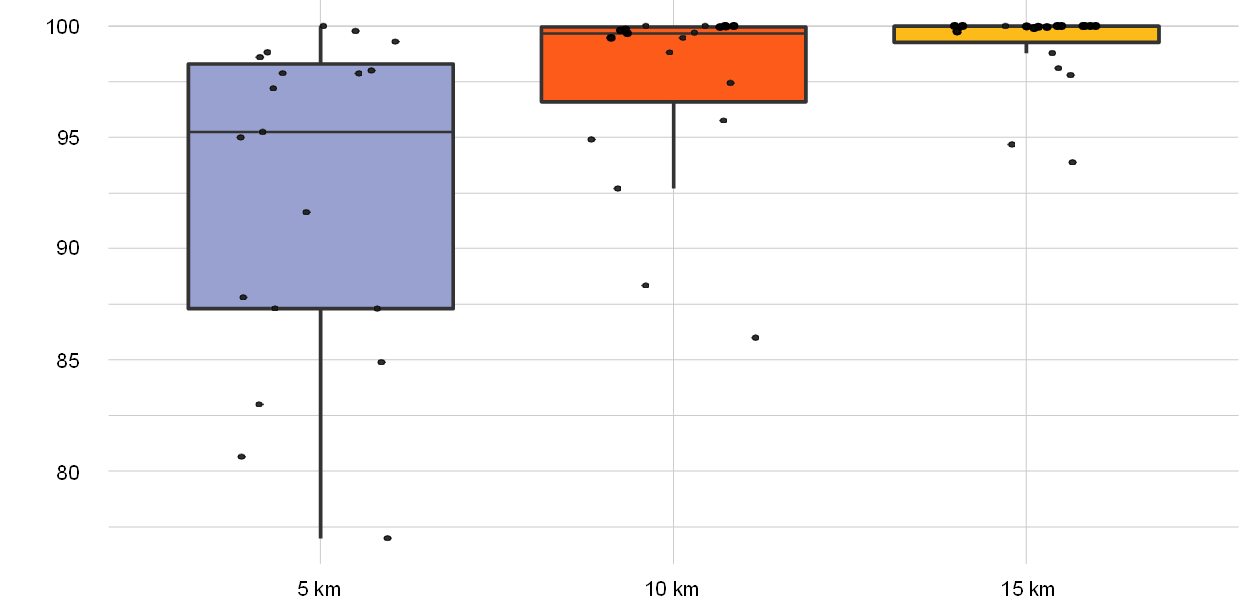
Given the importance of the distance problem, the Eurosystem has recently conducted an analysis of this aspect in each euro area country following a common methodology. For all euro area countries, central banks estimated the average share of the population with a cash access point within 5, 10 and 15 km of their residence, measured in a straight line.[23] Although specific country results cannot be disclosed, Chart 2 illustrates the situation in the euro area by depicting the distributions of the euro area country results for each of the three distances at the national level. It uses boxplots for the three metrics and black dots for the individual observations for the 19 euro area countries. Results are satisfactory overall in the euro area, but the share of the population covered by cash access points is uneven across countries. The share of people living within 5 km of the nearest cash access point ranges from 77% in the country with the lowest coverage to 100% in the country with highest coverage. The lower bound of population coverage increases to 86% when the radius is increased to 10 km and 93% when it is increased to 15 km. At 5 km, between 87% and 98% of the population is covered in around half of the countries (depicted by the blue boxplot, which illustrates the interquartile range), and the median coverage (black line crossing the blue rectangle) is over 95%. At 10 km (orange boxplot) and 15 km (yellow boxplot), the share of population covered increases in most countries. At these distances, the interquartile range and the median are closer to 100%. As the radius increases, observations also tend to cluster around the higher values (higher than 95% at 10 km and higher than 98% at 15 km).
Chart 2
Share of population within 5, 10 and 15 km of the nearest cash access point
(percentages)
Source: ECB/Eurosystem.
Notes: Using different straight-line distances, the chart illustrates in an anonymised manner the variation across euro area countries of the national average shares of the population covered by the nearest cash access point in 2020. The boxplots for the three metrics show the observations for the individual euro area countries as black dots. The coloured rectangles represent the interquartile range (i.e. central half of the data points), while the black line crossing each rectangle represents the median. The vertical lines extending from the boxes (whiskers) indicate the maximum and minimum values of the dataset excluding outliers (i.e. excluding data points significantly distant from other observations).
Box 1
Applying location science to optimise population coverage from a public interest perspective
Despite the increasing importance of the distance or coverage problem in the assessment of access to cash, central banks and public authorities have as yet no analytical tool to determine whether the current distribution of cash access points is optimised from a public interest perspective, i.e. whether it covers the largest possible share of the population, subject to certain constraints (such as the current number of cash access points per inhabitant). This is an important policy issue, as cash needs to be accessible for all the population, but in some circumstances it may not be economically viable to provide cash access points in all municipalities. Therefore, the number of locations with cash access points may need to be limited.
To address this issue, the Eurosystem has developed an internal model to compare the current network against a theoretical network which achieves maximum coverage. The model was used, for example, for a euro area region (a region at the third, i.e. most detailed, level of the EU’s NUTS classification system) with 160 cash access points per 100,000 inhabitants in 2020. In this region, coverage was relatively low, as only 81% of the population was within 5 km of the nearest cash access point. This contrasts with the optimised outcome produced by the model, according to which, even with 5% fewer cash access points per inhabitant, it would have been possible to design the network in such a way that 99% of the population had a cash access point within 5 km. Thus the model further highlights the importance of the location of cash service points when analysing access to cash.
This facility location model[24] is designed to optimise the provision of cash to satisfy a dispersed population. The model has two separate objectives: (i) to minimise the (straight-line) distance between cash access points and locations with populations and cash-intensive outlets (such as municipalities or other local administrative units); and (ii) to maximise the coverage of the network, i.e. to ensure that the largest possible share of the population has a cash access point within a given distance. The result is a theoretical network that achieves maximum coverage.
The model focuses on only one of the dimensions of access to cash discussed in the main text, i.e. how to improve coverage based on a given number of cash access points. Other relevant considerations (such as the capacity problem, which is discussed below, or cost efficiency) and different methodologies used to measure distance (such as road distance or travel time distance) are not considered in the model. The results of the model therefore need to be interpreted in the light of other analysis, but they do provide insights into one of the main topics of current policy discussions on access to cash – the coverage problem.
Using the insights provided by location science, central banks could engage at the local level with private providers and public administrations to improve population coverage. For example, they could target specific locations which appear to be underserved by commercial banks. In the example given above, the model showed that a region with relatively low access to cash has significant potential to increase its coverage (from 81% to 99%), even with fewer cash access points. This could be used to increase the efficacy of some innovative solutions developed in previous years (e.g. alternative solutions provided by the market, such as cash-back, mobile branches and cash access points with public-private cost-sharing). These findings could be useful to central banks currently considering access to cash measures or in discussions with private and public stakeholders.
The second problem – whether the capacity of the network is adequate – means that not only the location but also the number of cash access points needed to meet demand in each area must be considered. A preliminary analysis of the capacity of the network can be performed by simply relating the current number of cash access points to the population. Chart 1 in Section 2 provided an example of how the number of traditional access points (bank branches and ATMs) has developed over time in the euro area and in selected euro area countries. Moreover, in 2020 the Eurosystem conducted a data collection exercise to determine the number of ATMs per 100,000 inhabitants in all euro area countries. As with the coverage metrics described above, results differed significantly across countries, ranging from 30 to 134 ATMs per 100,000 inhabitants. The wide variation suggests that this simple measure is not the most informative for an assessment of adequate access to cash, as it assumes a uniform distribution of points of access within a country’s territory and across its population. In addition, some countries with low ATM density have high coverage metrics and, according to surveys, high levels of satisfaction regarding ease of access to cash (see the paragraph below). To improve the assessment of these simple metrics, analysts must factor in geographical considerations (e.g. assess the situation using the highest possible level of disaggregation, such as municipalities) and consider the demand for cash access points. As demand for cash access points is not directly observable, it needs to be estimated on the basis of a set of factors which predict the demand for cash. According to the literature, these variables include the number of cash-intensive locations nearby (supermarkets, shops, restaurants, etc.), socioeconomic variables (income, education, age, rurality, financial literacy, etc.) and behavioural factors (e.g. a self-reported preference for cash).
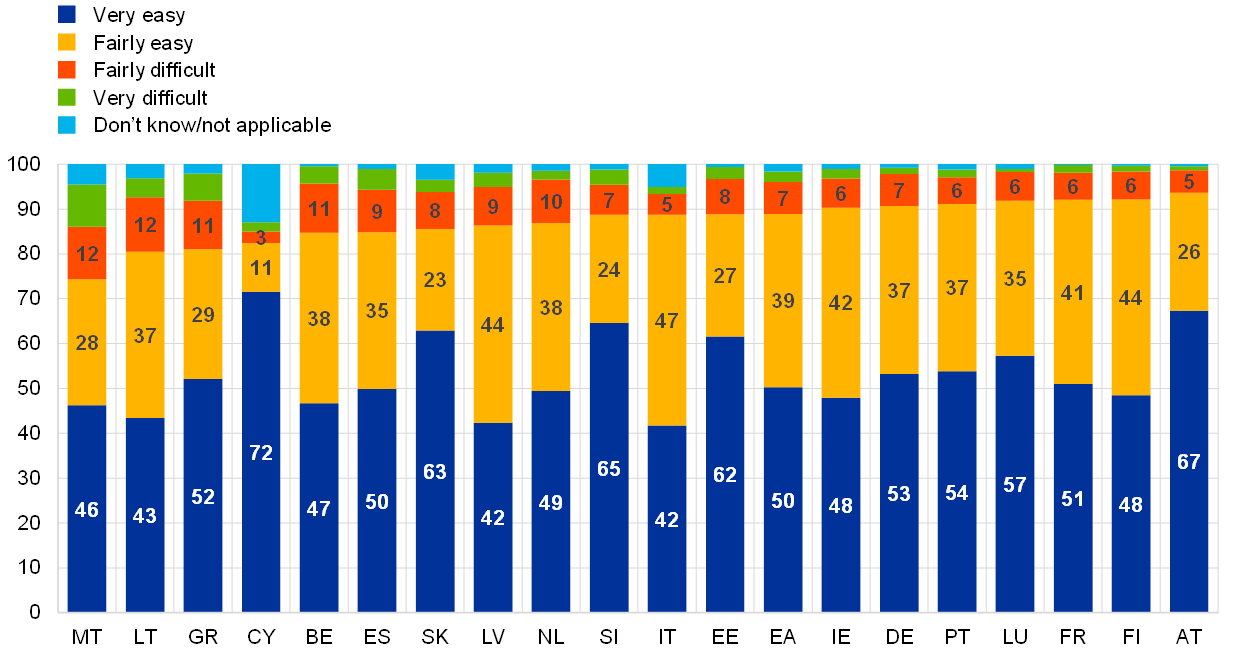
The above coverage and capacity metrics need to be supplemented by survey data on consumers’ perceived ease of access to cash. Although preferences are subjective and each citizen perceives ease of access differently, assessing self-reported satisfaction can provide additional insights.[25] Chart 3 shows how citizens in euro area countries rated ease of access to ATM withdrawals in the euro area in 2019. In general, citizens in most countries considered it easy (“very easy” or “fairly easy”) to access an ATM. On average in the euro area, 89% of respondents found it easy to obtain cash from an ATM. Only about one in ten respondents considered access to an ATM to be “fairly difficult” (7%) or “very difficult” (2%). The countries with the highest share of respondents who deemed access to ATMs to be difficult were Malta (21%), Greece (17%), Lithuania (16%) and Belgium (15%).
Chart 3
Perceived ease of access to ATMs by country
Share of respondents perceiving access to ATM withdrawals as “very easy”, “fairly easy”, “fairly difficult” or “very difficult”
(percentages)
Source: ECB SPACE survey.
Note: Countries are shown in ascending order of perceived ease of access to ATM withdrawals (share of respondents perceiving access as “very easy” or “fairly easy”). “EA” stands for the euro area.
Access vulnerability and the robustness of the cash access point network
In addition to measuring the different dimensions of access to cash, it is worth analysing how citizens would be affected if further cash access points were to close in the future. Some central banks are analysing the vulnerability of access to cash and the robustness of the current network of bank branches and ATMs. For example, it is possible to simulate the number of citizens that would be affected if their nearest ATM were closed, as well as the impact of this closure in terms of the additional distance to the next nearest ATM. Box 2 provides an example of this type of analysis. Another approach is to develop measures combining supply and demand factors to define vulnerability of access to cash and estimate the share of population which may be vulnerable.[26] These assessments could help authorities and central banks to anticipate the negative consequences of further closures of cash access points and allow them to take appropriate measures in good time.
Box 2
Findings of a study on ATM access in Austria
Since 2020 the Oesterreichische Nationalbank has been keeping track of the geographical distribution of ATMs in Austria, shedding light on people’s access to cash by conducting granular spatial analyses. These analyses allow ATM access in different parts of the country to be quantified. They also highlight areas where people have to travel greater distances to reach an ATM, and allow changes in ATM access over time to be monitored. The focus is on ATMs as they are the most important cash access points for Austrian residents.
The methodology relies on a 100 m by 100 m geographical grid of Austria. The travel distance to the nearest ATM is computed for each populated grid cell. The distances reflect the shortest travel routes (in terms of distance) based on the Austrian road system (as opposed to straight-line distances) for two modes of transport (by car and on foot). Finally, using data on people’s main residences and aligning these data with the geographical grid allows population-weighted summary statistics to be computed for different levels of agglomeration (such as municipalities or provinces).[27]
Spatial analyses: main findings
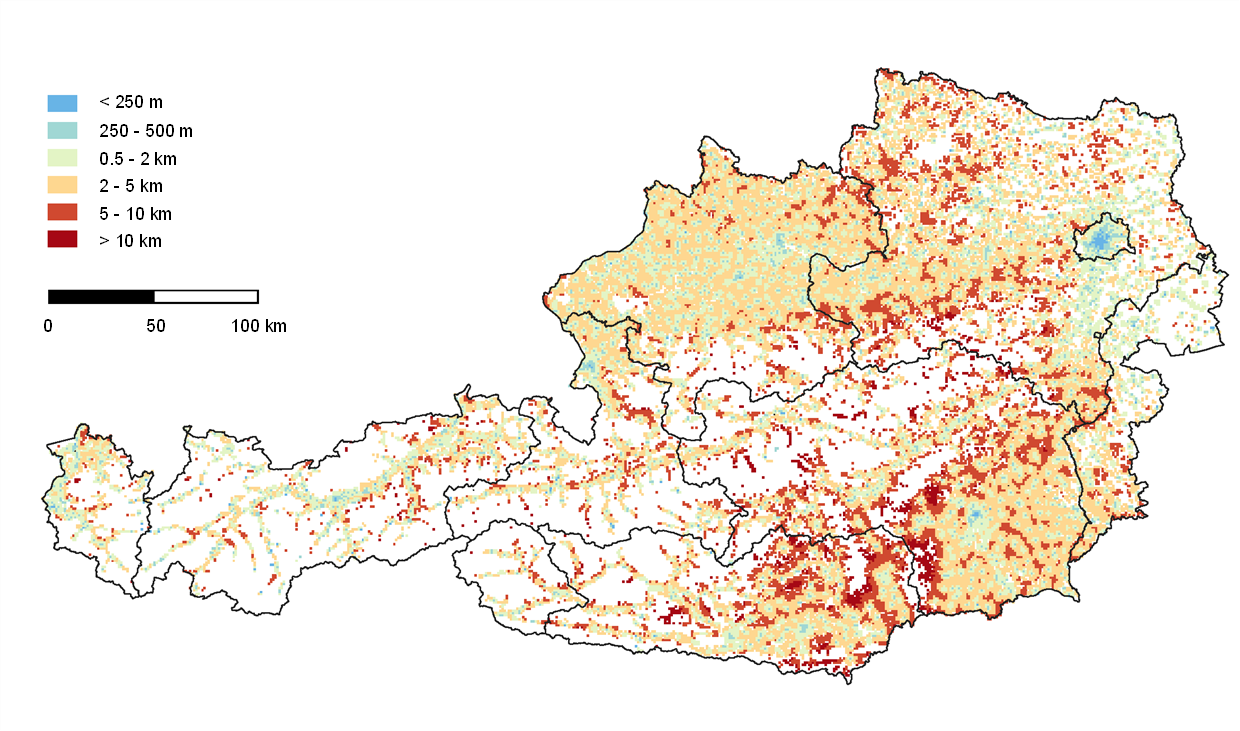
- The findings are that the median distance and the mean distance to the nearest ATM are 0.6 km and 1.2 km respectively. Four out of ten Austrian residents have to travel a distance of less than 500 m to reach the nearest ATM; slightly above two-thirds have an ATM within 1 km of their home.
- However, areas where travel distances are longer have also been identified. For example, 2.8% of the Austrian population have to travel more than 5 km to withdraw cash from their nearest ATM; in most cases, these residents live in small rural municipalities.
Figure A
Average distance to nearest ATM
Sources: Statistics Austria and Oesterreichische Nationalbank.
Notes: Figure A illustrates average distances to the nearest ATM (as at the end of 2020). For better visualisation, results have been aggregated to 1 km by 1 km grid cells. The redder (bluer) the colour of a grid cell, the longer (shorter) the average distance is. Unpopulated areas are shown in white.
In addition, a “vulnerability analysis” was conducted which analysed how people’s access to cash would be affected if local ATMs ceased to operate. For this analysis, it was assumed that for each grid cell, the nearest ATM location is closed, requiring people to travel to the next nearest ATM. This purely hypothetical exercise serves the purpose of identifying, at a granular spatial level, areas which would see substantial increases in travel distances if the nearest ATM were to shut down.
Vulnerability analysis: main findings
- For about 82% of the population, travel distances would increase by less than 1 km if the nearest ATM location closed.
- 8% of the population live in areas where they would have to travel more than 3 km further to reach the next nearest ATM. This is the additional distance chosen (arbitrarily) to define “vulnerable areas”.
- Vulnerable areas can mainly be found in rural municipalities with just one ATM location and/or in municipalities with less than 3,000 inhabitants.
- Vulnerable and non-vulnerable areas are fairly similar to each other with respect to the age structure of inhabitants, the availability of public transport and per capita income.
- Overall, the results suggest that a large share of the Austrian population has access to an ATM within a fairly reasonable travel distance of their homes. However, granular analyses also allow areas where ATM access is limited and/or areas where the closure of an ATM might lead to longer travel distances to be identified. On a methodological note, the use of actual road network distances (as opposed to straight-line distances) is important given Austria’s topography and settlement structure. Straight-line distances would underestimate the share of Austrian residents who need to travel longer distances.
Cost of accessing cash: commercial bank fees
Commercial banks’ fees for cash services are the most visible cost borne by consumers and have a negative impact on effective access to cash. Inadequate access to cash – as measured by coverage and capacity metrics – increases implicit costs in terms of time and effort (also known as “shoe-leather” costs). However, increasing fees may have even more impact on consumers’ perceptions of cash access than a deterioration in geographical coverage. Citizens and businesses may be discouraged from using cash, or they may adapt their withdrawal and deposit behaviour, depending on what charges are imposed for cash services.
Monitoring bank fees is therefore crucial when assessing the evolution of cash access. However, data on fees for cash services have not been systematically collected in the euro area. In 2018 the Eurosystem therefore decided to develop a data collection methodology to help it monitor trends in fee policies. The data collected since 2019 show a wide variety of country-specific fee models, which in some cases are shaped by national legislation and other country-specific and industry-specific factors. Despite the heterogeneity of fee policies, the Eurosystem has designed a methodology to keep track of the most common fee elements[28] in the euro area, which helps the analysis of the year-on-year evolution of fee levels.
4 Initiatives to guarantee access to cash
While the Eurosystem is working to detect potential problems in the euro area, where access to cash is currently ensured, the need for initiatives to guarantee availability of cash has become evident in some countries where the cash infrastructure has deteriorated. As seen in Section 1, in Sweden many bank branches and retailers are refusing to handle or accept cash, and even some hospitals have rejected cash payments from patients.[29] In addition, it is perceived as a real risk that the country will soon lack a fall-back payment system in case of digital system failure or potential cyberattacks. These trends, and strong concerns expressed by members of the public, have prompted all-party political debate, which resulted in legislation in Sweden requiring certain credit institutions to ensure adequate coverage of cash services, which entered into force in 2021. In the United Kingdom, where cash use is declining rapidly, there are some initiatives to preserve access to cash. For example, UK Finance – the main trade association of the banking and financial sector – and the largest UK credit institutions have made a commitment to guarantee access to cash and preserve its infrastructure.[30] To this end, several stakeholders – including banks, the LINK cash machine network, consumer and business associations, and the Post Office – are providing new cash access points, such as free-of-charge ATMs and post office branches.[31] Among these new services, an innovative and successful initiative was to create shared “banking hubs”, i.e. locations in which several banks collaborate to offer basic cash services.
In the euro area in 2021, the Euro Retail Payments Board set up a joint initiative between bank, consumer and retailer associations and the Eurosystem to assess access to cash. The final report of the working group[32] provides an in-depth account of the overall situation as regards access to cash in the euro area. It concludes that the situation is not yet a matter of concern, but that cash services seem to be deteriorating in certain areas in some countries. It also includes a detailed overview of public and private initiatives aimed at guaranteeing access to cash.
Initiatives promoted by public authorities and central banks generally focus on the distance or coverage problem described in the previous section, i.e. whether a large share of the population does not have too far to travel to a cash access point given the current network. For example, in the Netherlands, public authorities and private stakeholders have agreed since 2007 that the straight-line distance to the nearest ATM should not exceed 5 km.[33] In Lithuania and Latvia, the central banks and financial market participants have recently signed memoranda of understanding with similar commitments.[34] Outside the euro area, central banks and authorities are establishing criteria or rules in the same spirit. For example, in Poland, Narodowy Bank Polski has prepared a national strategy in collaboration with public authorities and market players which deems that access to cash is acceptable if 90% of the population has a cash access point within 10 km.[35] Similarly, Swedish legislation establishing mandatory norms to preserve access to cash also takes geographical coverage into account when defining reasonable access to cash.[36]
The euro area private sector also has several initiatives to offset the reduction in traditional cash access points by increasing alternative cash access points. For example, credit institutions in some regions are mitigating the impact of bank branch closures by offering mobile branches or using financial agents.[37] These allow banks to provide a regular banking service in different locations without having a fixed establishment. In other countries, post offices are increasingly providing cash services. Retailers are also starting to offer cash at the point of sale when customers purchase goods (“cash-back”) or even if they do not make a purchase (“cash-in-shop”). In some regions, new providers, such as independent ATM operators, are entering the market and introducing new cash access points. These examples illustrate how the market is adapting to changes in the cash infrastructure, while acknowledging the importance of preserving access to cash.
5 Conclusion
The Eurosystem is committed to guaranteeing access to cash to preserve the freedom of payment choice and financial inclusion of euro area citizens. On the basis of the most recent ECB data, cash is the dominant means of payment in the euro area for daily transactions. Many citizens use cash as their only payment option, either by preference or because they have no access to digital means of payment. A shrinking cash infrastructure can affect the way citizens choose to pay and create barriers to the financial inclusion of vulnerable social groups. To prevent these problems, the Eurosystem is developing and using a wide range of analytical tools to define, measure and assess access to cash in times of profound and rapid change. It is paying close attention to developments and initiatives undertaken in economies where cash use has declined markedly and some parts of the cash infrastructure have deteriorated. Furthermore, the Eurosystem is vigilant with regard to possible concerns and keeps track of new initiatives to address cash access deficiencies. In summary, and in line with the goals of its cash strategy, the Eurosystem is working to ensure that cash remains widely accessible in the euro area.
See “Study on the payment attitudes of consumers in the euro area (SPACE)”, ECB, Frankfurt am Main, December 2020.
ibid. The speed of the decrease in cash use has varied across the euro area. From 2016 to 2019, the share of cash transactions decreased by 6 percentage points on average, while in some countries the decrease was sharper (e.g. in Finland and the Netherlands, at 11 and 17 percentage points respectively).
In July 2020, a few months after the start of the pandemic, around 40% of respondents of a euro area-wide ECB survey reported using cash somewhat less or much less often. However, it is still too soon to assess whether these early survey findings will translate into a lasting change in behaviour once the pandemic is over or COVID-19 becomes endemic. For the results of the survey, see Tamele, B., Zamora-Pérez, A., Litardi, C., Howes, J., Steinmann, E. and Todt, D., “Catch me (if you can): assessing the risk of SARS-CoV-2 transmission via euro cash”, Occasional Paper Series, No 259, ECB, Frankfurt am Main, July 2021.
Sveriges Riksbank has argued that the decline of cash in Sweden cannot be explained by traditional causes. Measures to curb tax evasion and a strict banknote and coin changeover in Sweden between 2010 and 2017 may partly explain the unusual decline. See “Why are people in Sweden no longer using cash?”, Payments in Sweden 2020, Sveriges Riksbank, October 2020.
See “Access to Cash Review – Final report”, Access to Cash Review, March 2019.
See, for example, Álvarez, F., Argente, D., Jiménez, R. and Lippi, F., “Cash: A Blessing or a Curse”, Journal of Monetary Economics, Vol. 125, January 2022, pp. 85-128.
See Esselink, H. and Hernández, L., “The use of cash by households in the euro area”, Occasional Paper Series, No 201, ECB, Frankfurt am Main, November 2017.
ibid.
See “Study on the payment attitudes of consumers in the euro area (SPACE)”, op. cit. SPACE survey data show that in 2019, 92% (83%) of payments below €5 (between €5 and €10) at the point of sale and between persons were made in cash.
See “Study on the payment attitudes of consumers in the euro area (SPACE)”, op. cit.
See the article entitled “The paradox of banknotes: understanding the demand for cash beyond transactional use”, Economic Bulletin, Issue 2, ECB, Frankfurt am Main, 2021.
See Panetta, F., “Cash still king in times of COVID-19”, speech at the Deutsche Bundesbank’s 5th International Cash Conference – “Cash in times of turmoil”, 15 June 2021.
See “Study on the payment attitudes of consumers in the euro area (SPACE)”, op. cit.
See Boar, C. and Wehrli, A., “Ready, steady, go? – Results of the third BIS survey on central bank digital currency”, BIS Papers, No 114, Bank for International Settlements, January 2021.
See Mancini-Griffoli, T., Martinez Peria, M.S., Agur, I., Ari, A., Kiff, J., Popescu, A. and Rochon, C., “Casting Light on Central Bank Digital Currency”, IMF Staff Discussion Notes, No 18/08, International Monetary Fund, November 2018. Survey data seem to suggest that the reluctance among segments of the population, such as older citizens, to use new financial technologies may be due to a perceived low utility of adopting new technologies. See, for example, Doerr, S., Frost, J., Gambacorta, L. and Qiu, H., “Population ageing and the digital divide”, SUERF Policy Briefs, No 270, February 2022. In this regard, some unique features of cash are not technologically replicable in digital means of payment. See “Eurosystem experimentation regarding a digital euro – Research workstream on hardware bearer instrument”, Deutsche Bundesbank, Frankfurt am Main, 2021.
See the ECB’s website for information on a digital euro.
See the ECB’s website for information on the Eurosystem cash strategy.
See “Report of the ERPB Working Group on Access and Acceptance of Cash”, Euro Retail Payments Board, November 2021.
As well as reduced access to financial services, bank branch closures may cause a reduction in local credit supply and decreased business formation. See, for example, Nguyen, H.L.Q., “Are credit markets still local? Evidence from bank branch closings”, American Economic Journal: Applied Economics, Vol. 11(1), 2019, pp. 1-32; and Ho, C.S.T. and Berggren, B., “The effect of bank branch closures on new firm formation: the Swedish case”, The Annals of Regional Science, Vol. 65, No 2, 2020, pp. 319-350.
See Jiménez Gonzalo, C. and Tejero Sala, H., “Bank branch closure and cash access in Spain”, Financial Stability Review, No 34, Banco de España, May 2018, pp. 35-56; and Galardo, M., Garrì, I., Mistrulli, P.E. and Revelli, D., “The geography of banking: Evidence from branch closings”, Economic Notes, Vol. 50, No 1, e12177, 2021. Since the 2008 financial crisis there has also been a process of bank mergers which may have led to the closure of branches of surviving banks that were near each other and hence redundant. However, previous research has shown that consolidation processes have not always led to bank branch closures. See Avery, R.B., Bostic, R.W., Calem, P.S. and Canner, G.B., “Consolidation and bank branching patterns”, Journal of Banking & Finance, Vol. 23, Nos 2-4, 1999, pp. 497-532; and Damar, H.E., “Does post-crisis restructuring decrease the availability of banking services? The case of Turkey”, Journal of Banking & Finance, Vol. 31, No 9, 2007, pp. 2886-2905.
See Jiménez Gonzalo, C. and Tejero Sala, H., op. cit. Previous research has shown in other contexts that population trends only weakly explain bank branch closures, as business strategies are the main driver. See Argent, N.M. and Rolley, F., “Financial Exclusion in Rural and Remote New South Wales, Australia: a Geography of Bank Branch Rationalisation, 1981-98”, Australian Geographical Studies, Vol. 38, No 2, 2000, pp. 182-203.
For an analysis of the impact of shoe-leather costs on consumers’ cash withdrawal behaviour, see Chen, H., Strathearn, M. and Voia, M., “Consumer Cash Withdrawal Behaviour: Branch Networks and Online Financial Innovation”, Staff Working Paper/Document de travail du personnel, No 2021-28, Bank of Canada, Ottawa, 2021.
The purpose of producing three different metrics is to provide a better understanding of the distance problem in each country and in the euro area as a whole. In other sectors, straight-line distance, in general, is found to provide a reasonable proxy of more realistic measures, such as road distance or travel time. See Phibbs, C.S. and Luft, H.S., “Correlation of Travel Time on Roads versus Straight Line Distance”, Medical Care Research and Review, Vol. 52, No 4, 1995, pp. 532-542; and Boscoe, F.P., Henry, K.A. and Zdeb, M.S., “A Nationwide Comparison of Driving Distance Versus Straight-Line Distance to Hospitals”, The Professional Geographer, Vol. 64, No 2, 2012, pp.188-196. However, as shown in Box 2, in some countries, such as Austria, the local topography can dictate the use of more detailed measures, such as actual road distance. Some analyses measure distances not only from homes (or local neighbourhoods) but also from centres of economic activity, such as high streets, retail centres or supermarkets. See Tischer, D., Evans, J., Cross, K., Scott, R. and Oxley, I., “Where to withdraw? Mapping access to cash across the UK”, University of Bristol, November 2020.
The model is based on location science, which uses a wide range of mathematical and analytical methods to determine the best location for facilities. Facility location problems have been applied to numerous settings for both private (e.g. logistical sites, retail facilities, industrial plants, bank branches) and public (e.g. police stations, hospitals) facilities. The Eurosystem’s internal model to determine optimal coverage of cash access points builds on literature such as Kisore, N.R. and Koteswaraiah, C.B., “Improving ATM coverage area using density based clustering algorithm and voronoi diagrams”, Information Sciences, Vol. 376, 2017, pp.1-20.
Some euro area central banks use survey data to monitor access to cash. See, for example, “Cash withdrawals and payments in urban and rural areas”, Monthly Report, Deutsche Bundesbank, June 2020.
See Posada Restrepo, D., “Cash infrastructure and cash access vulnerability in Spain”, Economic Bulletin, No 3, Banco de España, 2021.
Further details on the methodology can be found in Stix, H., “A spatial analysis of access to ATMs in Austria”, Monetary Policy & the Economy, Issue Q3/20, Oesterreichische Nationalbank, 2020, pp. 39-59. All results reported in Box 2 are based on 2020 year-end data. The views expressed are those of the authors and not necessarily those of the Oesterreichische Nationalbank.
The type of fees collected vary widely across euro area banks, which makes collecting fee data very complex. The elements that serve as building blocks of fee policies include, for example, surcharge and disloyalty fees (both charged as a lump-sum or as a percentage of the transaction amount), the number of free withdrawals per month, amount thresholds below or above which a transaction is free of charge, flat rates, and minimum average balances in an account required for cash service fees to be waived.
See “Access to Cash Review – Final report”, op. cit.
See Access to Cash on the UK Finance website.
See “Pivotal moment as banks, consumer groups, Post Office and LINK join forces to help protect cash services”, press release, UK Finance, 15 December 2021.
See “Report of the ERPB Working Group on Access and Acceptance of Cash”, op. cit.
See “Towards a New Vision on Cash in the Netherlands – Final Report of the NFPS Task Force for the revision of the NFPS’s position on cash”, National Forum on the Payment System, May 2020.
See “Memorandum of Understanding for Ensuring Access to Cash in Lithuania”, Lietuvos Bankas, 21 June 2021; and “Financial industry agrees on ensuring access to cash”, press release, Latvijas Banka, 3 September 2021.
A summary of Poland’s national strategy for cash circulation security is available on Narodowy Bank Polski’s website (only available in Polish).
See Lag (2010:751) om betaltjänster (the Swedish Payment Services Act) (only available in Swedish).
See Jiménez Gonzalo, C. and Tejero Sala, H., op. cit.