
Key factors behind productivity trends in euro area countries
Key factors behind productivity trends in euro area countries
Published as part of the ECB Economic Bulletin, Issue 7/2021.
1 Introduction
Productivity, defined broadly as efficiency in production, plays a key role in the economic resilience and social welfare of countries.[1] Productivity growth influences the economy in important ways, affecting key variables such as output, employment and wages. Productivity is also relevant for monetary policy as it is a fundamental determinant of potential output growth and the natural rate of interest and, therefore, of the monetary policy space needed to deliver price stability over the medium term. As such, changes in productivity can influence the transmission mechanism of monetary policy and should be closely monitored.
The primary responsibility for enhancing productivity growth lies with national policies. National fiscal and structural policies can strengthen productivity growth by fostering greater efficiency in product, labour and financial markets, thereby providing the means and incentives for productive firms to thrive. High-quality education and public administration and the rule of law are also important institutional prerequisites for a competitive business environment, which in turn facilitates technological progress and increases incentives to invent and innovate. National governments therefore have ample scope to set the right framework conditions and incentives for productive investment and innovation decisions that determine long-term productivity growth. Cyclical polices, including monetary policy, may also support productivity growth under certain circumstances by increasing demand and stimulating investment.
Global trends, such as population ageing and the slowdown in the pace of globalisation, have a bearing on productivity developments. Globalisation can increase productivity growth through a variety of channels, namely: i) enhancing export opportunities and market competition;[2] ii) promoting “learning by exporting”;[3] iii) increasing the variety and quality of production inputs;[4] and iv) improving the allocation of resources across firms.[5] Regarding euro area population ageing, empirical evidence shows that workers’ physical abilities and innovativeness decline with age, as does the speed with which they adapt to new technologies.[6] As population ageing causes the share of older workers in the labour force to rise, the above might have negative effects on overall productivity. There are, however, some counterbalancing factors, including increased longevity, more healthy years of life and higher education levels among the older population.
This article looks at the key factors behind productivity developments over recent decades in the euro area. The article summarises the new insights provided by a report drafted for the ECB’s strategy review that documents productivity trends and drivers over the past few decades.[7] For a more complete picture, we refer the reader to the full report, which draws from the extensive literature on productivity drivers, existing work within the European System of Central Banks (ESCB), and new analysis. The article is complemented by Box 4 in this issue of the Economic Bulletin, which presents preliminary evidence on the impact of the (coronavirus) COVID-19 pandemic, and of policy responses to it, on productivity.
The article has five sections. Section 2 introduces the most important productivity-related stylised facts, using macroeconomic and sector-level data to set the context. Section 3 uses firm-level data to discuss the key drivers behind productivity growth, distinguishing between those affecting within-firm productivity growth and those affecting the allocation of production factors across firms. Section 4 focuses on the interplay between monetary policy and those drivers of productivity growth. Section 5 offers a few concluding remarks.
2 Key productivity developments in the euro area
This section presents three stylised facts related to productivity growth in the euro area.
First, aggregate labour productivity growth has been trending downwards for decades, both in the euro area and in other major economies. Average annual growth in labour productivity – measured as real GDP per hour worked – in those euro area countries that have sufficiently long time series has continuously declined from about 7% in the 1960s to just 1% since the early 2000s (Chart 1). This decline results from a variety of interacting factors, including global, country-specific, sector-specific, structural and temporary factors, as well as events with potential scarring effects on productivity and potential output growth, such as the global financial crisis (GFC).
Chart 1
Trends in labour productivity (GDP per hour worked) growth in selected euro area countries and the United States
(smoothed annual percentage change)
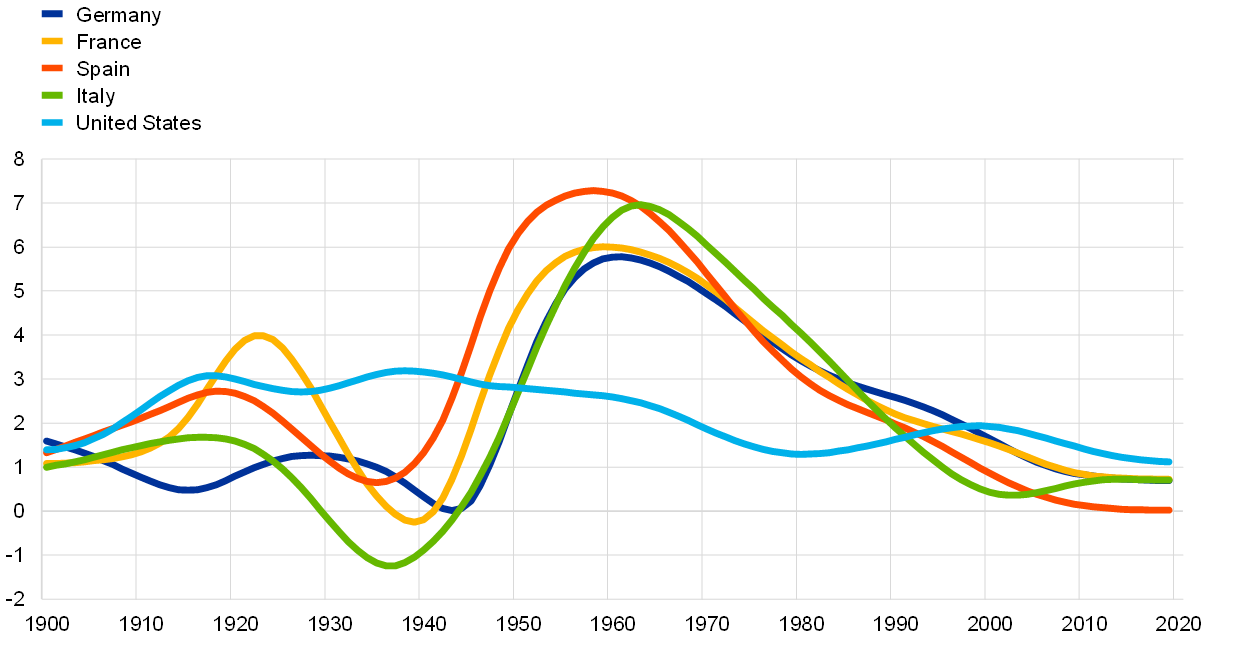
Sources: Own calculations based on Bergeaud, A., Cette, G. and Lecat, R., “Productivity Trends in Advanced Countries between 1890 and 2012”, Review of Income and Wealth, Vol. 62, No 3, 2016, pp. 420-444.
Note: The trend is calculated using a Hodrick-Prescott filter with a smoothing parameter lambda of 10.
Second, on average across years and countries, total factor productivity (TFP) growth accounts for about 60% of labour productivity growth. By decomposing growth in GDP per hour worked in the 12 countries that adopted the euro in 1999 (EA-12)[8] into capital deepening, capital capacity utilisation and TFP growth, we find that, from 1995 to 2019, TFP growth accounted for about 60% of labour productivity growth on average (Chart 2 – left panel).[9] The contribution of TFP growth, however, has declined over time (from 68% in the period 1995-2001 to 55% in 2014-19). Capital deepening, defined as the change in capital per hour worked, accounted on average for about 40% of labour productivity growth. That average masks a very high contribution during the GFC as a result of the large drop in total hours worked, and a very small negative contribution during the post-GFC period owing to weak investment and employment recovery. Although the average contribution of capacity utilisation over the whole period is rather small, it plays an important role during specific periods. The picture is similar for the United States (Chart 2 – right panel).
Chart 2
Contributions to growth in GDP per hour worked in EA-12 and the United States, different periods
(percentage points)

Sources: Own calculations based on data from AMECO, Eurostat and (for the United States) the Board of Governors of the Federal Reserve System.
Note: “EA-12” refers to Belgium, Germany, Ireland, Greece, Spain, France, Italy, Luxembourg, Netherlands, Austria, Portugal and Finland. The periods analysed in this article, if possible given data availability, are the pre-euro years (1995-2001), the pre-GFC period (2002-2007), the GFC and sovereign debt crisis (2008-2013) and the post-GFC period (2014 onwards).
Third, intra-sector dynamics, rather than resource reallocation across sectors, explain a large part of aggregate labour productivity growth. Over time the relative importance – be it in terms of employment or value added share – of the different sectors of activity changes as a result of structural change or sector-asymmetric shocks. To the extent that productivity growth differs across sectors[10], this change in their relative importance can drive aggregate productivity growth. To gauge the importance of cross-sector reallocation of resources for aggregate productivity growth, we use a shift-share analysis and decompose aggregate productivity developments in three parts: first, the “intra-industry effect”, which describes the part of productivity growth that results from sector productivity growth, assuming no change in sector weights; second, the structural “shift effect”, which describes the impact of changes in sector weights, measured by sectoral employment shares, on aggregate productivity growth, keeping the productivity of each sector constant; and third, the structural “interaction effect”, which captures the interrelation between sectoral productivity growth and changes in sectoral employment shares. The sum of the “shift effect” and the “interaction effect’ approximate the impact of structural change on productivity growth. We find that, on average over the period 1995-2017, the contribution of structural change to annual labour productivity growth was negative and very small (Chart 3 – left panel).[11] This implies that aggregate labour productivity growth has mainly been driven by intra-sector dynamics. This is in line with results from the United States (Chart 3 – right panel) and in related literature.[12] Nevertheless, the impact of sectoral reallocation on productivity might be substantial in certain periods in certain countries, as was the case in the 20th century when agriculture lost weight to manufacturing, or during the GFC given the disproportionate effect that the crisis had on some low-productivity sectors, such as construction.[13]
Chart 3
Shift-share analysis of labour productivity growth, euro area vs. the United States
(percentage points)
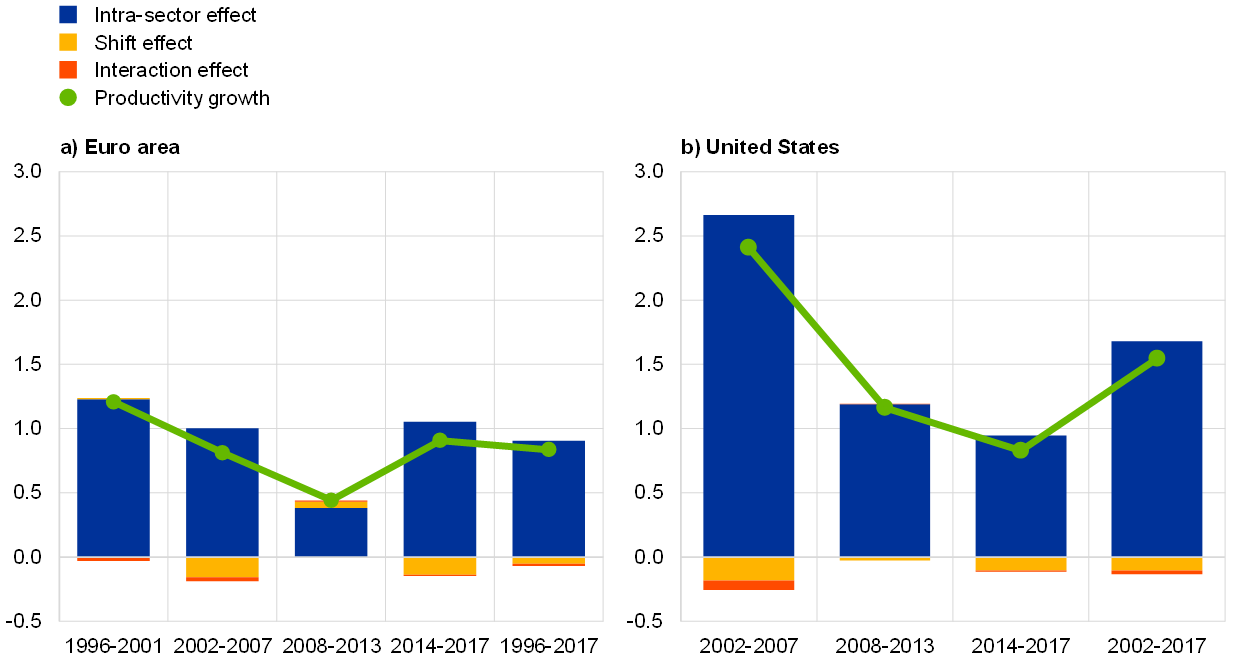
Sources: Own calculations based on Eurostat and EU-KLEMS, using NACE two-digits data.
Notes: The euro area aggregate includes 14 countries owing to data availability (BE, DE, GR, ES, FR, IT, CY, LT, NL, AT, PT, SI, SK and FI). Agriculture, forestry and fishing (NACE A), mining and quarrying (NACE B), real estate (NACE L), public sector (NACE O-Q) and extraterritorial organisations and bodies (U) are not covered.
3 Microeconomic drivers of sector productivity growth
The previous section showed that the dynamics of euro area aggregate productivity are driven by intra-sector developments. This section explores the microeconomic drivers of sector productivity growth.
Sector productivity growth depends on within-firm productivity growth and on the evolution of the market share of each firm. In organising the analysis of productivity growth drivers, it is useful to think of sector productivity as the weighted average productivity of all firms in the sector. Sector productivity could therefore be written as the sum of two components: the unweighted average of firm productivity, that is, average productivity without taking into account the market share of each firm; and the allocation of economic weight – measured in terms of employment or value added share – across firms with differing productivity levels. In this framework, sector productivity will be higher if firms become more efficient – that is, their TFP increases – by investing in productivity-enhancing activities; this increases the unweighted average productivity of firms and is referred to as “within-firm productivity growth”. Note that if investment in knowledge is complemented by investment in fixed capital – construction of new innovation facilities, for example – the capital intensity of the firm would also increase. Sector productivity will also be higher if resources are reallocated to relatively more productive firms; this increases their market share and is referred to as “dynamic allocation efficiency”. Note that resources are reallocated across firms as a result of the contraction and expansion in the size of incumbent firms (between-firm resource reallocation), but also as a result of firm entry and exit (firm demography).
The remainder of this section will discuss the euro area drivers and trends related to within-firm productivity growth, between-firm resource reallocation and firm demography.
Within-firm productivity growth
Within-firm productivity growth depends on the quality of production inputs and on investment in productivity-enhancing activities. Managerial ability, which has been found to be a critical factor behind cross-country and cross-firm productivity differences[14], could be considered a production input, alongside labour and capital. Therefore, increasing managerial ability, investing in workers’ training and substituting obsolete capital for new vintages would result in greater firm efficiency, i.e. TFP growth. Firm efficiency would also benefit from higher investment in R&D and innovation (e.g. technology creation) and from investment in existing technologies (technology adoption). Firms’ decisions on these different drivers can be affected by structural and fiscal policies shaping market regulation and framework conditions that set incentives for innovative investment. Among all these drivers, the role of technology – creation and adoption – features particularly prominently in the literature, for two main reasons. First, some authors find that the greater ability of the United States to create technology, and also to use it in the production process, is one of the main drivers of the US-Europe productivity gap.[15] Second, despite the apparent rapid recent advance of new technologies, labour productivity growth in most developed economies has been slowing down since before the GFC, as shown in Section 1.
The broad deceleration in productivity at a time of intense technology acceleration has been widely described as a puzzle or even as a paradox. There is extensive research and ongoing debate on what lies behind this paradox. The “techno-pessimists” argue that new technological innovations are simply less revolutionary than in the past, notably compared with those induced by the second industrial revolution.[16] In contrast, “techno-optimists” are of the view that the potential of information and communication technologies (ICT) and other new technologies will unfold in the coming decades, with a profound impact on productivity growth. This strand of literature argues that we might not yet have seen the full benefits of new technologies because they are still in development and because it takes time for new technologies to diffuse, for companies and workers to adapt, and for complementary investments to take place.[17] There is also a strand of thought arguing that the increasing prevalence of new technologies might have resulted in mismeasurement rather than in a productivity paradox.[18]
The speed of technology creation and adoption in the euro area can be approximated by analysing separately the TFP dynamics of frontier firms and laggards.[19] Frontier firms are the most productive firms in a narrowly defined sector across all analysed countries.[20] They are the ones expected to innovate and bring new technologies to the market. For this reason their TFP growth will be highly correlated with innovation and technology creation in the euro area. Laggards, in turn, are here defined as the median or representative firm in the sector. Their productivity growth hinges on the adoption of the technologies introduced by frontier firms in their sector of activity. Technology adoption (or speed of technology diffusion) can therefore be proxied by the TFP growth gap between frontier firms and laggard firms. It is understood that if new technology diffuses fast from frontier firms to the rest, the TFP growth developments of frontier and laggard firms should be similar, although starting at very different levels.
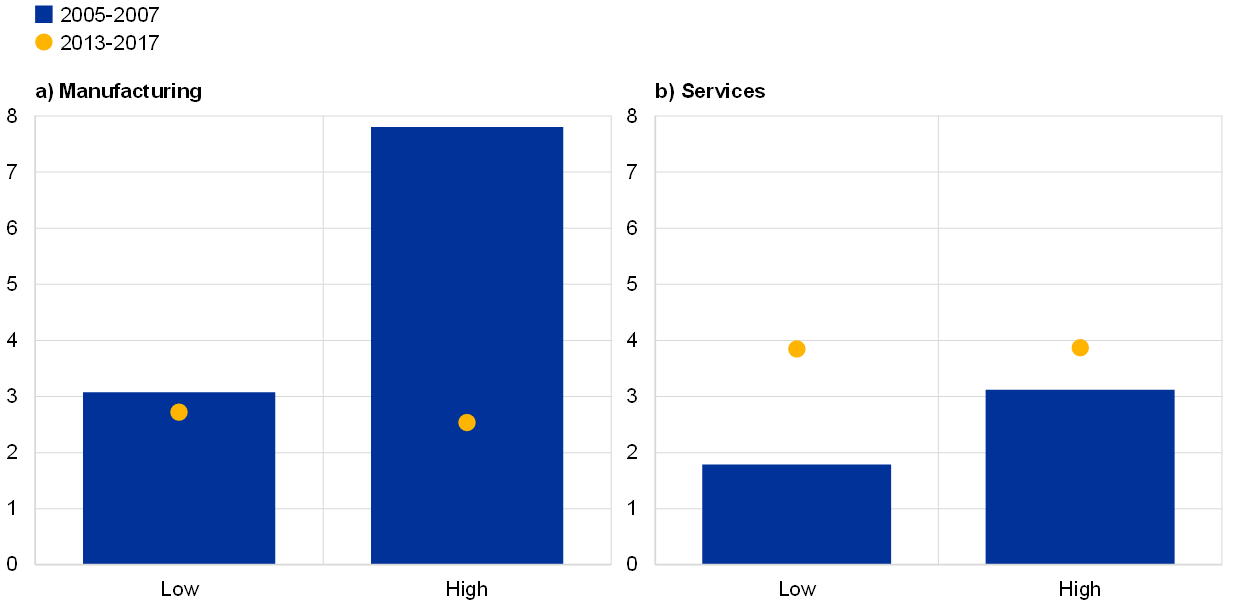
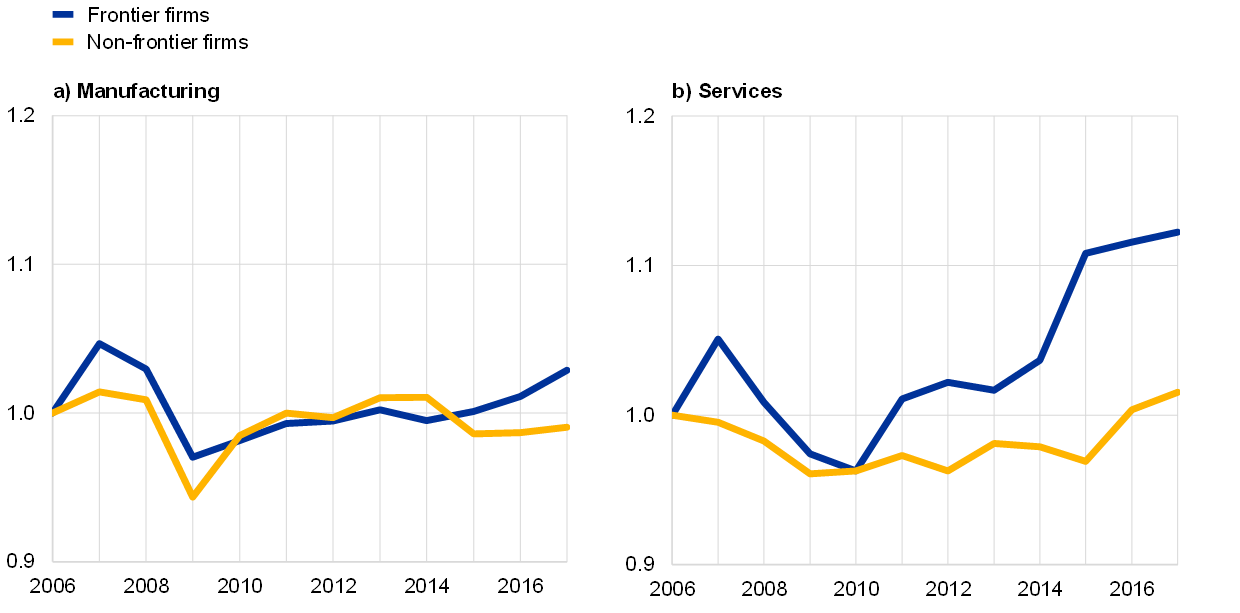
Data on six euro area countries[21] show that technology creation slowed down in manufacturing over the period 2005-2017.[22] The analysis shows that TFP growth of frontier manufacturing firms in the pooled sample decreased from an annual average rate of 4.8% in the 2005-2007 period to 2.6% in the 2013-2017 period (Chart 4 – top panel). When manufacturing sectors are split according to their technology intensity, it becomes clear that the slowdown took place entirely in high-technology manufacturing sectors (Chart 5 – left panel). The ultimate reasons for the slowdown in technology creation in manufacturing are not yet clear. One possible explanation could be the high (and increasing over time) average age of manufacturing frontier firms, particularly in high-technology sectors (Chart 4 – bottom panel). A higher average age of firms within an industry can be a sign of an advanced technology lifecycle and/or of reduced firm dynamics (i.e. reduced entry and exit rates), which are often associated with a lower level of innovation activity.[23] Another possible reason could be related to the slowdown in trade integration, which may have contributed to the slowdown in technology creation of European manufacturing firms through decreased incentives to engage in technology upgrading and innovation and muted learning-by-exporting.
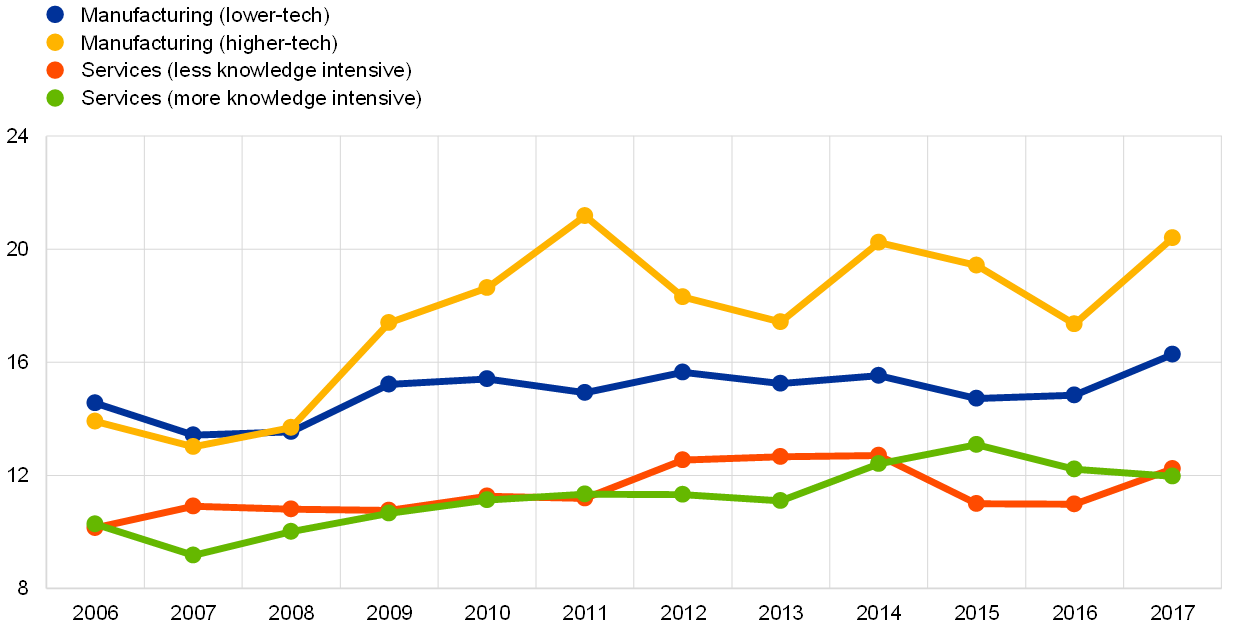
In contrast, the technology creation of frontier firms has accelerated in the services sectors. Over the post-GFC period, the TFP of frontier firms in services has grown at a higher annual rate than that of manufacturing frontier firms, showing an acceleration in innovation relative to previous periods (Chart 4 – top panel).[24] Chart 5 (right panel) shows that this transformation is taking place across traditionally low-tech service sectors such as retail and accommodation as much as across high-tech service sectors like financial or professional services. The acceleration in technology creation in services compensates for the observed slowdown in manufacturing, so the aggregate picture of euro area technology creation remains relatively stable over time. However, given that manufacturing industries have so far been a key driver of aggregate productivity growth in the euro area, the observed slowdown in manufacturing innovation might have consequences for the productivity outlook going forward.
Chart 4
Technology creation in the euro area
a) TFP growth of frontier firms (5% most productive firms), average across countries
(average TFP growth, annual percentage change)

b) Age of frontier firms by sector and technology-intensity/knowledge-intensity, average across countries, 2006-2017
(years of activity)
Sources: ECB iBACH-Orbis database and own calculations.
Notes: The top chart shows average annual TFP growth rates of the 5% most productive firms in the pooled sample of countries in a given year within a NACE four-digit industry. Industry value added weights are used to aggregate up to the corresponding broad sector. In the bottom chart manufacturing industries are classified according to their R&D intensity (R&D by value added of the industry) into higher-tech (high-technology and medium high-technology) on the one hand, and lower-tech (medium low-technology and low-technology) on the other hand, following the Eurostat classification. Service industries are classified into knowledge-intensive services and less knowledge-intensive services based on the share of tertiary educated persons at NACE two-digit level, also following Eurostat standards.
Chart 5
TFP growth of frontier firms according to sector and technology-intensity/knowledge-intensity in the pre- and post-GFC periods, average across countries
(average annual TFP growth rate)
Sources: ECB iBACH-Orbis database and own calculations.
Notes: The chart shows average annual TFP growth rates of the 5% most productive firms in the pooled sample of countries in a given year within a NACE four-digit industry. Industry value added weights are used to aggregate up to the corresponding broad sector. Manufacturing industries are classified according to their R&D intensity (R&D by value added of the industry) into high-technology and medium high-technology on the one hand, and medium low-technology and low-technology on the other hand following the Eurostat classification. Service industries are classified into knowledge-intensive services and less knowledge-intensive services based on the share of tertiary educated persons at NACE two-digit level, also following Eurostat standards.
The TFP growth gap between frontier firms and laggards in services is widening over time, reflecting a slowdown in technology diffusion (Chart 6 – right panel).[25] The reasons for the slowdown are manifold. It might be that tacit knowledge and the number of complex technologies have increased, thereby creating barriers to the catching-up of laggard firms. Also, the use of both new technologies and intangible capital is often characterised by high fixed costs and by network effects, possibly implying non-replicable increasing returns to scale.[26] This can also lead to “superstar” and “winner-takes-all” effects which might discourage laggard firms from investing in technology creation and adoption.[27] Finally, even if incentives to innovate and adopt technologies exist, necessary complementary inputs might be missing in laggard firms. One of the most important complementary investments is human capital, both of workers and of managers. It has been shown that employees need complementary information technology skills to exploit the full potential of new technologies; firms might also need to reorganise to adopt and benefit from new technologies. Other potentially lacking input factors are investment in necessary infrastructure (e.g. broadband) or complementary intangible inputs (e.g. organisational capital), while more advanced digital tools and applications have diffused to very few firms in most advanced countries.[28]
Chart 6
TFP growth gap between frontier and laggard firms as a proxy for technology diffusion in the euro area
(Index, 2006=1)
Sources: ECB iBACH-Orbis database and own calculations.
Resource reallocation: between-firm resource reallocation and firm demography
At any moment in time, in every sector and country, there is significant reallocation of capital and labour across firms. Seminal work using US longitudinal firm-level data in the 1990s showed that about one in ten jobs were created and one in ten destroyed every year within narrowly defined sectors.[29] This high pace of job reallocation – measured as the sum of gross job creation and destruction – is a common feature across countries, sectors and years and is closely linked to worker reallocation given that most annual job creation and destruction reflects persistent firm-level employment changes.
If resources flow from low-productivity firms to firms with high productivity, reallocation will be productivity-enhancing even if average firm productivity does not change. If resources flowed instead to low-productivity firms, resources become misallocated. Several studies report increasing misallocation of resources since before the GFC.[30] This finding suggests that there might be structural factors, besides cyclical ones, behind this trend. Distortions impairing the efficient allocation of production factors (capital and labour) across heterogeneous producers can stem from the design of taxes and tariffs, the regulation of input and output markets, financial frictions, or imperfect information.[31]
The impact of increased misallocation on TFP growth in the euro area could be substantial. Estimates from a meta-analysis of empirical papers quantifying TFP losses due to resource misallocation show that increasing resource misallocation could cost up to 0.2 percentage points of annual TFP growth in the euro area, which represents about half the average annual TFP growth over the period 2014-2019 (Chart 2).[32]
The process of creative destruction whereby new firms replace obsolete ones contributes to the reallocation of resources across firms, albeit to a small extent in the short term. The limited short-term contribution of firm demography is the result of two counterbalancing effects. Data on four euro area countries show that, on the one hand, the very low productivity of exiting firms relative to other firms in their market increases the productivity contribution of firm exit. On the other hand, new firms start up with relatively low productivity levels, which acts as a drag on productivity growth (Chart 7 – top panel).[33] The net contribution of entry and exit is, in consequence, positive overall but relatively small over the short term across all countries.
Post-entry selection of new firms increases the productivity contribution of young firms over the medium term. After entry, firms learn about their relative productivity and, if well below the average in the sector, exit after few years of operation. This is called the “selection effect”.[34] In the sample analysed, about one-third of firms exit before completing three years of activity (Chart 7 – bottom panel).[35] Which firms survive the first years of operations depends on their productivity: young surviving firms are up to two and a half times more productive than young exiting firms in the same age bracket.[36]
Chart 7
Productivity at entry and exit, and selection effect
a) Productivity of new and exiting firms relative to incumbent firms, different periods
(index, 1=productivity of incumbent firms in the same country, sector and year)

b) Share of new firms exiting the market before completing three years of activity
(percentage share of new firms in each cohort)

Source: Own calculations based on ECB iBACH-Orbis data.
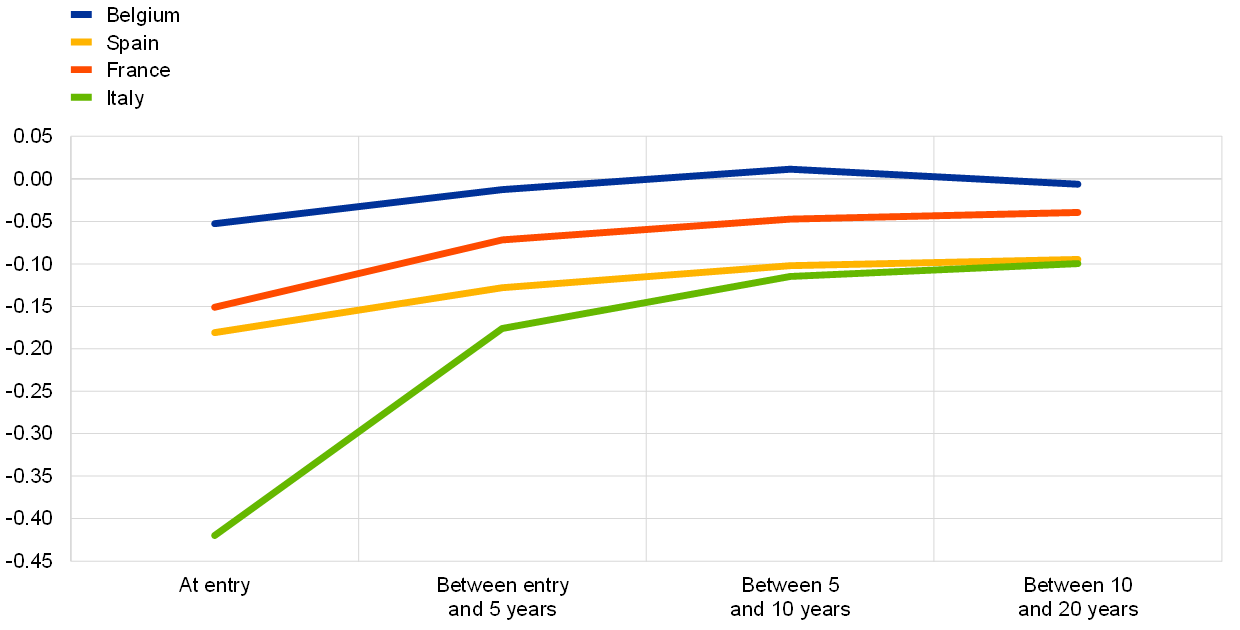
If they survive, new firms converge to the average scale of efficiency in the sector. This implies that these firms grow faster in terms of productivity than incumbents in the same sector, particularly during their first five years of activity. This is known as the “learning effect”. After controlling for the country and sector of activity, sector demand conditions and entry year, it is found that young surviving firms in Belgium and France converge in about ten years to the productivity level of mature incumbent firms with more than 20 years of activity in the same sector. In Italy and Spain, where new firms’ productivity level is well below that of incumbents, the catch-up process takes longer (Chart 8 – top panel).
The strong productivity performance of young surviving firms is driven by a few high-growth firms. Focusing on young firms entering after the GFC to negate the possible negative impact of the crisis, it is found that the distribution of average annual productivity growth during their first six years of activity is extremely skewed (Chart 8 – bottom panel). Annual productivity growth of firms in the top 10% of the growth distribution is more than 80% on average, compared with the annual productivity growth of the median firm of up to 5%. Indeed, young firms have been shown to introduce radical innovations more frequently than mature firms,[37] although according to the findings of this analysis, few succeed. Moreover, recent analysis for the United States has found that firm entry and the prevalence of high-growth firms has declined over time.[38] Although the dataset used in this section does not cover a long enough period to analyse these facts in the European context, there is some evidence that business dynamism is also declining in Europe.[39]
Chart 8
Learning effects
a) Productivity convergence of new firms to incumbents in the same sector, conditional on survival
(percentage deviation from productivity of reference category – firms with 20 or more years of activity)
b) Average annual productivity growth during the first six years of activity of firms born in 2012-13
(average annual productivity growth)

Source: Own calculations based on ECB iBACH-Orbis data.
Notes: The top panel shows the coefficient of each age bracket in a regression of labour productivity on age conditional on the survival of the firm and controlling for sector of activity, sector demand conditions and entry year of the firm. The bottom panel shows the distribution of annual productivity growth of firms during their first six years of activity.
New firms also contribute to aggregate productivity growth by increasing market competition. New innovative firms can stimulate innovative efforts of incumbents through the pressure of competition, leading to a positive impact on their within-firm productivity growth.[40]
The productivity implications of financially distressed firms
The delayed exit of financially distressed firms with low productivity could be a drag on productivity growth. As shown in Chart 7 (top panel), exiting firms tend to be significantly less productive than incumbents operating in the same sector. Hence, if these firms become financially distressed and do not exit the market, they could have an important negative impact on aggregate productivity growth. This impact can be either direct, given their relative low productivity, or indirect, because of possible crowding out of resources from healthy firms (congestion effects). Delayed exit may reflect stagnant productivity growth of incumbent firms, misallocation of resources or disrupted entry and exit of firms.
The literature has categorised firms as financially distressed according to different criteria. In their seminal papers focusing on firm-bank relationships in Japan in the 1990s, Hoshi[41] and Caballero et al.[42] identify “zombies” as firms with extremely low interest payments and high levels of debt that are likely to receive financial aid from lenders. In a second approach, recent studies, including this article, use various measures of sustained weak financial performance to identify financially distressed firms. These measures flag firms with persistently low profits – at least for three consecutive years – relative to interest paid and financial charges.[43]
The dynamics of firms in distress – those with an interest coverage ratio below one for three consecutive years – is highly procyclical. Using recent firm-level data from five euro area countries (Belgium, Italy, Netherlands, Portugal and Finland)[44], it can be shown that the share of financially distressed firms increased from 2006 to 2014 and declined thereafter (up to 2017, the year of the latest available data) across all analysed countries (Chart 9 – top panel). To identify the driver of this decline, the stock of financially distressed firms at any given moment is decomposed into inflows into distress, that is, firms entering financially distressed status, and outflows from distress, or firms exiting financially distressed status, either because they recover or because they exit the market. The exercise reveals that the cyclical dynamics of financially distressed firms are driven entirely by the entry of firms into distress, which declined sharply with the post-crisis economic recovery. On the other hand, outflows from distress have remained relatively unchanged over time (Chart 9 – bottom panel). This means that the average duration of firms’ financially distressed status has been stable over time.
Chart 9
The evolution of financially distressed firms
a) Share of financially distressed firms over time, weighted average across countries
(percentage of firms, employment and value added)

b) Inflows into and outflows from distress, weighted average across countries
(left-hand scale: percentage of healthy firms; right-hand scale: percentage of zombies)

Sources: Central Balance Sheet Database, Cerved Centrale dei Bilanci, Istituto Nazionale Previdenza Sociale, National Bank of Belgium Central Balance Sheet Office, Statistics Finland, Statistics Netherlands and authors’ calculations.
Notes: Charts show the weighted average of developments in five euro area countries: BE, IT, NL, PT and FI. Financially distressed firms are defined as firms with a ratio of earnings before interest and taxes (ebit) and interest paid+financial charges of less than one (ebit/(interest+financial charges)<1) for three consecutive years. Manufacturing includes NACE Rev. 2 sectors 10-33 and private services includes sectors 45-63 and 69-82.
Not all firms in financial distress are alike. On average across years and countries, it is found that about half of firms in distress exit this status after three years: between 40% and 70% of firms exiting financially distressed status recover financial health and between 60% and 30% of them exit the market (Chart 10 – top panel). The other half of financially distressed firms, amounting to about 5% of total firms, stay in financially distressed status and therefore could be labelled as “zombies” (Chart 10 – bottom panel). This heterogeneity within financially distressed firms also becomes evident when looking at their labour productivity relative to healthy firms in the same country and sector. Whereas financially distressed firms as defined by the interest coverage ratio criterion are, on average, 60% as productive as healthy firms in the same country and sector, financially distressed firms that finally exit the market are significantly less productive than firms that recover financial health after a period in distress (Chart 10 – bottom panel).
Chart 10
Different types of financially distressed firms
a) Exits from financially distressed status: recoveries or out of market
(percentage share of exits from financially distressed status)

b) Relative productivity and population share of different types of financially distressed firms, average across countries and years
(left-hand scale: index, 100=productivity of healthy firms in the same country and sector; right-hand scale: percentage share of population of active firms)

Sources: Central Balance Sheet Database, Cerved Centrale dei Bilanci, Istituto Nazionale Previdenza Sociale, National Bank of Belgium Central Balance Sheet Office, Statistics Finland, Statistics Netherlands and authors’ calculations.
Notes: Financially distressed firms are defined as firms with a ratio of earnings before interest and taxes (ebit) and interest paid+financial charges of less than one (ebit/(interest+financial charges)<1) for three consecutive years. Manufacturing includes NACE Rev. 2 sectors 10-33 and private services includes sectors 45-63 and 69-82.
The literature has pointed to different factors behind the emergence of the zombie phenomenon, i.e. financially distressed and non-viable firms.[45] They primarily relate to institutional and structural factors such as the efficiency of insolvency frameworks, banking sector health and, as discussed in greater detail in the next section, also possibly a prolonged period of accommodative monetary policy. Empirical evidence suggests that inefficient insolvency regimes have been preventing non-viable firms from exiting the market. These firms’ ability to exit is particularly important after an adverse aggregate shock to enable fast restructuring and to free up resources for other, more productive uses.[46] A weak banking sector also seems to be associated with the prevalence of zombie firms. The reason is that under-capitalised banks are less likely to foreclose zombie firms compared with stronger banks, which hinders the reallocation process. A typical mechanism is that weak banks seek to postpone registering losses in their accounts in an attempt to avoid recapitalisation and gamble on recovery. Finally, as discussed in the next section, there have been studies showing that a prolonged period of accommodative monetary policy could reduce incentives for firms to repair their balance sheet and delay the exit of unproductive or unviable firms. Overall, these findings highlight the importance of policies that aim to facilitate the allocation of resources towards more innovative and productive firms.
4 How does monetary policy interrelate with productivity growth?
Cyclical polices, including monetary policy, may under certain circumstances support productivity growth by affecting demand and financial conditions and thus also capital deepening and TFP growth. This section first discusses the theoretical channels through which monetary policy can affect productivity. It then presents novel empirical evidence of the effects of monetary policy on productivity and credit allocation in the euro area. It is important to emphasise that this novel analysis does not address all channels jointly, in a general equilibrium context, and covers only countries for which data were available.
An accommodative monetary policy stance may stimulate demand and investment in productivity-improving technologies. Beyond supporting demand and investment, an accommodative monetary policy stance might result in favourable financing conditions, with an impact on corporate profitability and on the productivity threshold for market survival, which also stimulates firm entry and delays firm exit. In the presence of tight financing conditions, an accommodative monetary policy prevents the death of highly productive firms that become financially constrained and facilitates their investment, thereby favouring aggregate productivity growth. At the same time, an accommodative monetary policy may also create some negative productivity effects under certain circumstances. First, low interest rates stimulate risk-taking which can worsen resource allocation, especially in the absence of appropriate bank supervision or macroprudential policies. Second, while an accommodative monetary policy stance can facilitate the flow of resources from firms with low productivity to firms with high productivity, particularly if the latter has been financially constrained, the opposite can also occur. For example, if firms with low productivity are less financially constrained because of high collateral (e.g. in the construction sector), resources could also flow to this type of firm and away from highly productive firms with more financial frictions (low net worth, information asymmetries owing to age or intangible assets, etc.). Third, easier financing conditions may reduce the incentives for firms and banks to carry out necessary restructuring and balance sheet repair, with adverse effects on resource allocation.[47] This implies the need for monetary policy to be complemented by appropriate micro-prudential and macroprudential policies to prevent such distortions to build up and result in boom-bust episodes.
New empirical work suggests that accommodative monetary policy shocks have a positive impact on TFP growth in the long term.[48] In the short run there are only hints of anticipation of technology-enhancing investments for the euro area. In the longer term, however, TFP reacts positively to a monetary policy shock in both the United States and the euro area (Chart 11).
Chart 11
The impact of monetary accommodation on TFP over time
Dynamic response of cyclically adjusted TFP to a 100-basis point decrease in nominal interest rates
(x-axis in quarters; y-axis in cumulative percentage change relative to pre-shock TFP growth)

Sources: Euro area TFP computed using growth accounting at the industry level. Euro area cyclically-adjusted TFP stems from the European Commission Spring 2020 forecast while US cyclically adjusted TFP is taken from the database by Fernald.
Notes: The figures depict cumulative TFP growth at different time horizons (quarters, x-axis) after an expansionary monetary policy shock at t=0. Monetary policy shocks are identified using high-frequency surprises around monetary policy announcements as in Jarociński, M. and Karadi, P., “Deconstructing Monetary Policy Surprises – The Role of Information Shocks”, American Economic Journal: Macroeconomics, Vol. 12, No 2, 2020, pp. 1-43l. Solid lines denote smooth local projections estimates; dashed lines denote 68% confidence intervals.
Empirical analysis shows little evidence of a deterioration in resource allocation at the time of accommodative monetary policy decisions. In a low interest rate environment, banks could relax lending standards (heightened risk-taking, credit booms) and might increasingly lend also to non-viable firms, which could put pressure on aggregate productivity given the relatively lower productivity of such firms, as shown in the previous section (Chart 10 – bottom panel). To explore this possible channel, three new pieces of analysis are conducted. The first exploits the ECB survey on the access to finance of enterprises (SAFE)[49], to find out whether the accommodative monetary policy of recent years facilitated access to finance, and therefore survival, of weak firms in the euro area.[50] Results show that the easing of financing conditions following expansive monetary policy decisions facilitated access to finance for most firms, but significantly less for weak or vulnerable firms (Chart 12). The only exception was large firms with an interest coverage ratio temporarily below 1 (that is, with profits below interest payments), which actually gained access to finance when financing conditions were eased. This result could be driven by the fact that bank balance sheets are more sensitive to large firms in distress and large firms have more bargaining power.[51] The second piece of analysis focuses on the pricing behaviour of banks in France and uses credit registry data to analyse whether the share of low-solvency firms benefiting from exceptionally low interest rates[52] has increased during the low interest rate period. The results show that this share remained subdued and stable in France over the past decade, suggesting that credit misallocation is not pervasive in France. The third piece of analysis focuses on Spain, Italy and Portugal – countries with a relatively large share of financially constrained firms – and finds that capital allocation improved after a positive monetary policy shock. The reason is that the decrease in the interest rate increased investment relatively more in firms with high marginal revenue productivity of capital that were initially financially constrained (younger, more dependent on external finance and featuring low mark-ups).[53]
Chart 12
Improvements in access to bank finance by firm type after selected monetary policy decisions
(net share of firms responding that access to finance has improved over the preceding six months; weighted percentages of respondents)

Source: ECB/EC SAFE.
Notes: Enterprises that had applied for bank loans. Vulnerable firms are firms that have reported simultaneously lower turnover, decreasing profits, higher interest expenses and higher or unchanged debt to total assets in the last 6 months OMT: outright monetary transactions programme; TLTRO: targeted longer-term refinancing operations; CSPP: corporate sector purchase programme The first vertical line denotes the announcement of the OMT; the second vertical line denotes the start of TLTRO I and the negative rate policy; and the third vertical line denotes the start of TLTRO II and the CSPP. Figures refer to rounds 3 (March-September 2010) to 22 (October 2019-March 2020) of the survey.
5 Conclusion
Productivity growth in the euro area has been muted for decades, owing to a variety of interacting factors. First, capital deepening has been weak in the euro area since the GFC as a result of low investment and employment recovery. Second, within-firm productivity growth has slowed down since the pre-GFC period, reflecting slower technology creation in manufacturing firms with a negative impact on euro area TFP growth. Although this development has been partly compensated for by an acceleration of innovation in services, new technologies resulting in higher services TFP growth seem to benefit largely frontier firms; most firms in services, in contrast, are lagging behind in technical adoption, which is slowing their TFP growth. Third, the contribution of resource reallocation across incumbents to productivity growth has been declining since before the GFC. Fourth, firm demographics make only a small positive contribution to productivity growth, because new firms have below-average productivity and few surviving firms record high productivity growth. Delayed exit of low-productivity financially distressed firms has probably played a role, albeit a minor one, in dragging down productivity growth over past decades.
These factors hinge on firms’ internal and external levers, suggesting a strong role for national policies in spurring productivity growth. There is ample evidence that euro area countries could achieve significantly stronger productivity growth by following global best practices in terms of structural policies and regulation of various markets.[54] Those include policies that enhance labour mobility across and also within firms, sectors and regions; that support the diffusion of technology and the growth of more innovative and productive firms; that create a more competitive environment in product markets; that strengthen the contribution of finance to a more efficient allocation of savings and discourage the excessive accumulation of corporate debt; and that strengthen insolvency frameworks to facilitate the exit of less productive firms.
At the same time, the article finds tentative evidence of monetary policy having a positive effect on productivity growth, at least under a partial equilibrium approach. The preliminary new evidence presented in this article suggests that by supporting demand and investment of financially constrained firms with high marginal revenue productivity of capital, the accommodative monetary policy stance in the euro area may have improved capital allocation. It is also found that the accommodative stance has not, overall, adversely affected credit allocation, although there may be some exceptions relating to large firms with profits below interest payments.
Looking ahead, productivity developments will also depend on the interaction of key drivers of productivity growth with the effects of the COVID-19 pandemic. Despite recent encouraging signs, there remain some threats, owing to the possible restructuring of global value chains after the pandemic and a further rise in trade barriers. The massive policy support for the corporate sector in response to the pandemic crisis has been crucial in mitigating the initial impact of the shock. However, once the economic recovery takes hold on a sustainable basis, policy support needs to be lifted gradually, also to avoid impairing the efficient reallocation of resources by setting wrong incentives. In addition, such withdrawal should avoid an undue tightening of financial conditions that would increase the financing cost and reduce the expected benefits of new productivity-enhancing projects and delay investment, with impacts on productivity growth.
On the upside, accelerated digital uptake as a result of the COVID-19 shock might yield to higher productivity growth going forward. Available evidence on the productivity impact of the COVID-19 shock seems to support this possibility, as discussed in the accompanying Box 4 in this issue of the Economic Bulletin. However, the pace and distributional impacts of accelerated digital uptake are still uncertain and depend on the development of institutions, infrastructure, skills, methods of production and management competencies. Also, large investment in green technologies could significantly push the technological frontier outwards. However, in order to facilitate the structural change required to put green production practices in place, new investment should be complemented with favourable framework conditions.
- Productivity can be defined in several ways. From a single-factor perspective, labour productivity is defined as units of output (real GDP or value added) produced per unit of labour input, where labour input can be the number of employed persons or the total hours they work. However, the productivity of any single input of production, such as labour input, depends on the quantity of the other inputs. To capture the efficiency with which all inputs are used, economists use a broader concept of productivity, namely, total factor productivity (TFP), unobservable and computed as a residual. In a production function framework, labour productivity growth is determined by TFP growth and the growth of capital per labour input (capital deepening).
- See Bustos, P., “Trade Liberalization, Exports, and Technology Upgrading: Evidence on the Impact of MERCOSUR on Argentinian Firms”, American Economic Review, Vol. 101, No 1, February 2011, pp. 304-340.
- That is, a firm’s efficiency may benefit from knowledge gained through its presence in foreign markets. See De Loecker, J., “Detecting Learning by Exporting”, American Economic Journal: Microeconomics, Vol. 5, No 3, August 2013, pp. 1-21.
- See Halpern, L., Koren, M. and Szeidl, A., “Imported Inputs and Productivity”, American Economic Review, Vol. 105, No 12, December 2015, pp. 3660-3703.
- See Melitz, M.J., “The Impact of Trade on Intra-Industry Reallocations and Aggregate Industry Productivity”, Econometrica, Vol. 71, No 6, 2003, pp. 1695-1725.
- See for example Aiyar, S., Ebeke, C. and Shao, X., “The Impact of Workforce Aging on European Productivity”, IMF Working Papers, WP/16/238, International Monetary Fund, 2016.
- The report was drafted by experts from 15 national central banks and the ECB. See “Key factors behind productivity trends in EU countries”, Occasional Paper Series, No 268, ECB, September 2021.”
- This selection is data-driven as information on late euro adopters typically starts in 2000. “EA-12” refers to Belgium, Germany, Ireland, Greece, Spain, France, Italy, Luxembourg, Netherlands, Austria, Portugal and Finland.
- Note that in this standard accounting decomposition, the portion of output that cannot be explained by the amount of inputs used in the production process, also called the “Solow residual”, measures TFP growth accurately only if the production function is of the Cobb-Douglas-type, if there is perfect competition on product and factor markets, and if the underlying data adequately capture the required information on quantities and prices. Regarding the latter, quality improvements of capital and labour not adequately captured by the data will be captured by the TFP growth measure.
- Regarding productivity levels, the utilities sector (electricity, gas and water supply) as well as financial and insurance activities display the highest labour productivity – €77/hour worked and €71/hour worked respectively on average across EU countries in 2017 (due to their high capital intensity). At the other end of the spectrum, construction and accommodation and food services show the lowest productivity level – €27/hour worked and €20/hour worked respectively. Regarding growth rates, cumulative productivity growth between 1997 and 2017 in the information and communication technologies (ICT) sector was about 85% compared to -16% in the accommodation and food service sector.
- The analysis relies on sector-level data at the two-digit industry of the NACE Rev. 2 sector classification.
- In almost all studies covering developed countries the shift effect is much weaker than the intra-sector effect and its size decreases over time. In many cases the shift effect is negative or mixed (see, for example, European Economy, European Commission, 2003, and OECD Compendium of Productivity Indicators 2018, OECD Publishing, Paris, 2018.
- Studies covering developing countries find a larger contribution of inter-sector reallocation to productivity growth as a result of the loss of weight of agriculture in favour of manufacturing. However, even in this set of countries, inter-sector reallocation is less important than intra-sector dynamics. For example, a very recent report of the World Bank finds that inter-sector reallocation has historically accounted for two-fifths of overall productivity growth in emerging economies (see Dieppe, A. (ed.), Global Productivity: Trends, Drivers, and Policies, World Bank Group, Washington, 2020). Regarding the euro area, the impact of the change in the weight in employment in the agricultural sector on productivity over the period 1960-1979 is estimated to be an annual 0.4% in Germany and 0.5% in France on average. The slowdown in sectoral reallocation after the shift from agriculture was completed is also estimated to have contributed to the overall productivity slowdown of these countries since the 1980s. See Card, D. and Freeman, R., “What Have Two Decades of British Economic Reform Delivered in Terms of Productivity Growth?” International Productivity Monitor, Vol. 5, 2002, pp. 41–52.
- See Bloom, N., Sadun, R. and Van Reenen, J., “Americans Do IT Better: US Multinationals and the Productivity Miracle”, The American Economic Review, Vol. 102, No 1, 2012, pp. 167-201.
- See Van Ark, B., O'Mahoney, M. and Timmer, M., “The Productivity Gap between Europe and the United States: Trends and Causes”, Journal of Economic Perspectives, Vol. 22, No 1, 2008, pp. 25-44.
- See, for example, Gordon, R., “Secular Stagnation: A Supply-Side View”, American Economic Association Papers & Proceedings, Vol. 105, No 5, 2015, pp. 54-59.
- See, for example, Brynjolfsson, E. and McAfee, A., “The Second Machine Age: Work, Progress, and Prosperity in a Time of Brilliant Technologies”, WW Norton & Company, 2014.
- See, for example, Syverson, C., “Challenges to mismeasurement explanations for the US productivity slowdown”, Journal of Economic Perspectives, Vol. 31, No 2, 2017, pp. 165-186.
- See Andrews, D., Criscuolo, C. and Gal, P.N., “Frontier Firms, Technology Diffusion and Public Policy”, OECD Productivity Working Papers, No 2, OECD Publishing, 2015.
- Ideally we should consider a global frontier, given that technology has no boundaries. However, due to data restrictions this sections analyses frontier firms in six large euro area countries.
- The countries covered are Belgium, Germany, Spain, France, Italy and Portugal, over the period 2005-2017. Data are sourced from ORBIS (BvD) and iBACH (firm-level data underlying the Bank for the Accounts of Companies Harmonized), refer to corporations with employees operating in the non-agricultural business sector, excluding the financial sector, and are treated with inverse population weights to improve sample representativeness.
- Note that the distinction between manufacturing and services is becoming blurrier over time. The reason is that manufacturing firms increasingly provide services related to their products. To mitigate that problem, the analysis in this article uses unconsolidated accounts and classifies firms by their main activity.
- See for example Huergo, E. and Jaumandreu, J., “How does probability of innovation change with firm age?”, Small Business Economics, Vol. 22, No 3-4, 2004, pp. 193-207.
- This increase reflects partly the changing nature of services sectors. Take the example of retail sales, which are increasingly online and use sophisticated algorithms to detect costumer’s preferences and needs in real time.
- This is a widely documented fact across a variety of countries. See, for example, Andrews, D., Criscuolo, C. and Gal, P.N., “Frontier Firms, Technology Diffusion and Public Policy”, OECD Productivity Working Papers, No 2, OECD Publishing, 2015, for OECD evidence.
- Network effects refer to a situation where a good or service becomes more valuable when more people use it. See Calvino, F. and Criscuolo, C. “Business dynamics and digitalisation”, OECD Science, Technology and Industry Policy Papers, No 62, OECD Publishing, Paris, 2019.
- “Winner-takes all” refers to market dynamics whereby globalisation and technological changes push sales towards the most productive firms in each industry, which results in product market concentration and the rise of very large dominant firms, also called “superstar” firms. See Autor, D., Dorn, D., Katz, L., Patterson, C. and Van Reenen, J., ”The Fall of the Labor Share and the Rise of Superstar Firms”, The Quarterly Journal of Economics, Vol. 135, Issue 2, May 2020, pp. 645-709.
- For a literature overview, see Akcigit, U. and Ates, S.T., “What Happened to US Business Dynamism?”, NBER Working Paper, No 25756, National Bureau of Economic Research, 2019; and “Key factors behind productivity trends in EU countries”, Occasional Paper Series, No 268, ECB, September 2021.
- Davis, S.J, and Haltiwanger, J., “Job Creation, Gross Job Destruction, and Employment Reallocation”, The Quarterly Journal of Economics, Vol. 107, No 3, 1992, pp. 819-863.
- See Gopinath, G., Kalemli-Özcan, S., Karabarbounis, L. and Villegas-Sanchez, C., “Capital allocation and productivity in South Europe”, The Quarterly Journal of Economics, Vol. 132, No 4, 2017, pp. 1915-1967; and Gamberoni, E., Giordano, C. and Lopez-Garcia, P., “Capital and labour (mis)allocation in the euro area: some stylized facts and determinants”, Working Paper Series, No 1981, ECB, November 2016.
- See “Key factors behind productivity trends in EU countries”, Occasional Paper Series, No 268, ECB, September 2021 for a review of the literature.
- This estimate comes from a meta-analysis based on 21 primary studies, with about 200 observations in total, for euro area countries. For further details on the meta-analysis, see “Key factors behind productivity trends in EU countries”, Occasional Paper Series, No 268, ECB, September 2021.
- The data used for the analysis of the post-entry development of firms are sourced from ORBIS and iBACH and cover four euro area countries: Belgium, France, Italy and Spain, over the period 2006-2018. For more details on the data, please refer to See “Key factors behind productivity trends in EU countries”, Occasional Paper Series, No 268, ECB, September 2021.
- See, for example, Jovanovic, B., “Selection and the Evolution of Industry”, Econometrica, Vol. 50, No 3, 1982, pp. 649-670.
- The results show selection of firms before completing three years of activity taking into account two cohorts of firms: those entering in 2006-2008 and those entering in 2013-20,14.
- See “Key factors behind productivity trends in EU countries”, Occasional Paper Series, No 268, ECB, September 2021.
- See Acemoglu, D., Akcigit, U., Alp, H., Bloom, N. and Kerr, W.R., “Innovation, Reallocation and Growth”, American Economic Review, Vol. 108, No 11, 2018, pp. 3450-3491.
- Decker, R., Haltiwanger, J., Jarmin, R. and Miranda, J., “Declining Business Dynamism: What We Know and the Way Forward”, American Economic Association Papers & Proceedings, Vol. 106, No 5, 2016, pp. 203-207.
- Calvino, F., Criscuolo, C. and Menon, C., “Cross-country evidence on start-up dynamics”, OECD Science, Technology and Industry Working Papers, No 6, OECD Publishing, Paris, 2015.
- Anderton, R., Di Lupidio, B. and Jarmulska, B., “The impact of product market regulation on productivity through firm churning: Evidence from European countries”, Economic Modelling, Vol. 91, September 2020, pp. 487-501.
- Hoshi, T., “Economics of the Living Dead”, Japanese Economic Review, Vol. 57, Issue 1, pp. 30-49, March 2006.
- Caballero, R.J., Hoshi, T. and Kashyap, A.K., “Zombie Lending and Depressed Restructuring in Japan”, American Economic Review, Vol. 98, No 5, pp. 1943-1977, December 2008.
- See Adalet McGowan, M., Andrews, D. and Millot, V., “The Walking Dead?: Zombie Firms and Productivity Performance in OECD Countries”, Economic Policy, Vol. 33, No 96, 2018, pp. 685-736. For a discussion of the pros and cons of the different zombie definitions, see “Key factors behind productivity trends in EU countries”, Occasional Paper Series, No 268, ECB, September 2021.
- Further details regarding the data and methodology can be found in See “Key factors behind productivity trends in EU countries”, Occasional Paper Series, No 268, ECB, September 2021.
- Schivardi, F., Sette, E. and Tabellini, G., “Credit misallocation during the financial crisis”, BIS Working Papers, No 669, 2017.
- See Andrews, D. and Petroulakis, F., “Breaking the shackles: zombie firms, weak banks and depressed restructuring in Europe”, OECD Working Papers, No 1433, OECD Publishing, 2017.
- See “Key factors behind productivity trends in EU countries”, Occasional Paper Series, No 268, ECB, September 2021, for a review of the literature exploring the channels through which monetary policy affects productivity.
- For more information on the exercise on US data, see also Hartwig, B. and Lieberknecht, P., “Monetary Policy, Firm Exit and Productivity”, Bundesbank Discussion Paper, No 61, 2020.
- The analysis covers the period 2009-2020 and therefore monetary policy decisions taken by the ECB since the GFC. For more details on data and methodology, refer to “Key factors behind productivity trends in EU countries”, Occasional Paper Series, No 268, ECB, September 2021; and Survey on the access to finance of enterprises: Methodological information on the survey and user guide for the anonymised micro dataset, ECB, Frankfurt am Main, 2020.
- Weak firms are defined in different ways: i) according to a strict SAFE indicator of vulnerable firms, i.e. firms that have reported simultaneously lower turnover, decreasing profits, higher interest expenses and higher or unchanged debt to total assets in the last six months; ii) according to the interest coverage ratio, i.e. they are firms with interest expenses/operating profits below one for three consecutive years, as discussed in the previous section; iii) according to the Altman Z-score; and iv) according to the relative productivity of the firm, where productivity is defined as real value added or turnover per employee.
- For further results, see Acharya, V., Eisert, T., Eufinger, C. and Hirsch, C., “Whatever It Takes: The Real Effects of Unconventional Monetary Policy”, The Review of Financial Studies, Vol. 32 ,No 9, 2019, pp. 3366-3411; and “Key factors behind productivity trends in EU countries”, Occasional Paper Series, No 268, ECB, September 2021.
- That is, credit misallocation is identified as the incidence of low-solvency firms receiving an interest rate on their new loans below a “prime” rate reserved only for the highest quality firms. See Caballero, R.J., Hoshi, T. and Kashyap, A.K., “Zombie lending and depressed restructuring in Japan”, The American Economic Review, Vol. 98, No 5, 2008, pp. 1943-1977; and “Key factors behind productivity trends in EU countries”, Occasional Paper Series, No 268, ECB, September 2021.
- For more details on data and methodology, see “Key factors behind productivity trends in EU countries”, Occasional Paper Series, No 268, ECB, September 2021; and Albrizio, S. and González, B., “Monetary policy and capital misallocation in Europe”, forthcoming working paper, Banco de España, Madrid.
- For an overview of the impact of structural policies on productivity, see “Key factors behind productivity trends in EU countries”, Occasional Paper Series, No 268, ECB, September 2021, and Masuch, K., Anderton, R., Setzer, R. and Benalal, N., “Structural policies in the euro area”, Occasional Paper Series, No 210, ECB, 2018.