


The impact of the COVID-19 pandemic on the euro area labour market
The impact of the COVID-19 pandemic on the euro area labour market
Published as part of the ECB Economic Bulletin, Issue 8/2020.
1 Introduction
The euro area labour market has been severely hit by the coronavirus (COVID-19) pandemic and associated containment measures. Employment and total hours worked declined at the sharpest rates on record. Unemployment increased more slowly and to a lesser extent, reflecting the high take-up rate of job retention schemes and transitions into inactivity. The labour market adjustment occurred primarily via a strong decline in average hours worked. In addition, the labour force declined by about 5 million in the first half of 2020, which is half a million more than its increase between mid-2013 and the fourth quarter of 2019.
Both labour supply and aggregate demand shocks help explain the decline in total hours worked. An analysis via a sign-restricted structural vector-autoregressive model shows that labour supply and productivity shocks together account for about one-third of the total decline in hours worked in the second quarter of 2020. This reflects both the impact of lockdowns, which forced firms to temporarily close or reduce their operations, and the decline in the labour force, potentially also reflecting some discouragement in view of the pandemic situation. The negative aggregate demand shock is estimated to account for about one-quarter of the decline in total hours worked, reflecting both demand constraints and possible effects of uncertainty on consumption behaviour.
The high take-up of job retention schemes in the euro area significantly affected labour market developments. As euro area governments introduced containment measures to limit the spread of the virus they also devised policies to support the labour market, with a particular focus on job retention schemes in the form of short-time work and temporary lay-offs. These schemes help to explain the adjustment via average hours worked. They also help to explain why compensation per employee declined significantly in the euro area during the COVID-19 pandemic, while compensation per hour increased slightly over the same period.[1] High-frequency indicators of labour demand and new hires help to shed light on the impact of the crisis on the labour market. These indicators show that the labour market remained depressed in the fourth quarter of 2020, despite some recovery in employment and hours worked in the third quarter.
A prominent feature of the pandemic was a shift from office work to teleworking. While teleworkable jobs accounted for 33% of employees in 2019, fewer than 10% of potential teleworkers (3.3% of employees) reported working from home either usually or sometimes. That changed with the pandemic and associated lockdowns, during which more than a third of Europeans began to telework. In the first months after the onset of the pandemic, teleworking may have supported employment and hours worked in some sectors, in particular among workers with higher levels of education. Looking ahead, the pandemic is likely to accelerate the ongoing digital transformation of the euro area economy, with teleworking and the use of digital technology becoming more prominent.
2 Developments in employment, unemployment and hours worked
The COVID-19 pandemic led to the sharpest contraction on record in employment and total hours worked in the second quarter of 2020. There were 5.2 million fewer persons employed in the second quarter 2020 than at the end of 2019, a fall of 3.2%. The decline in the number of persons employed in the first half of 2020 corresponds to roughly 44% of the increase in the number of persons employed since the second quarter of 2013. Both employment and hours worked recovered somewhat in the third quarter, but remained substantially below their levels in the fourth quarter of 2019. Moreover, despite the record low employment growth observed in the first half of 2020, the quarter-on-quarter adjustments in employment remained relatively muted in comparison to the changes in GDP. Total hours worked changed substantially more than employment, and also more than GDP. In the second quarter of 2020, the quarter most affected by the containment measures, total hours worked declined by 16.8% and average hours worked declined by 14.3% in annual terms (see Chart 1). The adjustment via the “intensive margin” was facilitated by the high take-up of job retention schemes, which benefited from government efforts to implement new schemes or to considerably expand existing ones (see Section 3). Box 1 describes the nature of the shocks affecting total hours worked and labour force participation.
Chart 1
Employment developments in the euro area
(annual percentage changes)

Sources: Eurostat and authors’ calculations.
Notes: Annual changes are based on seasonally and working-day adjusted data. Shaded bars indicate euro area recessions, defined as two consecutive quarters of negative GDP growth. Latest observation: third quarter of 2020.
Labour productivity per employee decreased markedly during the COVID-19 pandemic, while labour productivity per hour increased slightly. In the first half of 2020, there was a sharp decline in labour productivity per employee, with a year-on-year change of -12.1% in the second quarter of 2020, as the sharp drop in GDP was accompanied by a more moderate fall in employment. By contrast, labour productivity per hour increased by 2.6% year-on-year in the second quarter of 2020, as hours worked dropped more than GDP (see Chart 1). This dichotomy between productivity per person and per hour worked is more marked than in previous recessions and reflects the very high take-up rate of job retention schemes. However, labour productivity per person recovered substantially in the third quarter.
The reaction of the unemployment rate to the fall in activity was more muted than the reactions of employment and total hours worked. Between February and October 2020, the unemployment rate in the euro area increased by only 1.2 percentage points to 8.4%, despite the large fall in employment. The unemployment rate reached 8.7% in July and thereafter declined. The limited increase in the unemployment rate in the euro area during the first months after the onset of the COVID-19 pandemic was in sharp contrast to developments in the United States, where part of the adjustment occurred via the temporary laying off of workers. These are considered unemployed in the United States, whereas in the euro area those affected by short-time work schemes or temporary lay-offs remain, in most cases, on the payroll and are thus not considered unemployed (see Box 2). The more muted response of euro area unemployment to the decline in activity can be attributed not only to the job retention schemes that aimed to protect employment and limit unemployment, but also to a high number of workers transitioning into inactivity, resulting in sharp contractions in labour force participation (see Chart 2). Lockdowns and other containment measures suppressed labour demand and discouraged the search efforts of some workers who lost their jobs and transited directly into inactivity.[2] The labour force recovered substantially in the third quarter, but remains smaller than in the fourth quarter of 2019.
Chart 2
Unemployment rate and labour force participation rate in the euro area
(left-hand scale: percentage points, quarter-on-quarter changes; right-hand scale: percentages)
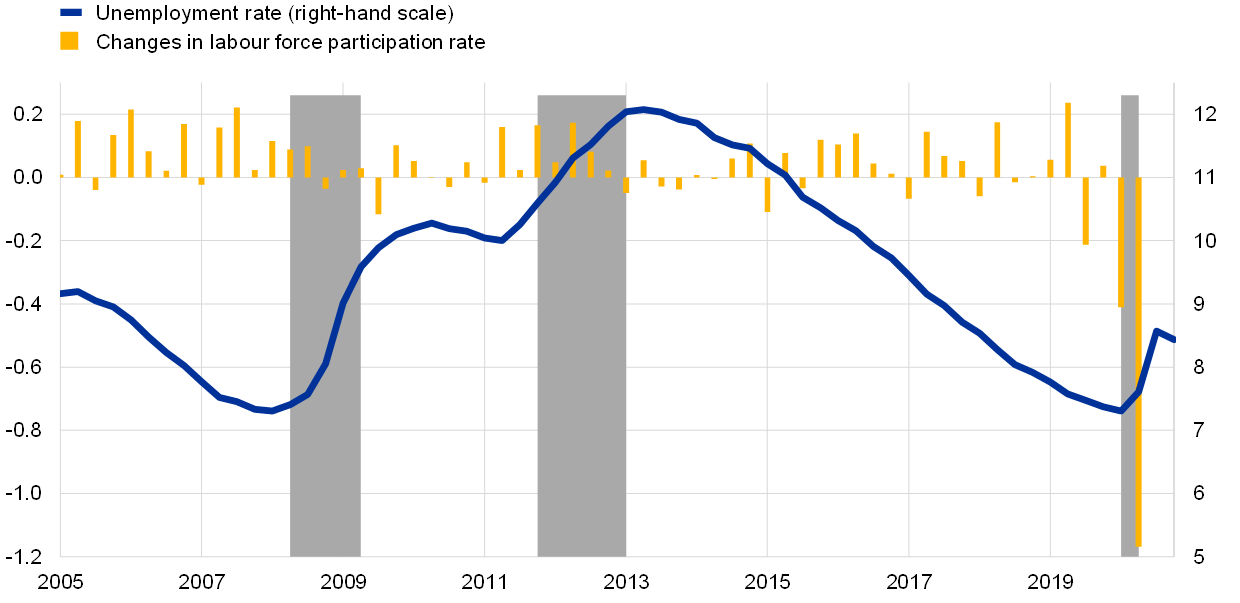
Sources: Eurostat and authors’ calculations.
Notes: All quarterly data are seasonally adjusted. Labour force measured as the sum of employment and unemployment. Shaded bars indicate euro area recessions, defined as two consecutive quarters of negative GDP growth. Latest observations: third quarter of 2020 for the labour force participation rate and October 2020 for the unemployment rate.
The unemployment rate and total hours worked moved away from their long-term co-movements with GDP in the second quarter of 2020.[3] Chart 3 contrasts the observed year-on-year growth rates for employment and total hours worked, and the observed year-on-year differences in the unemployment rate, with their expected responses if the long-term relationship between these labour market aggregates and GDP had remained stable over the first half of 2020. The response of employment appears broadly in line with the predictions of the dynamic approach to estimating its long-term relationship with GDP. However, the unemployment rate has not increased relative to the second quarter of 2019, while total hours worked has decreased by more than would have been expected when looking at its long-term relationship with GDP. In the third quarter 2020, the observed annual growth rates of employment and total hours worked appear to have been broadly in line with their long-term relationship with GDP growth, while the unemployment rate remains lower than would be expected given its historical co-movement with GDP.
Chart 3
Predictions based on the long-term relationship between selected labour market aggregates and GDP
(unemployment rate, percentage points; employment and hours worked, percentages)

Sources: Eurostat and authors’ calculations.
Notes: The long-term relationship between each labour market variable and GDP is estimated on the basis of year-on-year growth rates or differences (in the case of the unemployment rate) up to the fourth quarter of 2019. The impacts are then calculated as the response of the labour market variables to the observed year-on-year decline in GDP in the first and second quarters of 2020 according to Okun’s law. The dynamic Okun prediction is based on an autoregressive distributed lag model, and allows for a dynamic response of labour market aggregates to the decline in GDP.
Box 1
Key drivers of labour market developments: an SVAR analysis
This box assesses recent developments in total hours worked and the labour force in the euro area on the basis of a sign-restricted structural vector-autoregressive model (SVAR). This approach can be used to decompose the year-on-year changes in the four endogenous variables shown in Table A into the cumulative contributions of four specific economic shocks, comprising (i) a shock giving rise to an increase in the demand for labour; (ii) a technology or productivity shock, which can be thought of as a sudden change in the production technology of firms; (iii) a shock constituting an exogenous change in the labour supply (via a shock to labour force participation); and (iv) a wage bargaining shock, which can be thought of as a change in the bargaining power of workers. These shocks are unobservable and are identified by imposing restrictions on the direction in which the endogenous variables move in response to the impact of the shocks, as shown in Table A.[4]
Table A
Restrictions imposed on the impact of shocks on endogenous variables
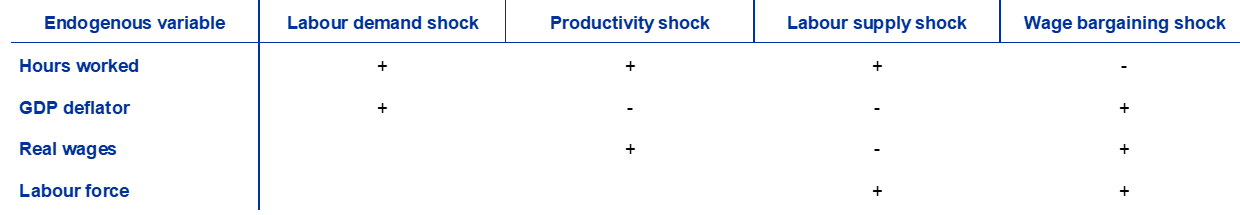
Notes: The table shows the restrictions on the sign of the instantaneous impact of each shock (top row) on the quarter-on-quarter change in the respective endogenous variable (first column). A “+” (“-“) indicates that the variable reacts positively (negatively) on impact to the shock, while an empty cell means that no restriction on the direction of the response on impact is imposed. The SVAR is estimated using quarter-on-quarter changes of the variables between the second quarter of 1995 and the fourth quarter of 2019. “Real wages” is defined as compensation per hour deflated by the GDP deflator.
From an economic point of view, these shocks can capture various events. An increase in wage bargaining power can be related to policy measures, such as an increase in the minimum wage. Likewise, structural reforms that aim to reduce labour costs and to make labour markets more flexible, such as a reduction in unemployment benefits or allowing opt-outs from collective wage agreements, can be considered examples of negative wage bargaining shocks. Positive labour supply shocks can be related to migration waves, changes in the preferences of workers, or institutional reforms that change the size of the labour force, such as an increase in the retirement age. Positive aggregate demand shocks comprise events giving rise to an increase in demand for goods and services in the domestic economy, such as an unexpected increase in foreign demand, or an increase in confidence which may incentivise people to spend more on investment or consumption goods. Such a shock would, in this context, also increase the demand for labour, so total hours worked would increase. Finally, positive productivity shocks can be technological innovations which ease the production or distribution of goods and services or give rise to new products, but they also cover the impact of economic reforms aimed at improving the supply side of the economy (e.g. increasing competition by abolishing inefficient regulations).
Chart A shows the cumulative effect of the identified shocks on the annual changes in total hours worked and the labour force up to the second quarter of 2020.[5] As shown in the upper left panel, the SVAR model interprets the large decline in total hours worked observed in the second quarter of 2020 as being induced primarily by supply-side and demand shocks.[6] On the supply side, labour supply and productivity shocks together are estimated to account for more than one-third of the total decline in hours worked. This reflects the impact of lockdown and containment measures introduced by national governments during the pandemic, which forced many shops and firms to temporarily close or reduce their operations. Furthermore, the negative impact of the labour supply shock captures workers who lost their jobs during the pandemic crisis and did not immediately search for new jobs. As these workers were registered as inactive, this gave rise to the large decline in the labour force recorded during the first two quarters of 2020. The impact of a negative demand shock is estimated to account for about one-quarter of the decline in total hours worked in the second quarter. This reflects constraints on the demand for services as a consequence of the lockdown measures as well as other factors, such as an increase in uncertainty during the pandemic, which restrained consumption. The impact of a positive wage mark-up shock is estimated to explain less than one-tenth of the observed decline in total hours worked in the second quarter, mainly on account of an observed strong increase in compensation per hour (see Box 3 for developments in compensation per hour). Unsurprisingly, the large decline in labour force participation is mostly explained by the impact of the labour supply shock, as shown in the upper right panel of Chart A. The residual component is estimated to account for less than one-third of the decline in total hours worked.
Chart A
Contributions of shocks to changes in total hours worked and the labour force in the euro area
(annual percentage changes; percentage point contributions)
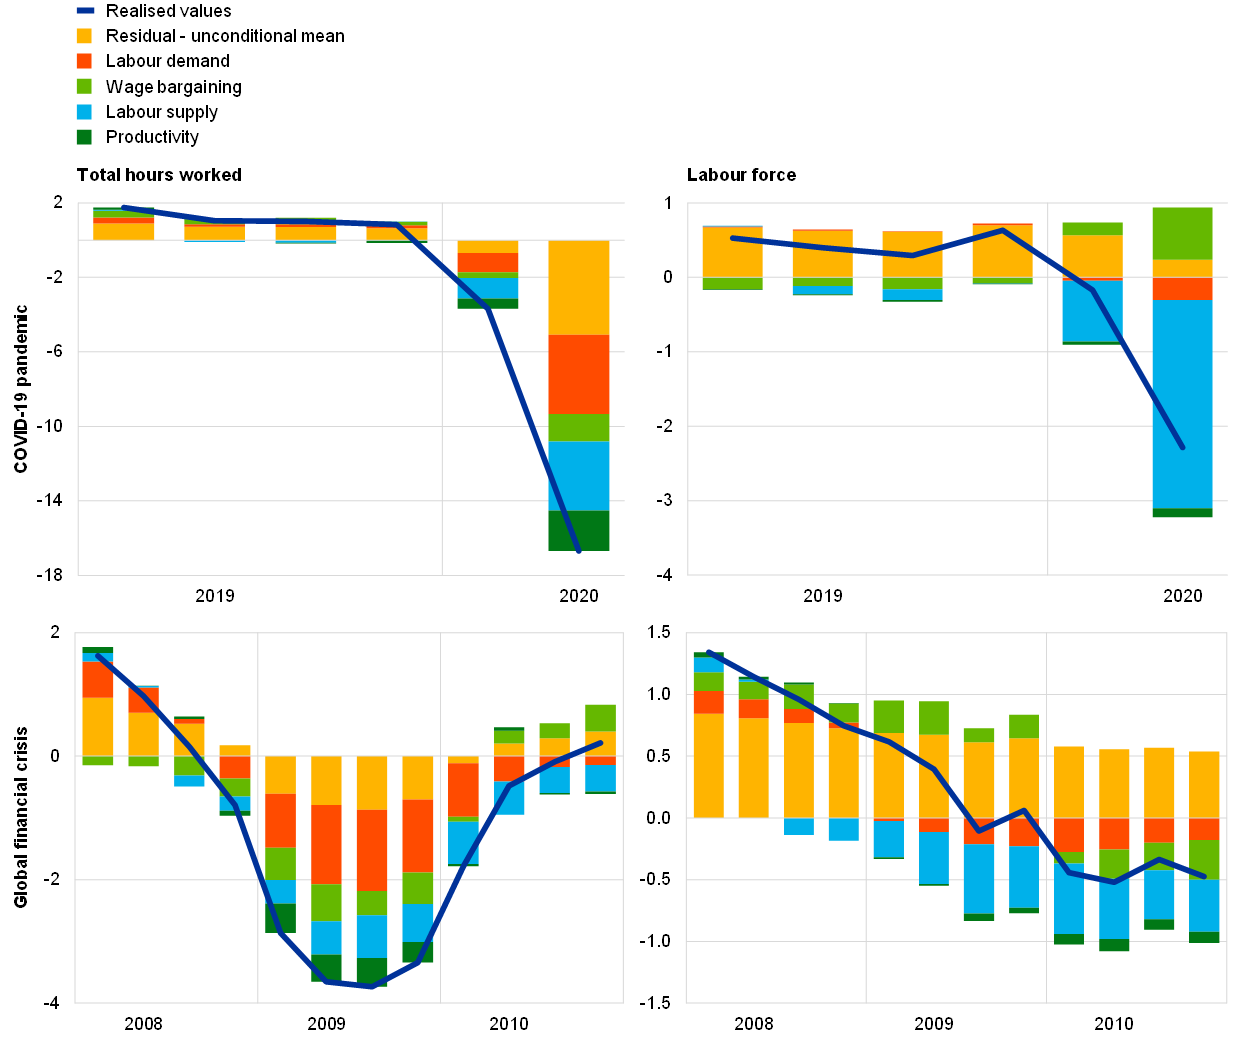
Sources: Eurostat and authors’ calculations.
While the responses of total hours worked and the size of the labour force have been significantly larger in the current COVID-19 pandemic than during the financial crisis, a comparison of the impacts of shocks in the two recessions highlights interesting similarities but also important differences. As in the current pandemic, the largest part of the decline in total hours worked during the financial crisis was also explained by labour supply, productivity and demand shocks (see Chart A, lower left panel). However, unlike in the current pandemic, the dominant shock during the trough of the financial crisis in 2009 was the demand shock, which accounted for a larger share of the decline in total hours worked than the two supply-side shocks. Finally, in both recessions, labour supply shocks were the main contributors to the decline in the labour force, which in both cases was accompanied by a decline in total hours worked.
Box 2
The impact of the COVID-19 crisis on the labour market in the United States
The broad-based shutdown of the US economy put in place to control the COVID-19 outbreak led to an unprecedented rise in unemployment and a fall in labour force participation. Between February and April 2020 around 25 million jobs were lost and the unemployment rate increased from 3.5% to 14.7% (see Chart A), with workers that were temporarily laid off accounting for 75% of the new unemployed.[7] In the first six weeks of the shutdown around 30 million people applied for unemployment benefit, while 8 million workers left the labour force in March and April.[8]
Chart A
Unemployment rate
(percentages of civilian labour force, seasonally adjusted)
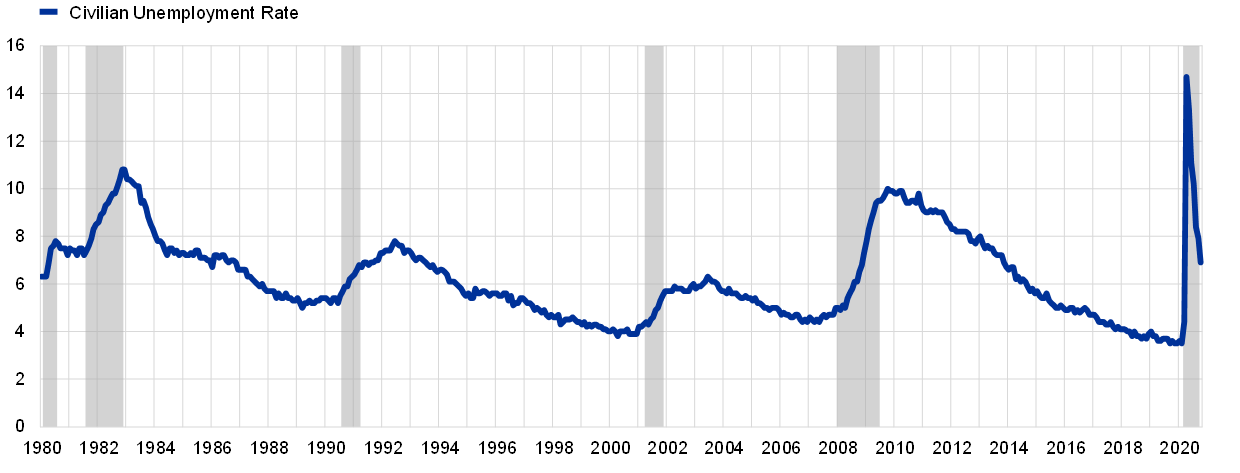
Source: Bureau of Labor Statistics (BLS).
Notes: Labour force data are restricted to people 16 years of age and older. Shading indicates recession dates announced by the NBER Business Cycle Dating Committee. Latest observation: October 2020.
The decline in employment has been unprecedented compared to previous recessions. One relevant aspect for understanding the increase in unemployment is its link to the decline in employment related to developments in labour force participation. Chart B shows that in past recessions the bulk of the increase in unemployment was related to the decline in employment. By contrast, in the COVID-19 crisis, not only has the decline in employment been high compared to previous recessions, but the decline in participation has also limited the increase in unemployment to a greater extent than in the past. Hours worked per worker also showed a slightly more marked adjustment than in previous recessions (see Chart B).
Chart B
Employment rate, labour force participation and average hours worked per week during the COVID-19 crisis and past recessions
(left-hand scale: percentage points; right-hand scale: percentage changes)
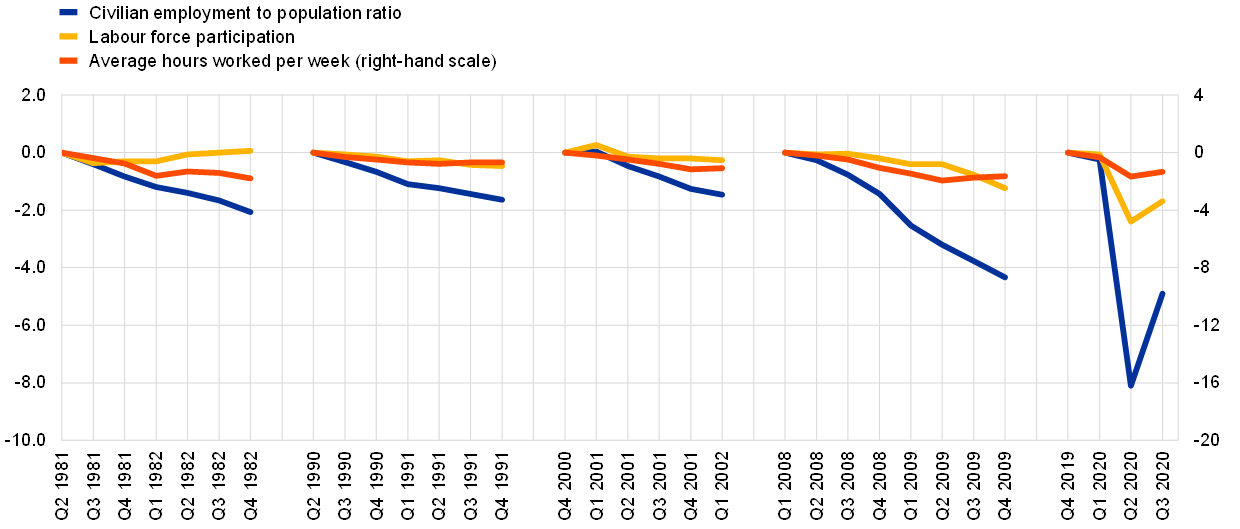
Sources: Bureau of Labor Statistics (BLS) and authors’ calculations.
Note: The chart shows cumulative developments over the course of each recession.
Despite the rapid bounce back of the labour market, it will take time for the unemployment rate to fall back to pre-COVID-19 levels. The unemployment rate declined to 6.9% in October, 7.8 percentage points below its April high. Between April and October, the number of employed workers increased by 16.4 million owing to the re-insertion into the labour market of temporarily laid-off workers. The number of hours worked per week has also shown signs of recovery. Nonetheless, according to the Federal Open Market Committee forecast released in September 2020, the unemployment rate is not expected to return to pre-recession levels until 2023.
3 Job retention schemes
Job retention schemes reached unprecedented levels in the first months after the onset of the COVID-19 pandemic and thus play an important role in explaining labour market developments in this period. In April 2020, when lockdown measures to contain the spread of COVID-19 were in place in most euro area countries, including the four largest ones, 15% of all employees in Germany, 34% in France, 30% in Italy and 21% in Spain were on short-time work (see Chart 4). While these levels have since declined, they still remain elevated. In the fourth quarter of 2020 the number of workers in job retention schemes is expected to increase in response to the new lockdown measures. To put these numbers into perspective, in 2009 the average share of employees participating in short-time work schemes reached 3.2% in Germany, 0.8% in France, 3.3% in Italy and 1.0% in Spain.[9] These schemes help to explain the adjustment in the labour market via average hours worked. They also help to explain why compensation per employee declined significantly in the euro area during the COVID-19 pandemic, while compensation per hour increased slightly over the same period (see Box 3).
Chart 4
Share of employees on job retention schemes
(percentages of employees)
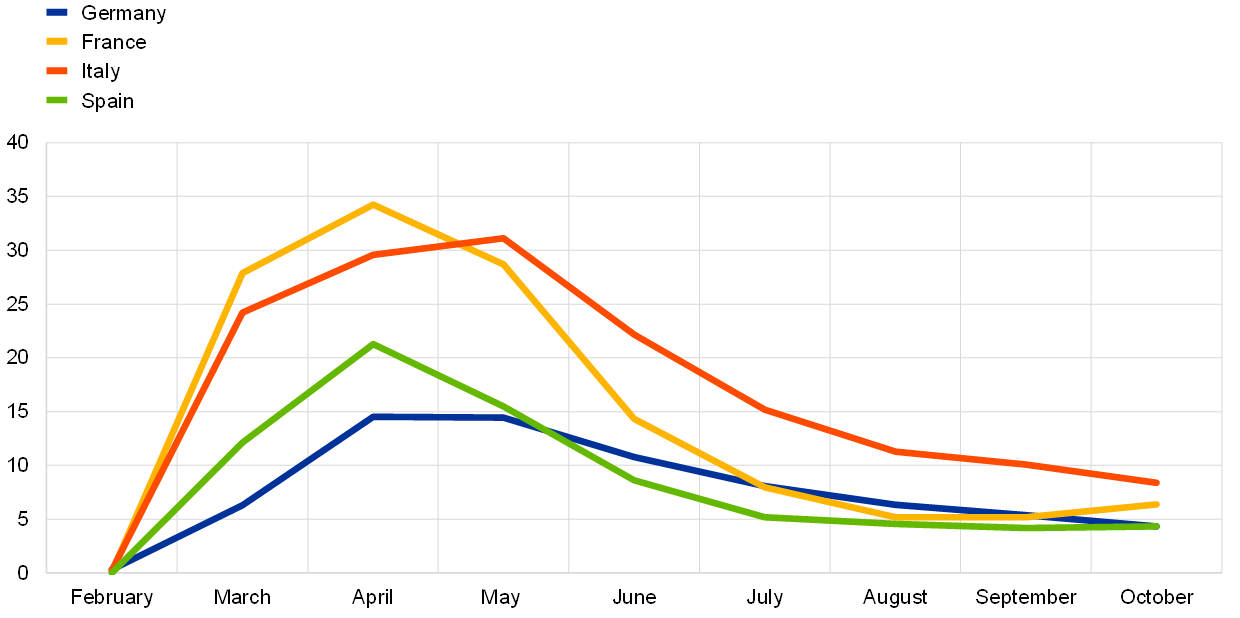
Sources: Authors’ estimates based on data from Eurostat, Institute for Employment Research (Institut für Arbeitsmarkt- und Berufsforschung – IAB), ifo Institute, Ministère du Travail, de l’Emploi et de l’Insertion, Instituto Nazionale Previdenza Sociale (INPS), and Ministerio de Inclusión, Seguridad Social y Migraciones.
The large number of workers on job retention schemes benefited from rapid policy responses to support the labour market during the early stages of the pandemic. National governments of euro area countries implemented extensive labour market policies at the onset of the COVID-19 pandemic. Job retention schemes featured prominently and were widely adopted across the euro area. These measures were designed to support workers’ incomes and to protect jobs in firms during the COVID-19 pandemic.[10] Some countries introduced new short-time work schemes and others overhauled existing schemes by increasing their generosity, broadening eligibility and reducing the administrative burden of accessing the schemes. There was also support for these schemes at EU level.[11]
Job retention schemes help to keep employment stable in the short term, but it is important to design them in a way that limits undesirable effects. In particular, these schemes played an important role at the onset of the COVID-19 pandemic when firms faced a sudden contraction in their sales. They helped to reduce firms’ liquidity needs, while allowing them to resume activity more swiftly after the lockdown by keeping employment relationships intact. Some studies have analysed the causal impact of short-time work on employment and concluded that these schemes helped to save jobs when firms faced a sharp drop in demand.[12] These effects could also be potentially higher for highly leveraged firms.[13] However, job retention schemes also entail some degree of deadweight losses (when they subsidise jobs that would not have been lost) and displacement effects (when they subsidise unviable jobs). Some studies suggest that short-time work schemes may decrease the allocative efficiency of the economy when used on a large scale for an extended period of time.[14] For these reasons they should be limited in duration in order not to hinder necessary economic restructuring, while remaining in place long enough to preserve viable jobs that might otherwise be lost.[15] These risks are likely to be significantly lower during the COVID-19 crisis than in cyclical downturns. In addition, some countries adjusted the generosity of their job retention schemes when extending their duration after the first months of the pandemic.
Structural features affect the margins of adjustment of the labour market, but the nature of the shock, in conjunction with the institutional frameworks of the labour market in Europe, led to widespread adoption of the intensive margin of adjustment. A number of euro area countries are characterised by relatively strict employment protection legislation, making the use of short-time work schemes more attractive than dismissals when firms are faced with a temporary drop in demand. In some countries, high employment protection leads to segmented labour markets and temporary workers are used as a buffer against demand fluctuations. However, the nature and magnitude of the COVID-19 crisis, and the implementation of measures to ease access to short-time work, led to widespread use of the intensive margin of adjustment across most euro area countries. This high reliance on the intensive margin of adjustment may also be reflected in lower job creation in the recovery period.
Box 3
Developments in compensation per hour and per employee since the start of the COVID‑19 pandemic
Aggregate wage growth is mostly assessed in terms of compensation per employee or compensation per hour worked. For the euro area these two indicators tend to move broadly in tandem during normal times (see Chart A, panel a). However, at other times they can diverge substantially, reflecting, for instance, (temporary) reductions in hours worked per employee (the “intensive margin”) where employees are not forced to absorb these reduced hours in their monthly salaries. Developments during the global financial crisis of 2008-09 provide a historical example.
The COVID-19 pandemic has led to a substantial divergence between compensation per employee and compensation per hour. This has been visible since the start of the pandemic, especially in the second quarter of 2020, when compensation per employee declined at an annual rate of 4.7% and compensation per hour increased by 9.3%, although the differences moderated again in the third quarter of 2020 (see Chart A, panel b). The number of workers on job retention schemes, which has remained elevated since the start of the pandemic and peaked in the second quarter (see Chart 4 in the main text), played a decisive role in these developments, especially via the implications for hours worked per person. Such schemes tend to have a downward effect on compensation per employee, as employees usually retain their employment status but face pay cuts when enrolling in these schemes. At the same time, they have an upward effect on compensation per hour, as hours worked tend to be reduced far more strongly than pay.[16] A further factor complicating the assessment of underlying wage trends during the pandemic is compositional effects. As employment declined particularly strongly among low-skilled jobs and young workers (see Chart 9 in the main text), which tend to be in the lower wage groups, compositional effects may currently be having an upward effect on wage developments.[17]
Chart A
Developments in selected wage indicators
(year-on-year percentage changes; percentage point contributions; quarterly data)
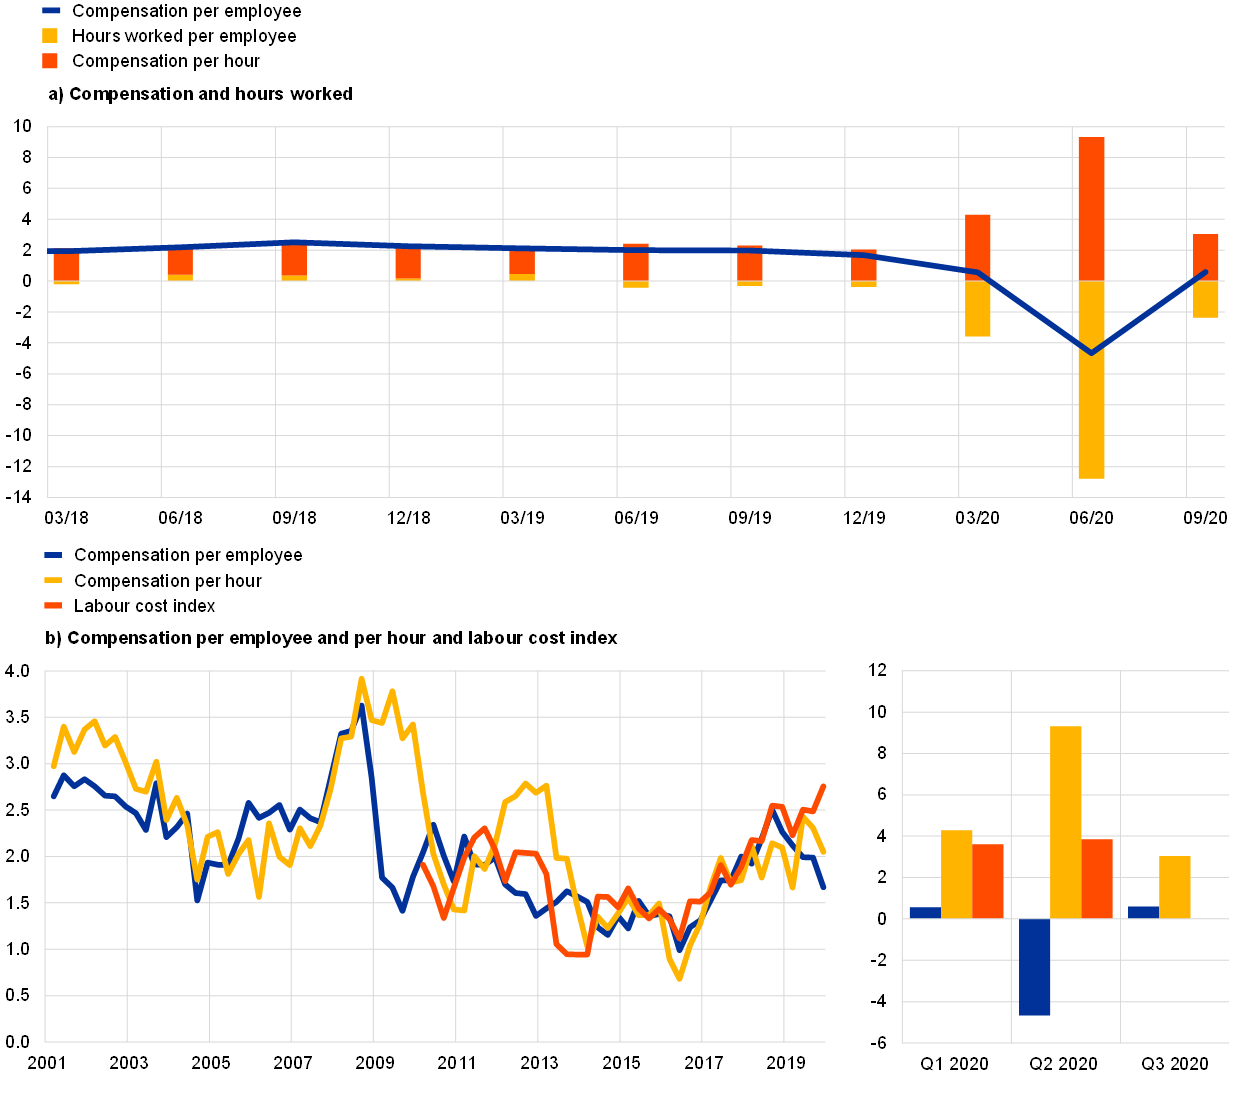
Sources: ECB, national central banks and Eurostat.
Notes: Given the recent strong movements observed in compensation per employee and compensation per hour, the year-on-year rates for the last three quarters are shown on a separate scale in panel b. Latest observation: second quarter of 2020 for the labour cost index and third quarter of 2020 for the rest.
The operation of government support measures complicates the assessment of underlying wage trends during the pandemic. First, information on how much of the aggregate compensation and how many of the employees are attributable to job retention schemes requires detailed data on wage replacement rates and take-up rates, which are published only with a considerable time lag. Second, the statistical recording can differ across countries. While in most large euro area countries the benefits provided under the support schemes are paid directly to employees and are recorded as social transfers, in the Netherlands, for example, employers receive a subsidy to finance their payments to employees. If the benefits are paid directly to employees but are recorded as social transfers, then compensation relative to the number of hours worked decreases and the schemes will have a strong downward effect on compensation per employee, while compensation per hour should be affected much less strongly. By contrast, in countries where a scheme is based on a subsidy paid to employers, who then pay salaries for hours not worked, the schemes should not lead to a strong reduction in compensation per employee but mainly imply a higher compensation per hour.
Against the background of scheme-related distortions in compensation per employee and per hour, relevant signals for wage cost developments might be distilled from, inter alia, Eurostat’s labour cost index (LCI), which effectively measures developments in compensation per hour, including employers’ social security contributions and taxes paid but subtracting subsidies received by employers. According to the LCI, in the second quarter of 2020 hourly labour costs in the euro area rose by 4.2% compared with the same quarter in the previous year (see chart A, panel b), which was substantially lower than the increase in compensation per hour.[18] This indicates that the decrease in the number of hours worked due to the COVID-19 crisis was not fully matched by a corresponding increase in firms’ costs, as in some cases firms received subsidies introduced by euro area governments to support job retention during the crisis.
Overall, wage developments are an important determinant of price pressures in the euro area.[19] The strong and unprecedented divergence in the development of different wage indicators in the COVID-19 crisis and the large and heterogeneous effects of job retention schemes across euro area countries complicate the assessment of underlying wage pressures and thus also their impact on prices. This highlights the importance of the availability of detailed and timely information on the impact of such schemes on indicators of wage growth.
4 Using high-frequency indicators to assess labour market developments
High-frequency indicators are a useful tool for gaining a timely understanding of labour market developments, particularly in periods of rapid and drastic changes in economic activity. For example, Google Trends provides information about the interests of people using the Google search engine to search specific topics, such as job retention schemes and unemployment conditions. Two other sources that can be used as a more direct measure of demand conditions in the labour market are Indeed job postings and the LinkedIn hiring rate.[20] The number of job postings on Indeed can be used as a proxy for changes in labour demand, while the LinkedIn hiring rate provides complementary information about the number of job changes. These indicators are available well ahead of the publication of official labour market statistics and thus provide valuable timely information which can aid the early identification of changes in labour demand and job findings. However, they need to be used as a complement to official statistics as they do not follow the same sampling rules and may not represent developments in the population with the same accuracy as official labour market statistics.
The Google Trends high-frequency awareness indicator on job retention schemes and unemployment conditions peaked after the start of lockdown in the five largest euro area countries (see Chart 5). The awareness indicator on job retention schemes and unemployment conditions is based on Google Trends data and is constructed by looking at searches related to lay-offs, short-time working, furlough and unemployment. This indicator provides daily information on the level of interest of users in the labour market situation. In particular, Google searches related to job retention schemes and unemployment conditions skyrocketed in mid‐March, with a relatively good match between peak interest in the labour market situation and the starting dates of the lockdowns implemented in the five largest euro area countries.[21] As containment measures eased, the awareness indicator reverted to its usual levels.[22]
Chart 5
Awareness indicator on job retention schemes and unemployment conditions
(index: 100 = peak interest)
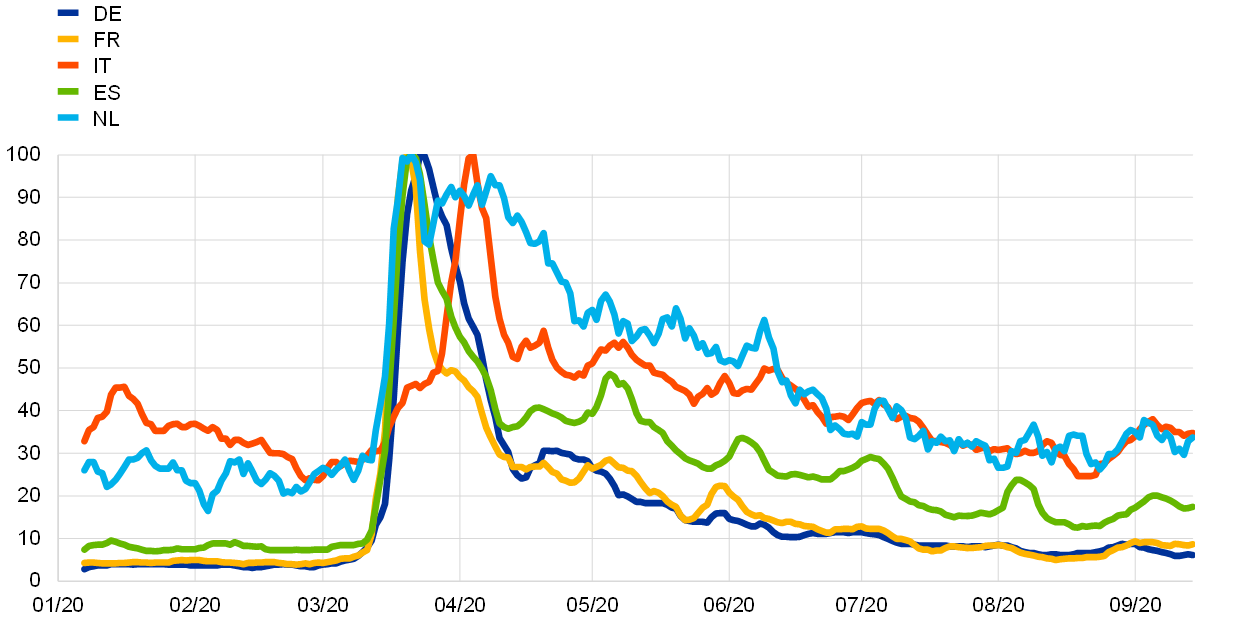
Sources: Google Trends and authors’ calculations.
Notes: The value of 100 represents the peak interest in the topic. The awareness indicator is constructed as a seven-day moving average of the daily Google Trends popularity of the terms “lay-off”, “short-time working”, “furlough” and “unemployment”. Latest observation: 15 September 2020.
The hiring rate and job postings indicators provide further evidence of the strong impact of the pandemic on the labour market. The LinkedIn hiring rate indicator is more closely related to job-to-job transitions and the job-finding rate, while the Indeed job postings indicator reflects developments in labour demand and may be regarded as an indicator of vacancies. Both indicators declined sharply in March and April as the pandemic took hold and lockdown measures were implemented (see Chart 6). The hiring rate bottomed out in May and recovered substantially thereafter, but remains at much lower levels than in the previous year. Job postings followed the same declining pattern as the hiring rate, but have only started to recover at a slow pace and remain at broadly the same low levels as those reached in May. The difference between the two indicators may reflect the fact that some new hires are occurring on the basis of past vacancies or through referrals.
Chart 6
High-frequency labour market indicators: hiring rate and job postings
(year-on-year growth rates, percentages)
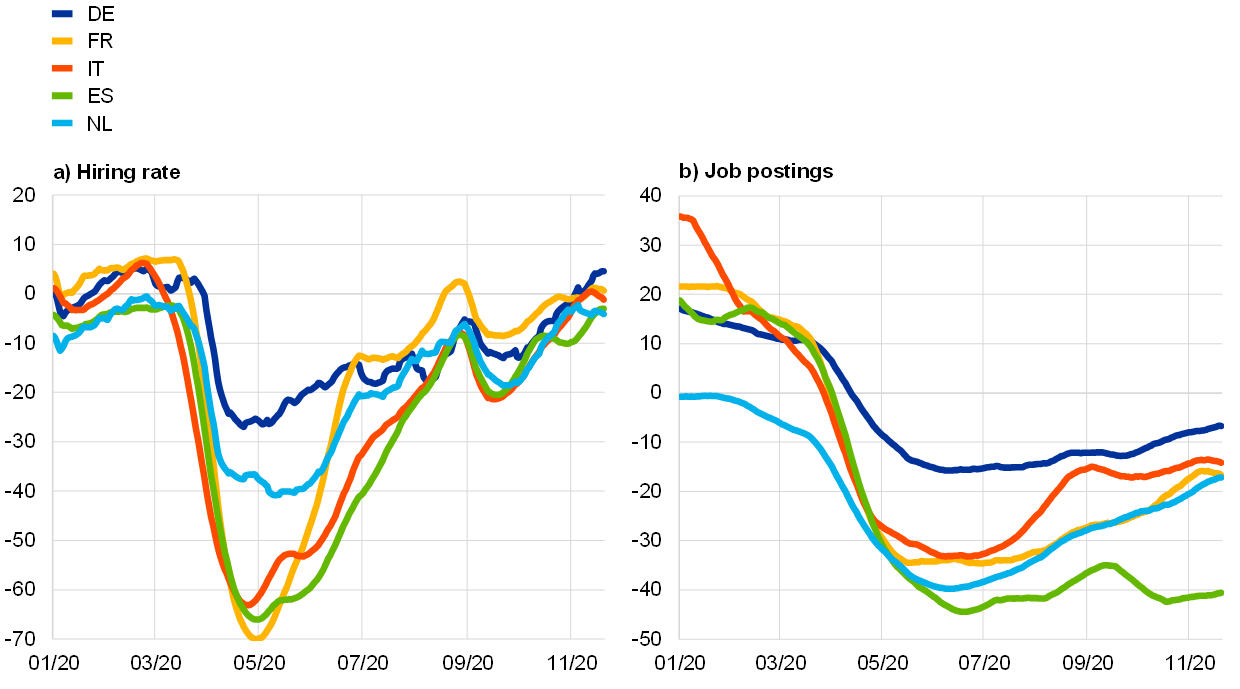
Sources: LinkedIn, Indeed and authors’ calculations.
Notes: The methodology behind the high-frequency indicators on new hires and job postings is documented in the box entitled “High-frequency data developments in the euro area labour market”, Economic Bulletin, Issue 5, ECB, 2020. Latest observation: 20 November 2020.
5 The impact of the crisis across countries, activity sectors, demographic groups and types of job
The COVID-19 pandemic is having a heterogeneous impact on euro area labour markets across various dimensions. This section analyses differences in the impact of the pandemic across euro area countries and across activity sectors, as some sectors are more exposed to changes in demand patterns than others. It also analyses the impact of the pandemic across demographic groups and types of employment contract. In addition, the section discusses the adoption of teleworking during the pandemic and the potential for its further use.
The impact of the COVID-19 pandemic on the labour market is very negative and widespread across euro area countries. Lockdown restrictions across the euro area began to be introduced at the end of February and began to be eased from mid-May. While the precise start and end dates of the lockdown restrictions varied, the bulk of the impact on economic activity and job losses materialised in the second quarter of 2020. Chart 7 shows the cumulative impact on the labour market of the pandemic in the first three quarters of 2020 across the five largest euro area countries. While the contraction in employment was substantial across all large countries, there is some cross-country heterogeneity, reflecting differences in the intensity of policy responses to the pandemic and in the sector compositions of the economies.
Chart 7
Changes in employment and hours worked
(index: Q4 2019 = 100)

Sources: Eurostat and authors’ calculations.
Total hours worked declined in all main sectors in the euro area in the second quarter of 2020. The extent of the decline was different across sectors, partly reflecting the strictness of the lockdown measures affecting each sector.[23] A comparison with the first quarter of 2009, when growth in employment and total hours worked reached a trough during the financial crisis, shows that the quarter-on-quarter decline in total hours worked was larger in all key sectors in the recent pandemic-related recession (see Chart 8). Quarter-on-quarter, the decline in total hours worked in recreation services in the second quarter of 2020 was 40 times larger than the corresponding decline recorded in the first quarter of 2009, while in the trade and transport sector, the decline was 15 times larger. Employment growth in the second quarter of 2020 was also more varied across key sectors than in the first quarter of 2009. Still, the sectoral pattern of the decline in total employment is more comparable than the sectoral pattern of the decline in total hours worked to the pattern observed during the financial crisis. This reflects the widespread use of job retention measures to stabilise employment in the current pandemic recession. While job retention schemes have helped to stabilise employment, such policies may also hinder the efficient reallocation of workers across sectors. Such reallocation is expected to be larger the longer the pandemic lasts.
Chart 8
Total hours worked and total employment in the euro area across sectors
(quarter-on-quarter rates of change, percentages)
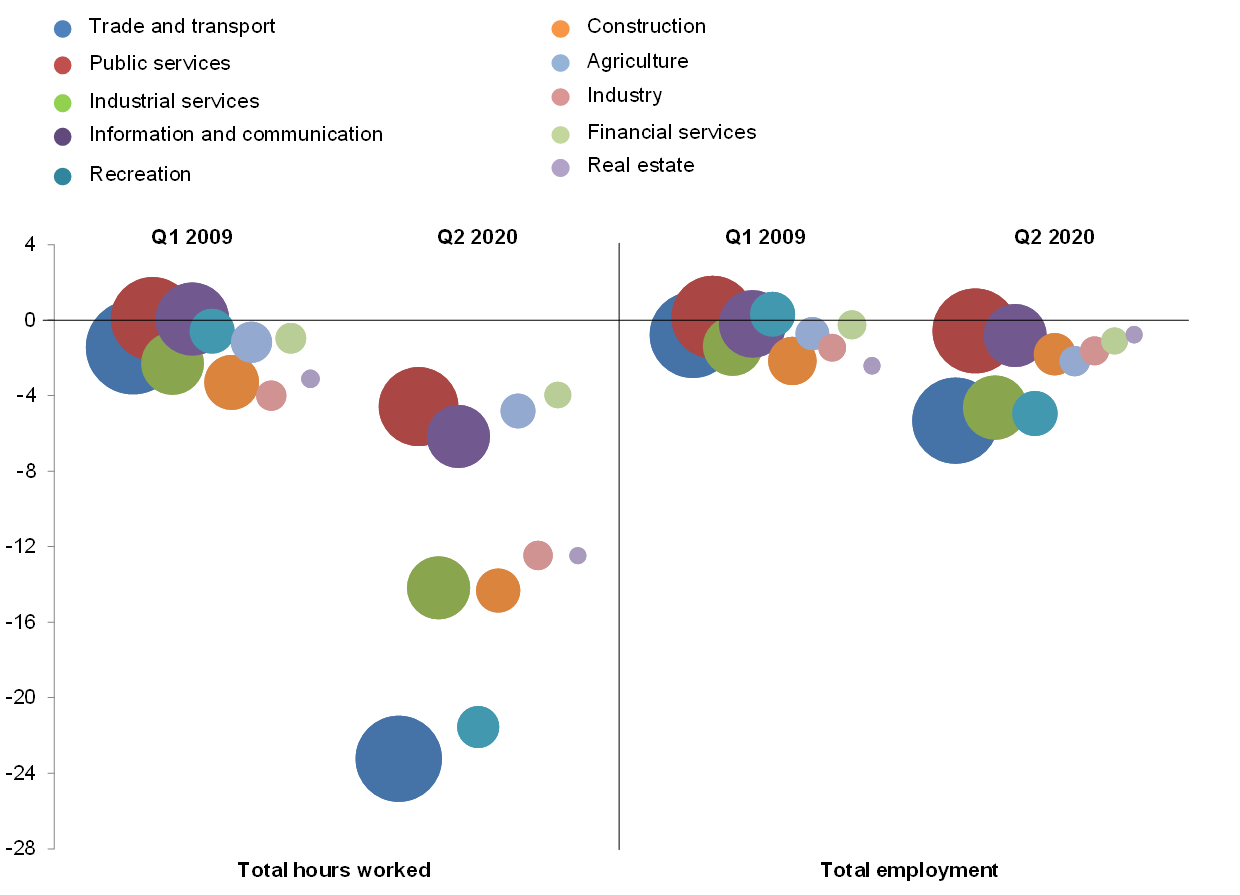
Sources: Eurostat and authors’ calculations.
Note: The area of the bubbles reflects the share of the respective sector in the total economy.
The decline in employment was strongest for temporary employees, the young and workers with low levels of education. Chart 9, panel a, shows that employment of workers with a high level of education was virtually unaffected by the pandemic, whereas workers with a low level of education saw a sharp decline in their employment. Likewise, young workers were disproportionately affected when compared to older workers. Employment also declined more for women than for men, although the difference is relatively small. Across contract types, employment decreased most for temporary employees (see Chart 9, panel b). In line with the fall in employment, the youth unemployment rate increased significantly more than the overall unemployment rate (see Chart 9, panel c).
Chart 9
Change in the labour market in the euro area across demographic groups and types of employment in the first half of 2020
(panels a and b: percentage changes, cumulative growth, Q4 2019 to Q2 2020; panel c: percentages)

Sources: Eurostat and authors’ calculations.
Notes: Calculation in panels a and b based on the aggregate of all euro area countries with the exception of Germany, for which no data were available. The latest observation for the unemployment rate is October 2020.
Remote working has the potential to mitigate the economic costs of stay-at-home and social distancing policies. The COVID-19 crisis and related policies have resulted in the more widespread adoption of teleworking. More than a third of workers in Europe began to telework as a result of the pandemic.[24] This is likely to have supported employment and hours worked in some sectors and for some workers, in particular those with a high level of education. Among those who worked remotely during the pandemic, a large majority had previous teleworking experience, suggesting that investigating the pre-COVID-19 distribution of teleworkable jobs could provide insights into the dynamics of the European and euro area labour markets in the context of the pandemic (see Box 4).
Box 4
Teleworkable jobs
This box analyses teleworking patterns in the EU and the United Kingdom. In order to disentangle occupations which can be performed from home from those which require presence in the workplace, we combine a teleworking index with individual-level data for 2019 for EU Member States and the United Kingdom.[25] Potentially teleworkable occupations include clerks, information and communication technicians, and most managers and professionals. On the other hand, some jobs in, for example, sales, cleaning and health rely on workplace attendance in order to be carried out.
In 2019 teleworkable jobs accounted for 33% of employees and 46% of annual earnings in the euro area, suggesting that remote working is more prevalent in highly-paid jobs (see Chart A). These shares each increase by one percentage point when also considering other EU countries and the United Kingdom. Despite methodological differences, the results are similar to those for the United States, where 37% of jobs and 46% of wages were identified as suitable for teleworking (Dingel and Neiman, 2020). In the euro area, the share of teleworkable jobs is highest in the information and communication sector and lowest in agriculture. Occupations which are conducive to teleworking account for 83% of employees and 87% of annual earnings in the information and communication sector. In agriculture, by contrast, teleworking is only possible for 7% of workers, but their earnings represent almost one fifth of total earnings in the industry. Sectors where more than 40% of jobs can be performed remotely, namely education, financial activities, public administration, real estate and other administrative activities, account for around 30% of total employees in the euro area. The remaining 70% of employees are spread across industries where remote working is an option for no more than 25% of workers. In addition, less than 10% of potential teleworkers in the euro area report working from home either usually or sometimes, meaning that two-thirds of workers might not be familiar with remote working.[26]
Chart A
Share of annual earnings and employees in potentially teleworkable jobs in the euro area by sector
(percentages)

Sources: Index: Dingel and Neiman (2020); data: EU-LFS 2019, EU-SILC 2018, SOEP (2019); and authors’ calculations.
Notes: For the euro area and each sector, the chart shows the share of annual earnings generated by potential teleworking jobs (orange bar) and the share of employees in potential teleworking jobs (blue dot), including those who currently telework (green bar) and those who don’t (yellow bar). The figures below the bars show the percentage of the total workforce and the percentage of all potential teleworkers in each sector. Teleworking index aggregated at the ISCO-08 2-digit level using employee weights. Slovakia, Slovenia and Malta are not included.
The share of employees in potentially teleworkable jobs is above 50% in the capital regions of the United Kingdom, Belgium, France, Luxembourg and Sweden, while it is around 20% in some regions of Spain, Greece and Romania (see Figure A). Similarly, the share of workers who work from home either regularly or occasionally varies substantially across regions. As many as 70% of potential teleworkers report working from home in Stockholm, while this share is around 45% in Paris and London. On the other hand, less than 10% of potential teleworkers engage in remote working in Italy. These pre-pandemic differences in potential and actual take-up rates for teleworking suggest that there were differing degrees of preparedness to promptly deploy remote working as a tool to cope with the pandemic across European regions. Such differences might arise, for instance, from heterogeneous social norms and stigma linked to working from home, as well as from limitations related to digital equipment and skills. The latter refers to a bundle of tools which would ease remote working, ranging from suitable broadband connections to training aimed at addressing the challenges of remote working environments. Looking ahead, the COVID-19 crisis could accelerate the adoption of teleworking and reduce the digital divide across European countries if countries that are lagging behind invest more in digital technologies.[27]
Figure A
Share of potential teleworkers who work from home at least sometimes across EU regions

Sources: Index: Dingel and Neiman (2020); data: EU-LFS 2019; and authors’ calculations.
Notes: A low potential for teleworking indicates that the share of potentially teleworkable jobs in the area is below 30%.Teleworking index aggregated at the ISCO-08 2-digit level using employee weights. NUTS level is NUTS2, except for the Netherlands (NUTS0) and the United Kingdom (NUTS1). Outermost regions and Malta are not included.
6 Concluding remarks
The large government support in the form of job retention schemes alleviated the impact of the pandemic on the labour market. It is estimated that in April the number of workers in these schemes reached 32 million, which was almost three times higher than the number of unemployed. The number of furloughed workers has since declined and was estimated at around 8 million in October 2020. Owing to the very large number of workers subject to temporary conditions, caution is required when interpreting official labour market statistics. In particular, job retention schemes have helped to contain a further increase in unemployment and a stronger decrease in employment. However, it remains unclear how many of these workers will successfully move back to their normal working hours and how many may be at risk of losing their jobs. The still large number of workers in job retention schemes and the sharp decline in labour market participation suggest that the slack in the labour market is substantially greater than captured by the unemployment rate. The reliance on job retention schemes was also complemented by the adoption of labour market policies at EU level, including the European instrument for temporary support to mitigate unemployment risks in an emergency (SURE). This created a Union-wide solidarity toolkit to help national governments address sudden increases in public expenditure in order to preserve employment.
The crisis is likely to lead to an increase in labour reallocation needs, and these are expected to be greater the longer the pandemic lasts. The current set of labour market policies was designed with a view to protecting workers from a temporary adverse shock to the economy. They have helped protect household income and limit negative feedback loops. Labour reallocation will crucially depend on the duration of the crisis and possible structural shifts in demand. However, the longer the shock lasts, the more job reallocation may be required. The COVID-19 shock is also boosting the automation and digitalisation process, and the skills content of existing jobs may need to be upgraded, which may increase the mismatch in the labour market.[28] In this context, job retention schemes could combine employment protection with training provision with a view to facilitating restructuring and supporting the upgrading of skills. In addition, the heterogeneous impact of the pandemic across countries may have scarring effects and lead to further divergence between euro area labour markets. Greater skills mismatches and more geographic dispersion in the unemployment rate were a persistent outcome of the previous crisis and led to an increase in the average duration of unemployment, which can eventually lead to higher structural unemployment.[29]
The consequent decline in household income was buffered to some extent by fiscal subsidies, job retention schemes and other support measures.
Persons available for but not seeking work increased by 3.2 million in the first half of 2020, which represents 86% of the total decline in the labour force as measured by the Labour Force Survey. A broad measure of labour underutilisation which includes the unemployed, persons available but not seeking, persons seeking but not available and part-time workers who wish to work more hours increased from 14.6% to 16.3% of the extended labour force between the fourth quarter of 2019 and the second quarter of 2020. The extended labour force includes persons available but not seeking and persons seeking but not available, in addition to the employed and unemployed.
This long-term relationship between the main labour market aggregates and GDP can be estimated using either a static or a dynamic approach. The static approach ignores both the short-run and the long-run dynamics of the adjustment of the labour market to fluctuations in the business cycle, whereas a dynamic approach allows for a protracted response of the unemployment rate, employment and total hours worked to the observed changes in GDP. Independently of the estimation approach, this long-term relationship helps to quantify the observed decline in employment and total hours worked and the observed increase in the unemployment rate as a result of the fall in economic activity in the first half of 2020.
The restrictions on the impact of shocks on the endogenous variables can be derived from theoretical economic models. For a description of a similar model and an explanation of the restrictions, see Foroni, C., Furlanetto, F. and Lepetit, A., “Labor Supply Factors and Economic Fluctuations”, International Economic Review, Vol. 59, Issue 3, 2018, pp. 1491-1510.
The shocks are obtained by estimating an SVAR model with time-invariant parameters for the euro area, with the sign restrictions defined in Table A, from the second quarter of 1995 to the fourth quarter of 2019. The shocks for the first and second quarters of 2020 are obtained on the basis of the estimated past shocks, the estimated parameters and the available data for the four variables in this period. While the model is estimated using quarterly changes of the endogenous variables, the charts in this box show the decomposition of the changes transformed into annual rates of change. The residual component captures the unconditional mean of the variables.
In the first quarter, the pandemic impacted the economy primarily in the last month, March. Looking at the results for the first two quarters of 2020 provides a similar picture to the one described here for the second quarter of 2020.
In the United States, workers on temporary lay-offs are those classified as unemployed who have been given a date to return to work or who expect to return to work within six months.
The severe adjustment took place despite the introduction of measures to contain unemployment, including: (i) the Paycheck Protection Program, which provides loans and guarantees to companies with up to 500 employees to cover payroll costs, mortgage or rent payments, utilities and health benefits, where the loans are eligible for partial or total forgiveness if the firm maintains most of its pre-crisis employees on the payroll; and (ii) the Employee Retention Tax Credit, a tax credit equal to 50% of the qualified wage paid by eligible employers until the end of 2020, provided businesses keep workers on their payroll.
See OECD Employment outlook 2010: Moving beyond the Jobs Crisis, OECD, 2010.
See the box entitled “Short-time work schemes and their effects on wages and disposable income”, Economic Bulletin, Issue 4, ECB, 2020.
In May 2020 the Council of the European Union adopted a European instrument for temporary support to mitigate unemployment risks in an emergency (SURE).
See, for example, Hijzen, A. and Martin, S., “The role of short-time work schemes during the global financial crisis and early recovery: a cross-country analysis”, IZA Journal of Labor Policy, Vol. 2:5, 2013; and Balleer, A., Gehrke, B., Lechthaler, W. and Merkl, C., “Does short-time work save jobs? A business cycle analysis”, European Economic Review, Vol. 84, 2016, pp. 99-122.
See Cahuc, P., Kramarz, F. and Nevoux, S., “When Short-Time Work Works”, IZA Discussion Papers, No 11673, 2018.
See, for example, Cooper, R., Meyer, M. and Schott, I., “The Employment and Output Effects of Short-Time Work in Germany”, NBER Working Paper, No 23688, 2017; and Giupponi, G. and Landais, C., “Subsidizing Labor Hoarding in Recessions: The Employment & Welfare Effects of Short Time Work”, CEP Discussion Papers, No 1585, Centre for Economic Performance, London School of Economics and Political Science, 2018.
For a discussion, see Arpaia, A., Curci, N., Meyermans, E., Peschner, J. and Pierini, F., “Short time working arrangements as response to cyclical fluctuation”, European Economy Occasional Papers, No 64, European Commission, 2010; and Costa Dias, M., Joyce, R., Postel-Vinay, F. and Xu, X., “The Challenges for Labour Market Policy during the COVID-19 Pandemic”, Fiscal Studies, Vol. 41(2), 2020, pp. 371-382.
See also the box entitled “Short-time work schemes and their effects on wages and disposable income”, op. cit.
For a discussion of such compositional effects and their impact on euro area wage developments in previous crises, see the article entitled “The effects of changes in the composition of employment on euro area wage growth”, Economic Bulletin, Issue 8, ECB, 2019.
The stronger increase in the LCI in 2019 was partly linked to a permanent reduction in employers’ social security contributions in France, replacing the tax credit for employment and competitiveness (crédit d’impôt pour la compétitivité et l’emploi – CICE), from the first quarter of 2019.
See, for example, the box entitled “The role of wages in the pick-up of inflation”, Economic Bulletin, Issue 5, ECB, 2018.
See, for example, the box entitled “High-frequency data developments in the euro area labour market”, Economic Bulletin, Issue 5, ECB, 2020.
The awareness indicator peaked one day after the lockdown started in Germany, three days after the lockdown started in France, seven days after the lockdown started in Spain, and six days after the lockdown started in the Netherlands. By contrast, in Italy the peak of the awareness of job retention schemes and unemployment conditions was slightly delayed relative to the start of the containment measures in that country.
This reflects not only the improvements observed in economic activity following the easing of containment measures and then the easing of the restrictions on travel within the euro area, but also a decrease in the uncertainty associated with the implementation and use of job retention schemes in the labour market and with their impact on labour market conditions in the five largest euro area countries.
For a discussion on how various sectoral outcomes may be related to euro area macroeconomic projections, see the box entitled “Alternative scenarios for the impact of the COVID-19 pandemic on economic activity in the euro area”, Economic Bulletin, Issue 3, ECB, 2020.
See “Living, working and COVID-19: First findings – April 2020”, Eurofound, 2020.
The teleworking index is based on Dingel, J.I. and Neiman, B., “How many jobs can be done at home?”, Journal of Public Economics, Vol. 189, 2020, pp. 1-8. Dingel and Neiman assign to occupations a degree of teleworkability ranging from 0 to 1, where 0 implies that no jobs in that occupation can be performed via teleworking and 1 implies that all jobs in that occupation can be performed via teleworking. In this analysis, the classification is applied to the International Standard Classification of Occupations (ISCO-08) via a crosswalk table provided by the United States Bureau of Labor Statistics (see “Crosswalks between the 2010 SOC and systems used by other Federal and international statistical agencies”, Bureau of Labor Statistics, 2012). In addition, we use employee weights to match the index to a broader ISCO-08 aggregate. The purpose of this exercise is to combine the index with individual-level data, namely from the European Labour Force Survey (EU-LFS), European Statistics on Income and Living Conditions (EU-SILC) and the German Socio-Economic Panel (SOEP). For each data source, we consider the most recent survey available – 2019 for EU-LFS and 2018 for the EU-SILC and SOEP (see “Socio-Economic Panel (SOEP), data from 1984-2018”, version 35, SOEP, 2019). Occupations with a teleworkability score above 0.5 are identified as suitable for remote working.
The Labour Force Survey asks respondents whether they work from home. However, an answer of “usually” or “sometimes” does not necessarily mean that the individual teleworks or that their job is entirely teleworkable. For instance, teachers might say that they work from home at times to prepare classes, but this does not necessarily mean that they have taught a class from home.
See the article entitled “The digital economy and the euro area” in this issue of the Economic Bulletin.
For a discussion of the implications of digitalisation for European labour markets, see “Virtually Everywhere? Digitalisation and jobs in the euro area” (Part 1) and (Part 2), The ECB Podcast, Episodes 9 and 10, ECB, September 2020; and Anderton, R., Jarvis, V., Labhard, V., Morgan, J., Petroulakis, F. and Vivian, L., “Virtually Everywhere. Digitalisation and the euro area and EU economies”, Occasional Paper Series, No 244, ECB, 2020.
See the article entitled “The impact of COVID-19 on potential output in the euro area”, Economic Bulletin, Issue 7, ECB, 2020.