
- SPEECH
- Lisbon, 17 February 2020
The analytical contribution of external statistics: addressing the challenges
Keynote speech by Philip R. Lane, Member of the Executive Board of the ECB, at the Joint European Central Bank, Irving Fisher Committee and Banco de Portugal conference on “Bridging measurement challenges and analytical needs of external statistics: evolution or revolution?”
Introduction
It is a pleasure to speak at this first edition of the conference on external statistics, which is jointly organised by Banco de Portugal, the Irving Fisher Committee and the European Central Bank.[1] Not only as a central banker but also during my time in academia, I have spent much of my time analysing data on external transactions and international investment position. So it should come as no surprise that I take a very active interest in the programme of this event and look forward to the discussions today.
It is fair to say that the richness and availability of external statistics has increased considerably over the last 20 years. At the same time, the measurement challenges have increased, meaning that there are still many analytical hurdles to overcome when interpreting external statistics.
For the ECB, high-quality measurement of cross-border statistics is centrally important to the ECB for several reasons. First, the euro area is closely integrated into the global economy, both on the real side – via trade linkages and participation in global value chains (Chart 1) – but also on the financial side – as indicated by the size of euro area external assets and liabilities (Chart 2). Second, the current account balance of the euro area is a primary macroeconomic variable and the underlying shifts in the current account have widespread implications for the overall real and nominal dynamics of the euro area.
It follows that accurately measuring the external sector of the euro area is central to understanding exposures to external shocks and the international transmission of the ECB’s policies.
In my remarks, I will first discuss some of the globalisation-related measurement challenges that are affecting the real side of external statistics, before turning to the financial side. I will then highlight some of the ongoing initiatives to address these measurement challenges and outline some ideas to enhance the external statistics compilation framework, with a focus on the euro area.
Euro area trade and global value chain participation
(percentages of euro area GDP (left side); percentages of total exports (right side))
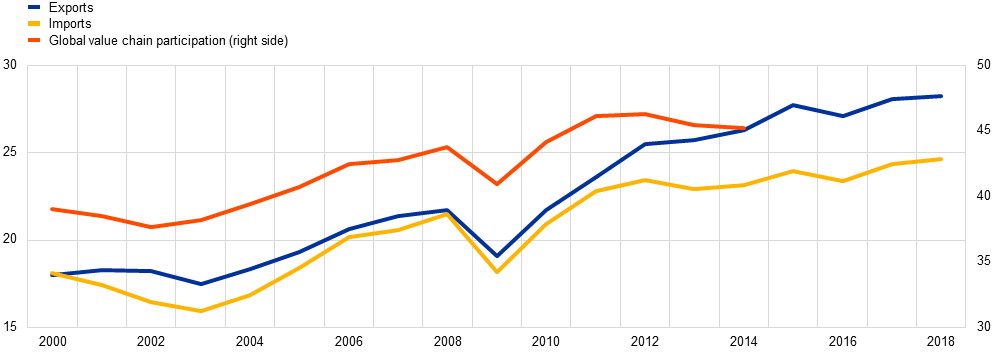
Sources: ECB, Eurostat and World Input-Output Database.
Notes: The data refer to extra-euro area trade. The exports and import data account for goods and services. Global value chain participation is measured as the share of gross exports that cross at least three borders. The latest observation for trade is 2018 and for global value chain participation is 2014.
Euro area external assets and liabilities
(percentages of euro area GDP)
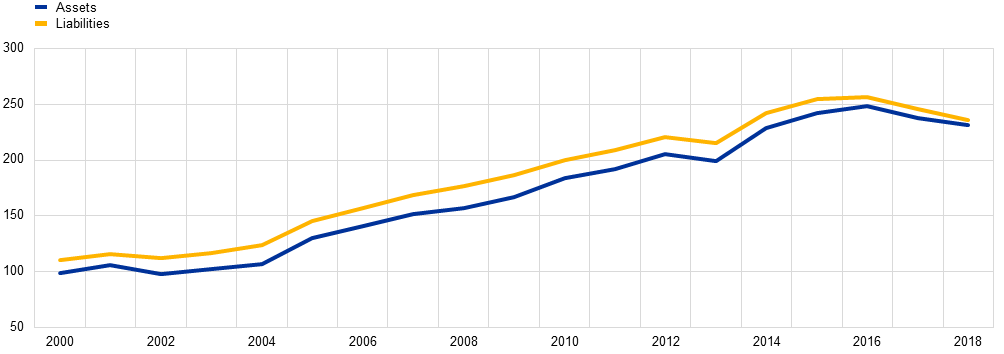
Sources: ECB and Eurostat.
Notes: The data refer to positions vis-à-vis extra-euro area counterparts. The latest observation is for 2018.
Measuring the real side of globalisation
The increase in international trade has been accompanied by the rise of complex production chains involving firms specialising in different stages of production. The global production network includes both multinational enterprises (MNEs) – large, profitable global firms – and also smaller and often highly specialised firms.[2] By now, it is well recognised that MNEs have complex organisational structures which frequently involve numerous legal entities, including special-purpose entities (SPEs). This complexity influences balance of payments (b.o.p.) statistics in various ways. The size of transactions related to MNEs, which are often intra-firm, poses challenges to the interpretation of balance of payments and national accounts statistics. The impact in terms of the magnitude and volatility of statistical indicators is especially visible in financial centres and small, very open economies where global firms are large relative to the size of the domestic economy. However, these factors are also increasingly relevant in understanding the external statistics of the aggregate euro area and other large economies.
In relation to measuring international trade, cross-border production arrangements, such as contract manufacturing, have considerable implications for concepts that are central to the b.o.p. and national accounts.[3] Such arrangements may involve foreign subsidiaries (offshoring) or an arms-length relationship with an unrelated company (outsourcing). The extent to which such production arrangements matter for the euro area trade balance can be seen by comparing data on trade in goods between the b.o.p and international trade statistics. This is possible because of an important methodological difference between the two datasets: b.o.p data are based on the concept of change in economic ownership, while trade statistics measure all goods crossing a border. In terms of the goods trade balance for the euro area, the gap between these two datasets has been growing over time, in particular since 2015 (Chart 3).[4] This divergence has been driven by euro area financial centres with a high presence of MNEs.[5]
Euro area goods trade balance
(EUR billions)
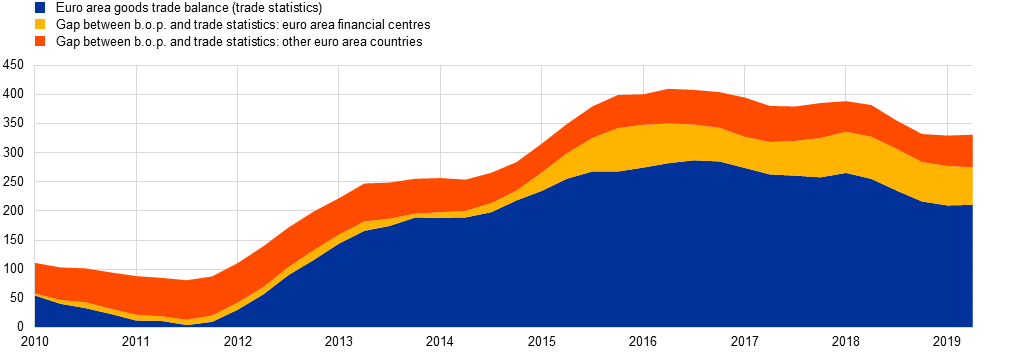
Sources: Di Nino, V., Habib, M.M. and Schmitz, M. (forthcoming) based on ECB and Eurostat.
Notes: The blue area shows the net exports of the euro area as recorded in trade statistics. The yellow and orange areas depict the difference between b.o.p. and trade statistics in financial centres and other euro area economies, respectively. The group of financial centres includes Belgium, Cyprus, Ireland, Luxembourg, Malta, Netherlands. Four-quarter moving sums. The latest observation is for the second quarter of 2019.
This episode illustrates how b.o.p data and, by extension, also national accounts statistics can be affected by exports of goods that are not produced domestically and also do not cross the border of the domestic economy. In line with this, recent ECB research (already presented in session 2 of this event) finds that the trade surplus of euro area financial centres is mainly generated by foreign value added.[6] Notably, the pricing of the various transactions involved in cross-border production arrangements, in particular if these are intra-firm, substantially affects the amount and location of profits booked, reflecting the well-established concept of transfer pricing.
Over time, the location of corporate structures has become increasingly mobile. This is partly driven by the redomiciliation of headquarters and the increased relevance of intangible assets, such as patents and copyrights. These intellectual property products (IPPs) are particularly important for digital companies, but are also relevant in other industries such as the pharmaceutical sector. IPPs can easily be moved across borders, including to jurisdictions that offer favourable tax treatment for profits arising from such assets. Typically, one entity of an MNE group owns the IPP assets of the group, while other entities in the same group pay licence fees and royalties for their use.
Over the past few years, IPP-related transactions have had a marked effect on the services component of the euro area current account balance. In particular, there have been three large spikes in IPP-related imports (Chart 4).
Euro area services trade balance
(EUR billions)
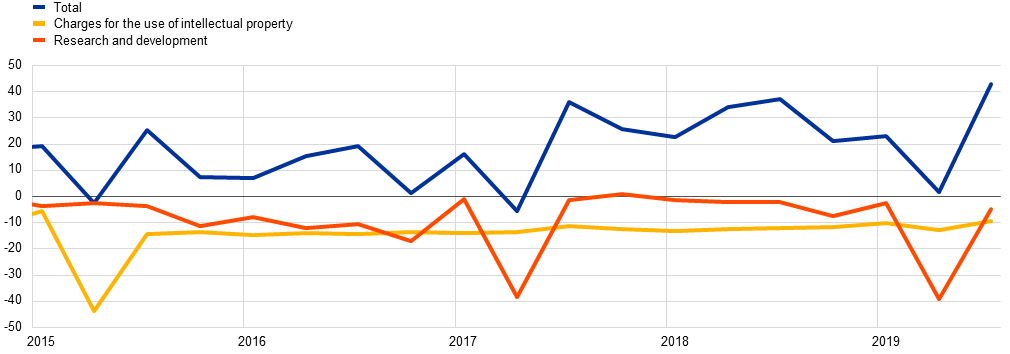
Source: ECB.
Notes: Quarterly data. The latest observation is for the third quarter of 2019.
These episodes – which reflect the transactions of a small number of large companies – are also visible in the euro area national accounts, where they show up as large imports of services and, commensurately, high gross fixed capital formation (Chart 5). Importantly, this increase in investment has also translated into a larger measured level of euro area domestic demand, although the associated change in the underlying euro area domestic production patterns is likely to be quite minor.
Euro area national accounts: selected components
(quarter-on-quarter growth rates in percentages)
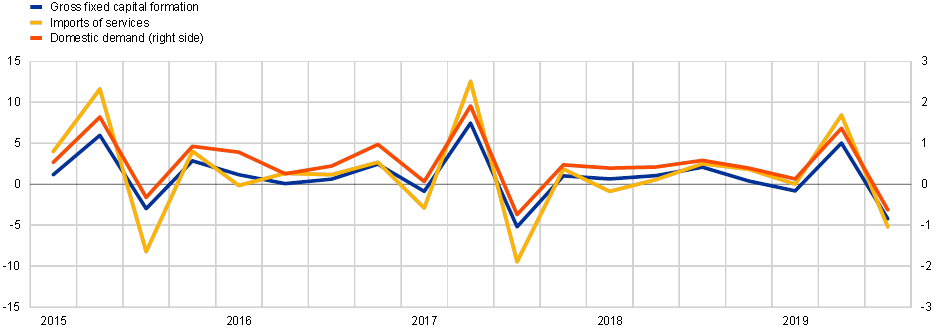
Source: Eurostat.
Notes: Seasonally and working day adjusted quarterly data. The latest observation is for the third quarter of 2019.
Such episodes highlight the dichotomy between the residency principle underlying macroeconomic statistics and the global footprint of MNEs. Data on the numerous entities belonging to MNE groups are not consolidated across borders with the home country of the parent MNE. Instead, they are recorded in the national statistics of the economy where the entities reside, even if their effect on domestic economic activity may in fact be small.
This dichotomy also extends to the way statistics are still collected and compiled nowadays, which is not much different from a century ago: these are gathered nationally and subject to strict data confidentiality rules, which often prevent cross-border data sharing. For global companies, this implies that the information sets available to national statisticians differ across countries, which gives rise to both gaps and overlaps at the same time. This, in turn, has negative implications for cross-country comparability and overall data quality, including for the euro area. It also enables the emergence of large bilateral asymmetries. A case in point is the sizeable differences recorded for the bilateral current account balance between the euro area and the United States based on US and euro area data (Chart 6). This discrepancy gives rise to several interpretations, which I will come back to later on.[7]
Bilateral euro area-US current account
(EUR billions; 2018)
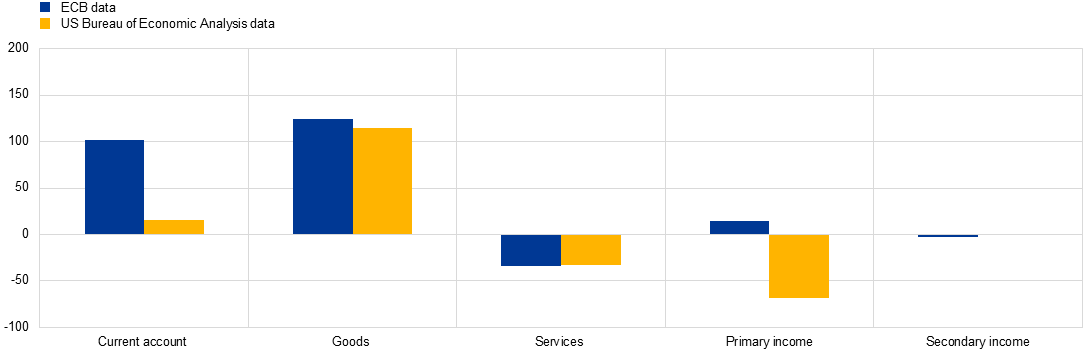
Sources: ECB and US Bureau of Economic Analysis.
Note: Positive balance indicates a surplus for the euro area.
Measuring the financial side of globalisation
Let me turn to the financial side of globalisation. While the post-crisis environment was generally marked by a halt in financial globalisation, foreign direct investment (FDI) positions continued to expand until recently.[8] A striking pattern that I identified in collaboration with Gian Maria Milesi-Ferretti of the International Monetary Fund is that the post-crisis expansion was concentrated in positions vis-à-vis international financial centres (Chart 7). This can, in turn, be linked to the increased complexity of the corporate structures of MNEs, as I just mentioned.
Evolution of external assets
(percentages of world GDP)
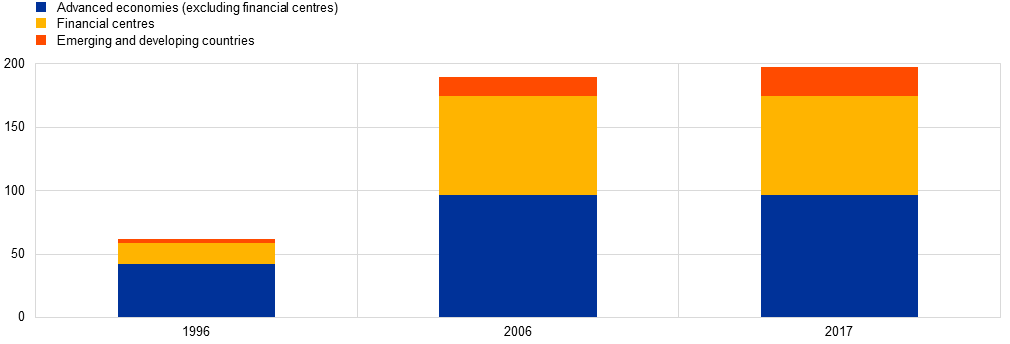
Sources: External Wealth of Nations database (Lane and Milesi-Ferretti) and ECB staff calculations.
Notes: Aggregates for advanced economies, financial centres and emerging and developing countries are defined as in Lane, P. R. and Milesi-Ferretti, G. M. (2018), “The External Wealth of Nations Revisited: International Financial Integration in the Aftermath of the Global Financial Crisis”, IMF Economic Review, Vol. 66, No 1, International Monetary Fund, pp. 189-222.
Due to these trends, interpreting headline FDI data has become increasingly difficult, including for the aggregate euro area. Notably, there is a high presence of SPEs in a number of euro area countries. In these economies, SPEs account for sizeable shares of cross-border financial transactions and positions, not only in terms of FDI but also in terms of portfolio investment and other investment. SPEs located in euro area financial centres typically hold equities, manage debt issuance, and allocate funding across parent and subsidiaries.[9] Statistics on SPEs are, however, not yet sufficiently developed: these are only available for a limited set of countries, largely focus on FDI and do not follow a harmonised international definition.
Large changes to the international balance sheet and financial flows of an economy may also arise from redomiciliations of headquarters. Common patterns associated with moving the headquarters of an MNE to a financial centre economy are increases in net FDI assets of the financial centre, while portfolio equity liabilities increase if the shareholders remain unchanged.
In relation to FDI of the euro area, it is notable that, in recent years, gross FDI transactions of euro area financial centres have been so large that these have driven aggregate euro area developments (Chart 8). Another defining feature of FDI is the strong positive correlation between gross assets and liabilities, especially in financial centres, which hints at the importance of the pass-through of financial flows for the evolution of FDI data.
Euro area foreign direct investment assets and liabilities transactions
(percentages of euro area GDP)

Sources: ECB and Eurostat.
Notes: Financial centres refer to Belgium, Cyprus, Ireland, Luxembourg, Malta, Netherlands. Inverted values for liabilities. Four-quarter moving sums.
The latest observation is for the second quarter of 2019.
Data on bilateral FDI assets of US companies in the euro area offer insights on the changing nature of euro area FDI liabilities.[10] Between 2003 and 2018, US FDI positions in the euro area increased by a factor of 4.5 (Chart 9). A striking pattern is that this increase was largely driven by US investment in holding companies in the euro area, which are often SPEs, while US FDI in other, more traditional sectors such as manufacturing, grew more modestly.
US foreign direct investment assets in the euro area by industry of euro area affiliate
(USD billions)
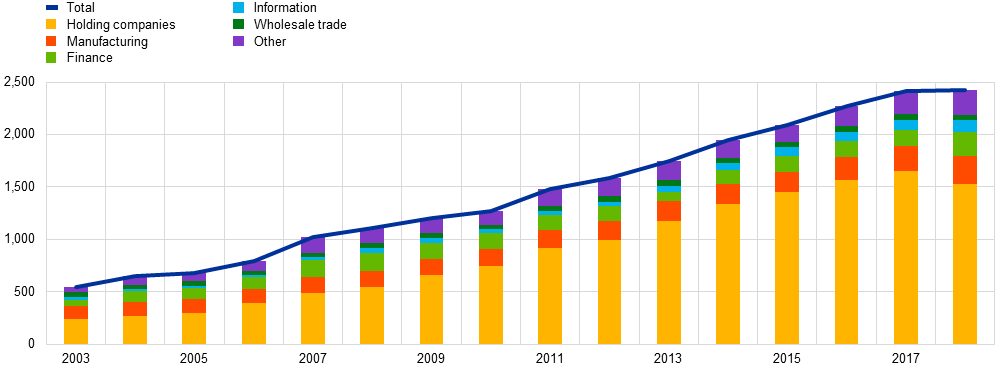
Source: US Bureau of Economic Analysis.
Notes: The euro area is based on data available for Austria, Belgium, Finland, France, Germany, Greece, Ireland, Italy, Luxembourg, Netherlands, Portugal and Spain.
The latest observation is for 2018.
A forthcoming ECB study suggests that the income recorded on US FDI assets in the euro area plays a decisive role in the asymmetries observed in the bilateral euro area-US current account balance (Chart 10) that I mentioned earlier.[11] The likely drivers of asymmetries in FDI income are, first, the difficulty in recording reinvested earnings of US MNEs with complex ownership chains (including holding companies) and, second, the problems in properly allocating the income flows geographically. Differences in the information set on MNEs available to European and US statisticians may be an important factor behind these patterns.
Bilateral euro area-US foreign direct investment income flows
(EUR billions; 2018)

Sources: ECB and US Bureau of Economic Analysis data.
Note: Positive balance indicates a surplus for the euro area.
Going beyond FDI, a careful interpretation of cross-border statistics is also needed for appropriate risk assessments and policy analysis related to international financial exposures.[12] Data on international financial transactions and positions have improved significantly over the past decade, both in terms of coverage and available details as regards instruments, sectors and geographic breakdowns.[13] Such data are helpful for identifying the holders and issuers of financial instruments. This, in turn, matters for the analysis of the transmission of shocks and the stability of investment positions over time.[14]
However, even these additional details cannot fully reveal the matrix of linkages between the ultimate investors and the ultimate issuers of financial instruments. The identification of ultimate exposures has been further complicated in recent years by the rise of international financial intermediation chains, which often involve non-bank entities in international financial centres. Recent research on US investors and mutual funds shows that ultimate exposures – for example with regard to securities issued by emerging market economies – may differ significantly from those observed in international investment positions data.[15] These patterns point to the need to improve the statistical information available for the analysis of interconnectedness. Another way of helping to complete the analysis of exposures would be to integrate the sectoral information of the external balance sheet in domestic sectoral data. This would enable the identification of the domestic sectors that ultimately drive external imbalances.[16]
A further important dimension in measuring international balance sheet risks relates to the transmission of financial shocks through the valuation channel arising from exchange rates and other asset price movements.[17] In the past, data on the valuation channel could only be roughly estimated, resulting in substantial measurement errors. However, such data are now available in the official statistics for many economies, including the euro area, with a considerable degree of detail (Chart 11). For some economies, security-level data that provide highly granular insights into the trading of individual assets are now available. For example, granular datasets such as the ESCB’s Securities Holdings Statistics enable analysts to zoom in on refined dimensions of security holdings and draw up an ad hoc analysis of specific exposures.[18] Studies exploiting these data show that different investor types respond differently to asset price fluctuations.[19]
Valuation changes in euro area portfolio investment assets
(EUR billions)
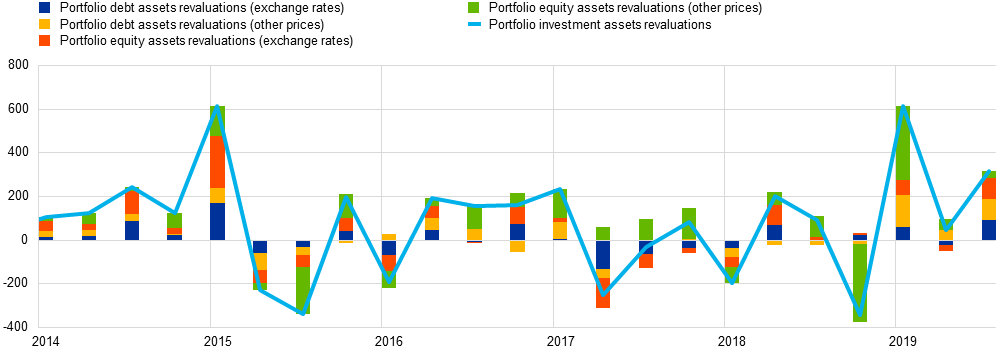
Source: ECB.
Notes: Quarterly data. The latest observation is for the third quarter of 2019.
Official statistics that provide a comprehensive picture of foreign currency exposures in international balance sheets are still relatively sparse. Such data are important, however, since the full analysis of the transmission of exchange rate movements needs to take into account net foreign currency exposures. The lack of official statistics on the currency dimension of the international balance sheet has prompted the assembly of research-based datasets. Plausible estimates can be constructed by carefully merging a range of datasets, together with some estimates of the currency positions in different financial instruments (Chart 12).[20]
Cumulative distribution of net foreign currency exposures
(y-axis: cumulative distribution; x-axis: units of net foreign currency exposure measure)
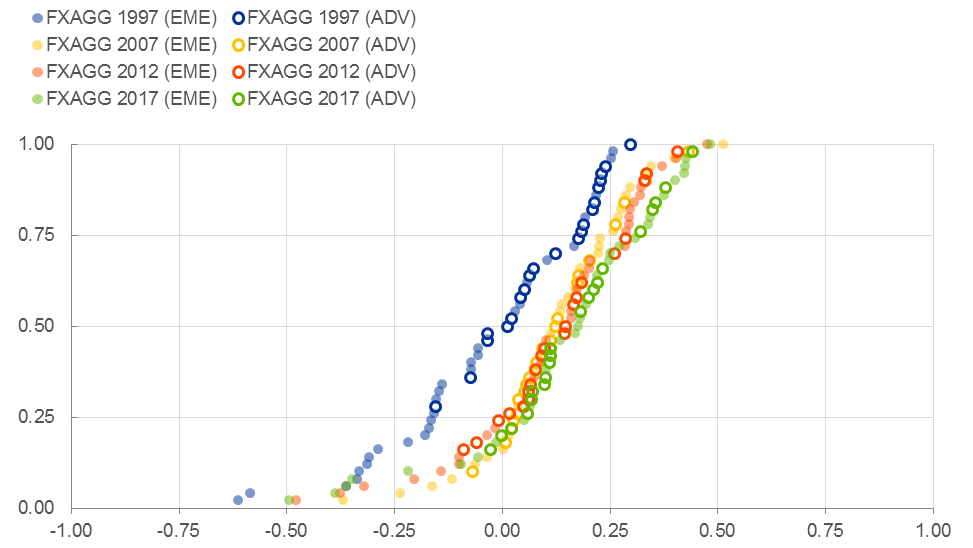
Sources: Bénétrix, A., Gautam, D., Juvenal, L. and Schmitz, M. (2019), “Cross-Border Currency Exposures. New evidence based on an enhanced and updated dataset”, IMF Working Papers, No 19/299, International Monetary Fund.
Notes: Net foreign currency exposures shown on the horizontal axis range between -1 and 1. The vertical axis presents the cumulative distribution (the proportion of countries) below each value on the horizontal axis for 1997, 2007, 2012 and 2017. The sample includes 50 advanced (ADV) and emerging (EME) countries.
International initiatives to address measurement challenges
The measurement challenges that I have discussed are well recognised in the international statistical community. A number of data initiatives – both at European and global level – point to progress in addressing these problems, as for instance recognised in the G20 Data Gaps Initiative. I am sure that, over these two days, you will have the opportunity to become familiar with many of these initiatives.
I would like to turn to what I consider to be required in order to enhance the relevance of cross-border and national accounts statistics. In general, the statistical system needs to become more agile to keep pace with the rapidly evolving activities of multinational firms and financial intermediaries.
To this end, the international statistical infrastructure needs to be enhanced. A key pillar in this infrastructure is the Legal Entity Identifier (LEI), which will bring transparency and facilitate the distinct identification of legal entities and link them to the ultimate parent entity. The ECB is actively engaged in this project, since it not only supports the statistical process, but also brings transparency to financial markets and to the exercise of prudential supervision.
Moreover, a concentric system of administrative and business registers can be a promising avenue for reconciling statistical and non-statistical needs. As the core of this system of registers, one could develop a single (near) real time EU business register, containing non-confidential information. This register could be made available as a public good for all administrative purposes. Establishing such a core register would require intensive cooperation among the operators of administrative, statistical and commercial business registers and should draw on the initiatives to enforce the universal use of the LEI. Ideally, it should support all non-statistical needs, including those of the EU Commission and those arising from the ECB’s functions (including banking supervision). In concentric circles around the core business register, one could first add the necessary statistical variables, which would be the reference for European System of Central Banks (ESCB) and European Statistical System (ESS) statistical production. Further separate concentric circles could add variables for other administrative purposes such as tax administration.
I acknowledge the sizeable initial investment implied by such a system. This requires thinking big and establishing EU law to bring it to life. Without these changes, however, I see little chance of keeping European statistics fit for purpose in the digital age.[21]
I also think that the existing data confidentiality framework in the EU needs to be urgently reviewed. The sharing of confidential data for statistical purpose within the ESCB/ESS should be facilitated by creating a solid legal basis. While the exchange of confidential information for statistical purposes is already enabled under EU statistical law, the experience of the last decade shows that this is not enough in a number of Member States.[22] Some legal initiatives will be required, possibly to replace some enabling clauses with mandatory ones. For instance, a single statistical business register would never be possible without such an enhanced data confidentiality framework.
These infrastructure developments would create a world of opportunities. For example, given the importance of MNEs and the associated measurement challenges, the centralised collection of data on, for instance, the top 500 MNEs in the EU could be envisaged, as is already the case in the financial sector for the 120 significant and 4,000 less significant banks within the framework of banking supervision. Such data, which could be made accessible to the relevant statistical authorities in the EU, have the potential to eliminate information gaps and overlaps across countries and hence ensure a more complete and consistent cross-country recording of the activities of MNEs. Moreover, this offers the prospect of significantly improving timeliness. At the same time, I am convinced that such an approach would be a win-win situation for MNEs in terms of the statistical reporting burden. Instead of receiving questionnaires from 27 Member States in 20-plus languages, a coordinated approach across the EU could significantly reduce reporting burdens. In individual Member States, like my own, the centralised approach to the biggest MNEs is bundled in large case units, which are often responsible for all reporting obligations and serve as a one-stop contact point for MNEs. Such an idea could also be considered at the euro area or EU level to the benefit of reporters and statistical authorities.
Turning to data wishes, as outlined earlier, further sectoral detail is necessary for an adequate analysis of risk exposures and to account for the activities of purely internationally oriented entities. There are important ongoing initiatives in this direction, both at a global level and within the ESCB. With regard to the need for a harmonised recording of SPEs in cross-border statistics, the definition provided by the dedicated task force of the IMF Committee on Balance of Payments Statistics is welcome and will be helpful in ensuring the availability of internationally consistent statistics with a separate breakdown for SPEs.[23] The ESCB’s work programmes on external statistics and financial accounts also seek to separately identify foreign-controlled corporations in financial accounts and provide more refined breakdowns of the non-bank financial sector. Moreover, the euro area datasets on b.o.p. and domestic sector accounts will achieve full consistency over the next year, with important benefits for the analysis of interconnectedness.
Taking a longer time horizon, the next review and update of the statistical manuals (in particular the Balance of Payments Manual and the System of National Accounts) offers an opportunity to rethink the key concepts of macroeconomic statistics. One avenue is the consolidated framework in which all entities belonging to a corporate group are assigned to the country of the headquarters. Such an approach has the potential to provide a useful alternative perspective, in particular on MNEs and in the identification of ultimate financial exposures. However, such a consolidated accounting framework should be considered as complementary rather than as a substitute for the residence-based framework. As both approaches have their merits, their usefulness depends on the specific purpose of the analysis.
Conclusions
In this speech I have focused on the topic of measurement challenges for external statistics. In particular, I have highlighted the role that measurement issues play in determining the analytical value of the statistics on euro area trade and the national accounts. On the financial side, key issues relate to the changing nature of FDI and to the proper measurement of exposures and risks.
I have also discussed some of the ongoing initiatives to address these measurement challenges, both at a global and European level. I would like to highlight once more that further efforts are needed to improve the analytical value of external statistics. This relates, for instance, to facilitating the sharing of confidential data for statistical purposes across borders and to exploring avenues to collect data on internationally active, large institutions in a centralised way, at the EU rather than national level.
As a long-standing user of external statistics, I very much look forward to the discussion today and will closely follow future enhancements to the data on cross-border statistics.
- [1]I am grateful to Martin Schmitz for his contribution to this speech.
- [2]See Avdjiev, S., Everett, M., Lane, P. R. and Shin, H. S. (2018), “Tracking the international footprints of global firms”, BIS Quarterly Review, Bank for International Settlements, March.
- [3]In contract manufacturing, a firm hires a foreign company to produce a good but retains the ownership of the inputs. In merchanting, a company purchases a good from an entity that is resident abroad and subsequently sells it to a foreign buyer, without the good crossing the border of the country where the merchant is based.
- [4]See Di Nino, V., Habib, M. M. and Schmitz, M. (2020), “Multinational enterprises, financial centres and their implications for external imbalances: a euro area perspective”, forthcoming in Economic Bulletin, Issue 2, ECB.
- [5]Following Lane, P. R. and Milesi-Ferretti, G. M. (2018), “The External Wealth of Nations Revisited: International Financial Integration in the Aftermath of the Global Financial Crisis”, IMF Economic Review, Vol. 66, No 1, International Monetary Fund, pp. 189-222, financial centre economies are selected on the basis of their ratios of external assets and liabilities to GDP. Among the euro area Member States, this group includes Belgium, Cyprus, Ireland, Luxembourg, Malta and Netherlands.
- [6]Di Nino, V. (2020), “Decomposing the euro area trade balance: where does the value added of conduit economies go?”, mimeo, European Central Bank.
- [7]Indeed, a factor contributing to asymmetries between the euro area and the United States may be related to methodological differences, in particular as the US current account statistics are not fully aligned with the standard presentation of the sixth edition of the International Monetary Fund’s “Balance of payments and international investment position manual” (BPM6). See Eurostat (2019), Current account asymmetries in EU-US statistics.
- [8]See Lane, P. R. and Milesi-Ferretti, G. M. (2018), “The External Wealth of Nations Revisited: International Financial Integration in the Aftermath of the Global Financial Crisis,” IMF Economic Review, Vol. 66, No 1, International Monetary Fund, pp. 189-222; and McQuade, P. and Schmitz, M. (2017), “The Great Moderation in International Capital Flows: A Global Phenomenon?”, Journal of International Money and Finance, Vol. 73, pp. 188-212.
- [9]See Galstyan, V., Maqui, E. and McQuade, P. (2019), “International debt and Special Purpose Entities: evidence from Ireland”, Working Paper Series, No 2301, ECB, Frankfurt am Main, July.
- [10]The United States accounts for around 25 percent of extra-euro area FDI liabilities.
- [11]See Pastoris, F. and Schmitz, M. (2020), “Euro area-US current account asymmetries: the role of foreign direct investment income in the presence of multinational enterprises”, forthcoming in Economic Bulletin, Issue 2, ECB.
- [12]See Lane, P. R. (2015), “Risk Exposures in International and Sectoral Balance Sheet Data", World Economics, Vol. 16, No 4, pp. 55-76.
- [13]Cross-country datasets providing a geographic breakdown of investment positions include the BIS data on cross-border banking, the IMF’s Coordinated Portfolio Investment Survey (CPIS) data on cross-border portfolio assets and the IMF’s Coordinated Direct Investment Survey (CDIS) on FDI.
- [14]See Galstyan, V., Lane, P. R., Mehigan, C. and Mercado, R. (2016), “The Holders and Issuers of International Portfolio Securities,” Journal of the Japanese and International Economies, Vol. 42, pp. 100-108.
- [15]See Bertaut, C. C., Bressler, B. and Curcuru, S. (2019), “Globalization and the Geography of Capital Flows,” FEDS Notes, Washington: Board of Governors of the Federal Reserve System; and Coppola, A., Maggiori, M., Neiman, B. and Schreger, J. (2020), “Redrawing the Map of Global Capital Flows: The Role of Cross-Border Financing and Tax Havens”, mimeo, Stanford University.
- [16]See Allen, C. (2019), “Revisiting External Imbalances: Insights from Sectoral Accounts”, Journal of International Money and Finance, Vol. 96, pp. 67-101.
- [17]See Lane, P. R. and Milesi-Ferretti, G. M. (2007), “A Global Perspective on External Positions”, in Clarida, R. H. (ed.), G7 Current Account Imbalances: Sustainability and Adjustment, National Bureau of Economic Research, pp. 67-102.
- [18]See Bergant, K., Fidora, M. and Schmitz, M. (2018), “International capital flows at the security level – evidence from the ECB’s asset purchase programme”, ECMI Working Papers, No 7, Centre for European Policy Studies.
- [19]Timmer, Y. (2018), “Cyclical Investment Behaviour Across Financial Institutions,” Journal of Financial Economics, Vol. 129, No 2, pp. 268-286; and Bergant, K. and Schmitz, M. (2019), “Valuation Effects and Capital Flows – Security Level Evidence from Euro Area Investors,” mimeo, International Monetary Fund and European Central Bank.
- [20]See Lane, P. R. and Shambaugh, J. C. (2010), “Financial Exchange Rates and International Currency Exposures,” American Economic Review, Vol. 100, No 1, pp. 518-540; and Bénétrix, A., Gautam, D., Juvenal, L. and Schmitz, M. (2019), “Cross-Border Currency Exposures. New evidence based on an enhanced and updated dataset”, IMF Working Papers, No 19/299, International Monetary Fund.
- [21]Ongoing initiatives include the Register of Institutions and Affiliates Database (RIAD) – which is a business register, operated by the ESCB – and the EuroGroups Register (EGR), which is used for statistical purposes on MNEs in the EU and operated by the ESS.
- [22]For more details please consult Council Regulation 2533/98 (as amended) and Regulation (EC) No 223/2009.
- [23]See the IMF Committee on Balance of Payments Statistics’ Final Report of the Task Force on Special Purpose Entities, 2018.
European Central Bank
Directorate General Communications
- Sonnemannstrasse 20
- 60314 Frankfurt am Main, Germany
- +49 69 1344 7455
- media@ecb.europa.eu
Reproduction is permitted provided that the source is acknowledged.
Media contacts