


Published as part of the ECB Economic Bulletin, Issue 2/2024.
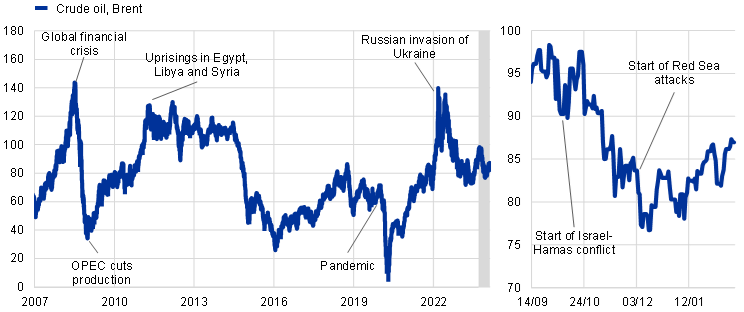
Large movements in oil and gas prices, coupled with higher price volatility amid the pandemic, the war in Ukraine and rising geopolitical tensions in the Middle East, have raised the question of to what extent speculation is driving oil and gas prices. Oil and gas prices have increased significantly since the pandemic came to an end, with large-scale price volatility seen during the post-pandemic recovery. More recently, renewed concerns of heightened price volatility have been triggered by the terrorist attacks in Israel and the rising tensions in the Red Sea, albeit to a lesser extent than in the post-pandemic recovery period, putting some upward pressure on Brent oil prices (Chart A, panel a).[1] Yet, at the current juncture, upside pressure on oil prices from geopolitical tensions and OPEC+ cuts is being offset by weak demand and higher non-OPEC production. Although gas prices have also reacted to recent geopolitical tensions, they have remained well below 2022 levels. Against this background, attention has again turned to trying to understand the drivers of oil and gas prices. Of particular interest is the question of whether prices mainly reflect fundamental factors (i.e. global supply and demand for oil and gas) or more non-fundamental factors related to speculative positioning. The topic has been heavily debated for more than two decades, with some observers pointing to speculation and the financialisation of commodity markets as the main drivers behind spikes in oil prices. Academic studies, however, do not generally find strong evidence of financial speculation playing an important role.[2]
Chart A
Oil and gas price developments and key events
a) Oil prices
(USD/barrel)
b) Gas prices
(EUR/MWh)
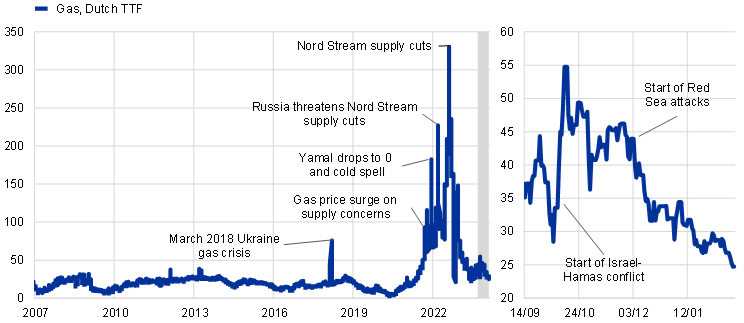
Sources: LSEG and ECB staff calculations.
Notes: The Dutch TTF is the European benchmark price for natural gas. The shaded area corresponds to the zoom window. The latest observations are for 15 February 2024.
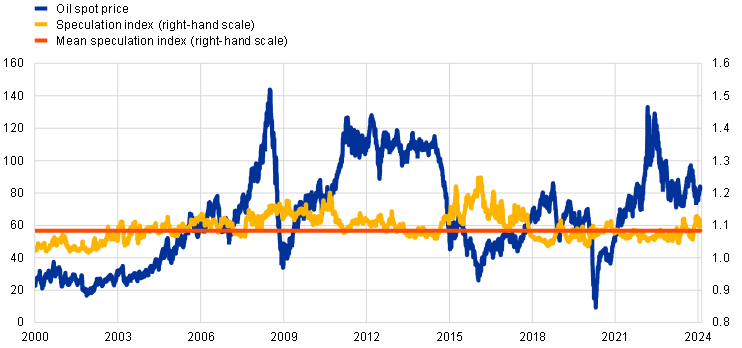
Market metrics generally point to speculation playing a limited role above and beyond hedging needs. The importance of speculation can be measured by constructing speculation indices for both oil and gas markets using the “Working T index”. Using data on positions in the US futures market from the Commodity Futures Trading Commission’s (CFTC) Commitments of Traders (COT) report, the index measures speculation as the amount of futures contracts held by non-commercial traders (as a proxy for speculators) in excess of what it is required to balance hedging positions held by commercial traders (which are measured by the reporting institution).[3] Values above one indicate that traders hold more contracts than needed to hedge market risk. Speculation could amplify price movements (both raising or lowering prices) depending on the position taken by investors; the average impact of speculative activities in the sample is assessed in the second part of this box. Looking back in time, the index for oil was stable until around the end of 2002, with an average close to 1. The index then increased steadily until around 2010 – and once more in 2015 – to reach a peak of almost 1.3, but has subsided since then (Chart B, panel a).[4] Overall, the correlation between the speculation index and the oil price appears to be limited.
Gas market speculation indices have remained broadly stable in both the United States and Europe over recent years. Given that gas markets are less globally integrated than oil markets, a further distinction is made between the US market and the European market. This is based on CFTC data for the United States and information from the European Securities and Markets Authority (ESMA) for dynamics in Europe. The analysis suggests that speculation in excess of hedging is historically higher in Europe than in the United States (Chart B, panel b).[5] From a European perspective, the gas speculation index increased following the Russian invasion of Ukraine, even though it remained relatively stable when gas prices spiked again in the summer of 2022. The correlation between the speculation index and the gas price appears to be limited overall, with the series decoupling over the last few months.
Chart B
Speculation indices in oil and gas markets
a) Oil spot price and CFTC-based oil speculation index
(left-hand scale: USD/barrel; right-hand scale: percentage)
b) Gas spot price and gas speculation indices
(left-hand scale: EUR/MWh; right-hand scale: percentage)
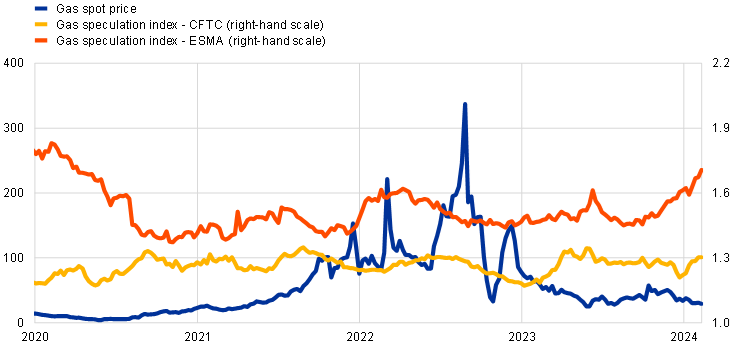
Sources: CFTC, ESMA, LSEG and ECB calculations.
Notes: Panel a): The index lower bound is unity. Larger values indicate a larger number of open non-commercial (i.e. speculative) positions than commercial (i.e. hedging) positions. To the extent that the positions taken by non-commercial firms do not offset those taken by commercial firms, the size of this imbalance is indicative of speculative positions in excess of the requirements of hedgers. The mean speculation index is calculated starting from 1995. Panel b): The CFTC-based gas speculation index is based on US data, while the ESMA-based gas speculation index captures speculation in the European gas market.
The latest observations are for 15 February 2024 for panel a) (daily data) and 9 February 2024 for panel b) (weekly data).
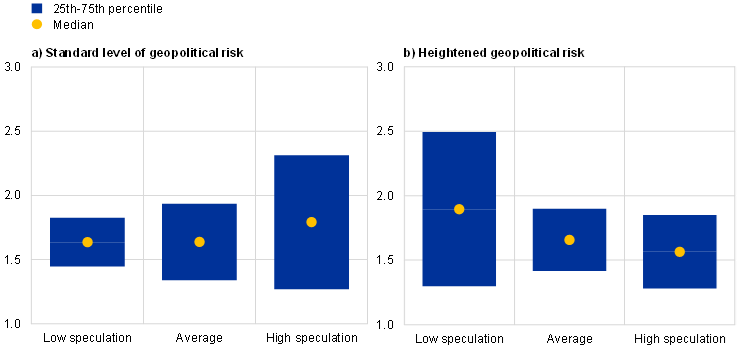
An empirical investigation of the link between oil prices and speculation shows that there is only limited evidence that speculation affects the transmission of fundamental demand or supply shocks to oil prices. The empirical investigation of the role of speculation on energy prices focuses on the oil market, because gas prices are more heavily influenced by regional factors.[6] The basic idea is to use a structural model to identify surprises in oil price movements (i.e. shocks to the oil price) that are not expected by market participants. This can help in assessing whether speculative positioning by investors significantly influences the dynamics of oil prices when shocks occur. For example, faced with a fundamental shock that causes an unexpected increase in oil prices, investors excessively exposed to oil prices might re-adjust their portfolio, amplifying the effect of the shock. At the same time, investors holding positions that would lead to gains in the event of an unexpected increase in the oil price may close their positions to capitalise those gains, thus dampening the effect of the fundamental shock. This hypothesis can be tested by regressing oil price changes on fundamental shocks, conditioning on the level of investor positioning in oil markets (Chart C, panel a).[7] Empirical estimates show limited differences in the reaction of the oil price when the level of speculation is higher.[8] For crude oil spot prices, the elasticity to a standardised oil supply shock increases from 1.6 when the level of speculative contracts is low, to about 1.8 when investor net long positions are large. These estimates are not statistically different from each other, as confidence intervals overlap greatly. Differences are even smaller when considering oil futures as, in this case, risk-averse investors holding long positions will make a profit as they have correctly anticipated higher oil prices. Unwinding such positions will dampen the effect of the fundamental shock on oil prices. Overall, speculation is found not to play a major role in amplifying the transmission of fundamental shocks to oil spot and futures prices, in line with the academic findings mentioned above.
Chart C
Reaction of oil prices to oil supply shocks, conditional on the level of speculative positioning
Estimated response of oil spot prices
(percentages)
Sources: LSEG, Caldara and Iacoviello1), Gazzani et al.2) and ECB staff calculations.
Notes: Panel a): The chart uses structural oil shocks identified by Gazzani et al., normalised to increase oil prices on impact. More precisely, a negative supply shock increases oil prices by around 1.2% on impact and 1.8% after one week. The chart plots the percentage change in the oil price for the same shock when net open positions are at the average level in the sample (average), one standard deviation below the average (low speculation) or one standard deviation above the average (high speculation). The sample period is 2008-22; data are weekly. Panel b): The chart repeats the same analysis using only periods of high geopolitical uncertainty, measured as periods when the daily geopolitical risk index calculated by Caldara and Iacoviello is above its long-run average. The sample period is 2008-22; data are weekly.
1) Caldara, D. and Iacoviello, M., “Measuring Geopolitical Risk”, American Economic Review, Vol. 112, No 4, 2022, pp. 1194-1225.
2) Gazzani, A., Venditti, F. and Veronese, G., “Oil price shocks in real-time”, Journal of Monetary Economics, forthcoming.
Speculation is also found not to amplify the transmission of fundamental shocks in periods of heightened geopolitical risk. Geopolitical tensions may influence oil prices through two different, opposing channels. First, greater geopolitical uncertainty acts as a negative global demand shock by raising doubts about the economic outlook with knock-on effects on consumption, investment and international trade. Via this channel, geopolitical uncertainty ultimately dampens global oil demand and oil prices. Second, geopolitical tensions may pose risks to future oil supply, increasing the cash value of holding oil contracts – also known as the convenience yield – thereby putting upward pressure on prices. These two channels push oil prices in opposite directions, and which one prevails is an empirical question.[9] To test whether speculation may become more important as an amplifier of oil price movements in the face of geopolitical tensions, the analysis above is repeated, but focusing on periods of heightened geopolitical tensions (identified as periods when the geopolitical risk index created by Caldara and Iacoviello is above the historical average). The outcome indicates that the elasticity to oil supply shocks remains broadly stable, as confidence intervals between periods of low and high speculation overlap completely (Chart C, panel b). These results suggest that speculation – as measured by the level of net investor positioning in oil markets – also has limited effect in amplifying price reactions to fundamental shocks in periods of heightened geopolitical tensions.
For an estimate of the oil price reaction to geopolitical shocks, see the box entitled “Geopolitical risk and oil prices”, Economic Bulletin, Issue 8, ECB, 2023.
See, for example, Kilian, L., “Not All Oil Price Shocks Are Alike: Disentangling Demand and Supply Shocks in the Crude Oil Market”, American Economic Review, Vol. 99, No 3, 2009, pp. 1053-1069, and Vansteenkiste, I., “What is driving oil futures prices? Fundamentals versus speculation”, Working Paper Series, No 1371, ECB, 2011.
Reporting institutions define positions as speculative or hedging based on the underlying contract and the counterparty involved. It is important to note that there are several limitations on the data, such as that the CFTC classifies positions by entity (commercial versus non-commercial) and not by trading activity (speculation versus hedging). See also Vansteenkiste, I., op. cit., for similar use of CFTC data and applications of the Working T index.
It should be noted that while the speculation index increased in 2015, oil prices dropped because of a supply glut driven by a period of weak demand and a boom in supply as a consequence of high US shale production and OPEC lifting export quotas; see Baumeister, C. and Kilian, L., “Forty Years of Oil Price Fluctuations: Why the Price of Oil May Still Surprise Us”, Journal of Economic Perspectives, Vol. 30, No 1, 2016, pp. 139-160.
The ESMA time coverage is much shorter, however, as the data are reported only after 2018.
The empirical framework used here is in a similar spirit to that set out in Altmeyer, P., Boneva, L., Kinston, R., Saha, S. and Stoja, E., “Yield curve sensitivity to investor positioning around economic shocks”, Staff Working Papers, No 1029, Bank of England, 2023.
Specifically, oil prices are regressed on daily oil supply shocks interacted with the oil speculation index or the level of non-commercial positions. The daily oil shocks are taken from Gazzani, A., Venditti, F. and Veronese, G., “Oil price shocks in real-time”, Journal of Monetary Economics, forthcoming.
Results remain robust to using the Working T index in the interaction with the negative supply shock.
See Caldara, D. and Iacoviello, M., “Measuring Geopolitical Risk”, American Economic Review, Vol. 112, No 4, 2022, pp. 1194-1225.