
TARGET2-Securities Annual Report 2022
Introduction
Financial market infrastructures (FMIs) are the backbone of the financial system. They provide the networks through which financial institutions and financial markets connect with each other and through which financial transactions are cleared and settled. It is therefore essential to ensure that market infrastructures are safe and efficient and that they underpin a stable and well-functioning economy. The Eurosystem plays a key role, given that the conduct of monetary policy relies on the availability of reliable and effective FMIs such as TARGET2 (the real-time gross settlement system), TARGET2-Securities (the securities settlement platform) and TIPS (TARGET instant payment settlement).
TARGET2-Securities (T2S), in particular, was conceived as an initiative aimed at addressing the highly fragmented European securities settlement landscape. It was launched in June 2015 as an integrated platform used to process securities transactions against central bank money. T2S revolutionised securities settlement in Europe by offering a solution which simplified cross-border settlement procedures and eased the difficulties caused by different countries following different settlement practices.
T2S provides harmonised and commoditised securities settlement to central securities depositories (CSDs) and applies a single set of rules, standards and tariffs to all participant CSDs. This allows the securities settlement platform to lay the foundations for a single market for securities settlement and, as a result, contributes to greater integration in Europe’s financial market. Today, the T2S platform connects 19 CSDs across 20 markets and processes, on average, over 700,000 securities transactions per day against both the euro and the Danish kroner.
The report and its structure
This is the 12th edition of the TARGET2-Securities Annual Report, which now covers a fifth full year since the end of the T2S migration period. The first edition was published in 2011, a pivotal year for the finalisation of the legal and technical documentation of T2S and for the CSDs’ preparation of their T2S adaptation plans. This year the report presents the changes in T2S settlement data and confirms the continuing operational stability and efficiency of T2S. It describes the developments which took place in T2S in 2022 as well as some of the main incidents that had an impact on the platform throughout the year. The report’s target audience is mainly decision-makers, practitioners, lawyers and academics wishing to acquire an in-depth understanding of T2S and how it works. In addition, it will be of interest to members of the public who have an interest in market infrastructure and, in particular, T2S.
In addition to the core content, two boxes are included in this year’s publication. These boxes provide in-depth information on initiatives aimed at improving settlement efficiency and on the implementation of the penalty mechanism.
1 Evolution of T2S settlement data in 2022
Table 1 provides an overview of changes in T2S traffic between 2021 and 2022. In 2022 T2S settled 181,924,855 transactions, with a total value of €184.19 trillion. This corresponded to a daily average volume of 707,879 transactions, with a daily average value of €716.67 billion. To put this into perspective, the equivalent of annual euro area GDP is settled roughly every 18 average operating days.
Compared with the previous year, there was an increase of 3.30% in the value settled and a decrease of 2.91% in the volume settled. Settlement efficiency in 2022 was 93.29% in terms of value and 93.74% in terms of volume. This represented small decreases of 0.83% in terms of value and 0.63% in terms of volume compared with 2021.
Table 1
Variations in T2S settlement data and settlement efficiency
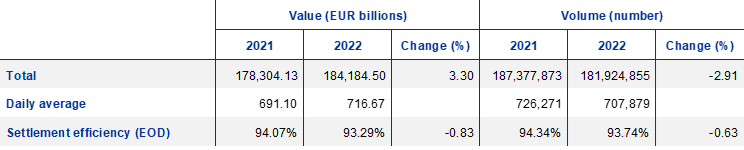
Source: T2S.
Notes: There were 258 operating days in 2021 and 257 operating days in 2022. EOD: end of day.
1.1 Volume of settlements in T2S
Chart 1 shows the changes in the volumes settled in T2S and settlement efficiency at end of day since the completion of the first migration wave in 2015. As a result of the migration waves, monthly total T2S settlement volumes increased from 1,815,790 transactions in September 2015 to 11,804,649 transactions in October 2017. Between November 2018 and December 2019, total T2S settlement volumes averaged 12,819,952 transactions per month. In March 2020, following the outbreak of the coronavirus (COVID-19) pandemic, total monthly traffic peaked at 20,232,528 transactions. On average, T2S settled 15,160,405 transactions per month in 2022. Average monthly volumes were 2.91% lower in 2022 than in 2021. Monthly volumes peaked at over 20 million transactions in March 2022 on the back of market tensions following the Russian invasion of Ukraine, although this was lower than the peak reached in March 2020.
As T2S traffic stabilised in its first few years of operation, settlement efficiency in volume terms became less volatile, averaging 96.85% between November 2018 and December 2019. Following the introduction of the new T2S statistical framework and, as a consequence, the move from the platform-based to the market-based methodology,[1], settlement efficiency decreased to 94.81% in volume terms in January 2020.[2] The particularly high volumes settled in March 2020 affected settlement efficiency, which declined to 92.81%. Between April 2020 and the end of 2022, settlement efficiency averaged 94.19% in volume terms.
Chart 1
Variation in volumes settled in T2S and settlement efficiency at end of day
(left-hand scale: number of transactions, monthly totals; right-hand scale: settlement efficiency, percentages)
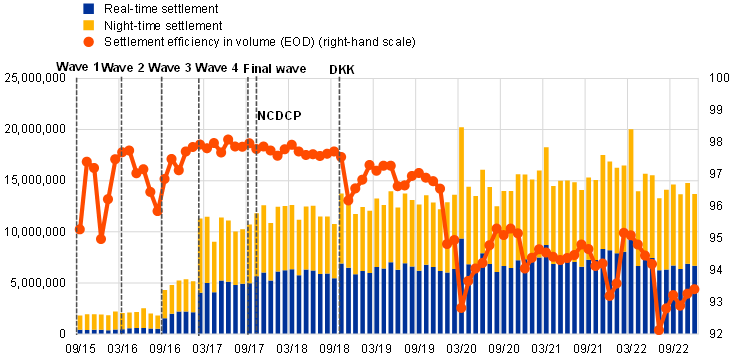
Source: T2S.
Notes: Migration wave 1: 22 June-31 August 2015; migration wave 2: 29 March 2016; migration wave 3: 12 September 2016; migration wave 4: 6 February 2017; final migration wave: 18 September 2017; NCDCP (Slovakian CSD): 27 October 2017; Danish kroner: 29 October 2018.
In 2022 T2S settled, on average, 707,879 transactions per day. Chart 2 shows the change in daily average T2S traffic in volume terms. The daily average volume per month ranged from 612,841 transactions (in August) to 870,727 transactions (in March). The highest daily volume settled was on 26 January (1,190,200) while the lowest was on 4 January (250,342). The maximum was mainly due to specific market behaviour. The minimum was reached in a period in which traffic was lower because of seasonality, the closure of stock markets on 31 December being a key driver of the volumes settled two business days later. Overall, the number of transactions settled in T2S on a daily average basis in 2022 was lower than it had been in 2021 (726,271).
Chart 2
Volumes of T2S transactions settled in 2022
(number of transactions, thousands)

Source: T2S.
1.1.1 Real-time settlement and night-time settlement
In T2S the new business day starts at 18:45 CET with preparation for night-time settlement (NTS). NTS processing starts at 20:00 CET and is generally completed before 22:00 CET. NTS consists of two cycles, the first of which is subdivided into five sequences and the second into four sequences. Within each different sequence, a pre-defined set of transaction or instruction types is settled. At the end of the second cycle T2S submits, for partial settlement, all eligible transactions for which settlement has failed during an earlier attempt made the same evening.
After the end of NTS there is a short period of preparation for real-time settlement (RTS), followed by the actual RTS phase. RTS is concluded at 18:00 CET, although it may be interrupted by the optional maintenance window which, when activated, starts at 03:00 CET and ends at 05:00 CET. The mandatory weekly maintenance window is activated every weekend from Saturday 02:30 CET to Monday 02:30 CET. During the maintenance window T2S is closed for all settlement activities.
RTS includes five partial settlement windows at 08:00 CET, 10:00 CET, 12:00 CET, 14:00 CET and 15:30 CET. In each partial settlement window, T2S partially settles those new settlement instructions arriving in T2S that are eligible for partial settlement, as well as previously unprocessed or partially processed settlement instructions that are eligible for partial settlement. The first and the last partial settlement windows have a duration of 30 minutes each, while the others have a duration of 15 minutes each. The RTS closure period starts with the delivery-versus-payment (DVP) cut-off, which is harmonised at 16:00 CET for all currencies.
In 2022, an average of 15,160,405 transactions were settled each month, compared with 15,614,823 in 2021 (see Chart 3). Total monthly traffic ranged between a minimum of 13,277,110 transactions in July and a maximum of 20,026,502 transactions in March. By way of comparison, in 2021 total monthly traffic reached a minimum (14,077,269) in August and a maximum (18,249,070) in March.
Chart 3
NTS and RTS volumes in 2022
(number of transactions (millions), monthly totals)

Source: T2S.
Chart 3 shows the breakdown of total monthly volumes by NTS and RTS. As the chart shows, there was little variation in the share of the total volumes settled in NTS and RTS each month in 2022. NTS accounted for 52.52% of overall volume (an average of 7,962,132 transactions) while RTS accounted for 47.48% (an average of 7,198,273 transactions), which is in line with the figures for 2021 (52.63% and 47.37% respectively). In absolute terms, the monthly volumes settled in both NTS and RTS peaked in March at 10,264,337 transactions and 9,762,165 transactions respectively. However, in percentage terms the peak volume settled in NTS was seen in August (55.39%) while the peak volume settled in RTS was seen in February (48.87%). In volume terms DVP transactions, which account for the majority of T2S traffic, were largely settled during the NTS cycles (62.30%).
1.1.2 Settlement volume by transaction type
Five transaction categories make up T2S volumes: DVP, free-of-payment (FOP), payment-free-of-delivery (PFOD), settlement restrictions on securities (SRSE) and delivery-with-payment (DWP).[3] Chart 4 displays total T2S traffic broken down by transaction type.
Chart 4
Settlement volume by transaction type in 2022
(percentages, yearly totals)

Source: T2S.
Note: The category “Other” includes PFOD, SRSE and DWP.
In 2022 DVP and FOP transactions were the largest contributors to T2S traffic, together representing around 96.13% of total settled volume, compared with 96.56% in 2021. DVP transactions (71.68%, corresponding to a daily average of 507,419 transactions) accounted for most of the total T2S volumes. FOP transactions represented 24.45% of the total T2S volumes (corresponding to a daily average of 173,068 transactions). PFOD transactions, SRSE transactions and DWP transactions together accounted for 3.87% of the total volumes (corresponding to a daily average of 27,393 transactions). The percentage contribution of each transaction type relative to the overall volume is consistent with the pattern observed in previous years.
1.1.3 Settlement volume by transaction categories
The three largest securities categories contributing to T2S traffic in terms of volume are equities, entitlements (rights) and debt instruments. Chart 5 shows the daily average volume settled for each of these three categories. In line with previous years, in 2022 equities represented the largest share of overall T2S traffic, with a daily average volume of 344,606 transactions (48.68%), followed by entitlements (rights) with 199,735 transactions (28.22%) and debt instruments with 75,658 transactions (10.69%). The remaining share (12.41%) was attributable to other types of security. In 2021 the weight of equities was higher (52.63%) whereas the weight of entitlements (rights) and debt instruments was slightly lower (26.88% and 8.87% respectively).
Chart 5
Volume by securities category in 2022
(number of transactions, daily averages)
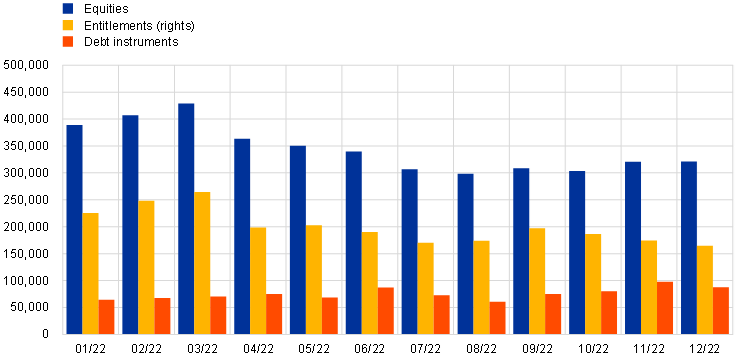
Source: T2S.
The daily average volume of equity transactions in 2022 ranged between a low of 298,704 (in August) and a high of 428,983 transactions (in March). The daily average volume of entitlements (rights) ranged between 164,628 transactions (in December) and 264,988 (in March). The daily average volume of debt instruments ranged between 60,873 transactions (in August) and 97,777 (in November). Throughout the year, equities consistently accounted for the largest volume, followed by entitlements and then debt instruments.
1.2 Value of settlements in T2S
Chart 6 shows the variation in the value settled in T2S and settlement efficiency at end of day since the first migration wave was completed in 2015. Following the migration waves, monthly total T2S settled values increased from €10.14 trillion in September 2015 to €19.14 trillion in October 2017. Between November 2018 and December 2019, total T2S settled values averaged €22.98 trillion per month. The introduction of the new T2S statistical framework significantly affected settled values, which dropped to €14.76 trillion in January 2020 (i.e. a decrease of 32.38% compared with December 2019).[4] Like volumes, values increased notably in March 2020, reaching €16.74 trillion. Unlike volumes, in March 2021 values were higher than at the outbreak of the COVID-19 pandemic, standing at €17.06 trillion. Settlement efficiency in value terms averaged 97.52% between November 2018 and December 2019, largely in line with the average of 97.95% observed between September 2015 and October 2018. Following the move from the platform-based to the market-based methodology,[5] the decrease in settlement efficiency between December 2019 and January 2020 was slightly larger in value terms than in volume terms (-2.33 percentage points compared with -1.73 percentage points). As was the case for volumes, settlement efficiency in value terms also dropped, falling to 88.95% in March 2020. From that time to the end of 2022 settlement efficiency averaged 93.99% in value terms.
Chart 6
Variation in value settled in T2S and settlement efficiency at end of day
(left-hand scale: monthly totals, EUR billions; right-hand scale: settlement efficiency, percentages)

Source: T2S.
Notes: Migration wave 1: 22 June-31 August 2015; migration wave 2: 29 March 2016; migration wave 3: 12 September 2016; migration wave 4: 6 February 2017; final migration wave: 18 September 2017; NCDCP (Slovakian CSD): 27 October 2017; Danish kroner: 29 October 2018.
In 2022, T2S settled an average of €716.67 billion per day. Chart 7 shows the variation in daily average T2S traffic in value terms.[6] The daily average value ranged from €621.22 billion (in August) to €756.70 billion (in April). The highest daily value was recorded on 1 April (€1,070.90 billion) and the lowest on 23 August (€434.75 billion). As was the case for volumes, the minimum was reached in a period of lower traffic owing to seasonality. Overall, the daily average value settled in T2S in 2022 was higher than in 2021 (€691.10 billion). The range of the daily average value per month was narrower than it had been in 2021, when it fluctuated between €620.04 billion in August and €741.88 billion in March.
Chart 7
Values of settled T2S transactions in 2022
(EUR billions)

Source: T2S.
Comparing Chart 7 with Chart 2, the highest daily traffic is seen in different months for volume (March) and value (April). This is not the case for the lowest daily traffic (which was recorded in August for both volume and value). There is also less fluctuation across the different months in the value of transactions compared with the volume of transactions, daily average values at the end of the year being largely in line with those in the first quarter.
1.2.1 Real-time settlement and night-time settlement
In 2022, T2S settled transactions with an average monthly value of €15.35 trillion, compared with €14.86 trillion in 2021 (see Chart 8). Total monthly traffic ranged from a low of €14.29 trillion in August to a high of €17.10 trillion in March. This is in line with 2021, when the minimum (€13.64 trillion) and the maximum (€17.06 trillion) were reached in the same months.
Chart 8
NTS and RTS values in 2022
(EUR billions, monthly totals)

Source: T2S.
Chart 8 shows the breakdown by NTS and RTS of total monthly traffic in terms of value. On average, RTS accounted for 67.56% of overall traffic in value terms in 2022 (€10.37 trillion on average each month), compared with 32.44% settled in NTS (€4.98 trillion). This compares with 65.09% in value terms and 34.91% in volume terms in 2021. As shown in Chart 3, settlement was more evenly balanced between RTS and NTS in volume terms (47.48% and 52.52% respectively). This indicates that, in line with previous years, the RTS phases were more value-intensive than volume-intensive and featured transactions with a higher average value than those in the NTS cycles. By contrast, the NTS cycles were more volume-intensive than value-intensive.
In absolute terms, the monthly values settled in NTS and RTS in 2022 peaked at €5,723.72 billion in March and €11,425.97 billion in September respectively. As a percentage of the total monthly value, the peak value settled in NTS was recorded in February (33.68%), while the peak value settled in RTS was recorded in December (69.54%). 68.00% of the total value of DVP transactions, which represented the majority of overall T2S traffic, was settled in RTS.
1.2.2 Settlement value by transaction type
Three transaction categories make up settlement values in T2S, namely DVP, DWP and PFOD, compared with five categories for settlement volumes.[7] Chart 9 illustrates the total value settled in T2S by transaction type in 2022.
Chart 9
Settlement value by transaction type in 2022
(percentages, yearly totals)

Source: T2S.
Note: The category “Other” includes PFOD and DWP.
Average DVP transactions were by far the largest contributor to T2S traffic, accounting for 95.44% (corresponding to a daily average of €683.99 billion), compared with 95.52% in 2021. PFOD and DWP transactions together accounted for only 4.56% (corresponding to a daily average of €32.68 billion) of the total value settled, compared with 4.48% in 2021.
1.2.3 Settlement value by transaction categories
As in the case of volumes, the three largest securities categories contributing to T2S traffic in terms of value are equities, entitlements (rights) and debt instruments. Chart 10 shows the daily average value settled for these three types of security in 2022. Debt instruments were by far the largest securities category in overall T2S traffic in value terms, with a daily average of €602.17 billion (84.02%), followed by equities with €65.99 billion (9.21%) and entitlements (rights) with €1.20 billion (0.17%). The remaining share (6.60%) was attributable to other types of security. In 2021 the weights of debt instruments and equities were slightly higher (84.98% and 9.72% respectively), while the weight of entitlements (rights) was largely unchanged (0.16%).
Chart 10
Value by securities category in 2022
(EUR billions, daily averages)

Source: T2S.
Note: Owing to the much lower values of entitlements (rights) settlements compared with the other two categories, such amounts are barely visible on the chart.
In contrast to Chart 5, where equities are the largest securities category in volume terms, in Chart 10 they are the second-largest in value terms, while debt instruments are by far the largest category in value terms but only the third-largest in volume terms. This suggests that equity transactions have a much lower average value than debt instrument transactions. Like equities, entitlements (rights) contribute more to settlement volumes than to values.
1.3 Settlement efficiency
Settlement efficiency in T2S is measured as the efficiency of its participants and their behaviour on the platform.[8] It compares the volume (or value) of transactions that are settled on a given day with the total volume (or value) of transactions eligible for settlement on that day.
Charts 11 and 12 show the variations in settlement efficiency in T2S in 2022 at end of day and after NTS respectively.
Chart 11
Settlement efficiency at end of day in 2022
(percentages)
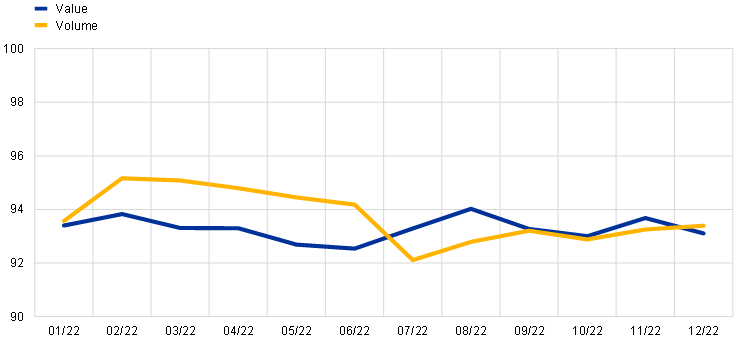
Source: T2S.
In 2022 settlement efficiency at end of day reached, on average, 93.74% in volume terms and 93.29% in value terms. These figures were 0.60 percentage points and 0.78 percentage points lower than the figures for 2021, when settlement efficiency at end of day averaged 94.34% in volume terms and 94.07% in value terms. In 2022 settlement efficiency in volume terms ranged between 92.11% and 95.16%, as illustrated in Chart 11. It displayed less volatility in value terms, ranging between 92.54% and 94.02%. The minimum level was reached in July in volume terms and in June in value terms. Conversely, the maximum level was reached in February in volume terms, and in August in value terms. Following the minimum in volume terms reached in July, settlement efficiency at end of day has recovered, although without returning to the levels it had reached prior to the implementation of the penalty mechanism.
In 2022 average settlement efficiency after NTS reached 64.20% in volume terms and 38.65% in value terms (see Chart 12), compared with the higher levels of 67.89% and 41.82% respectively recorded in 2021. In line with end of day, settlement efficiency after NTS displayed less volatility in value than in volume terms. The minimum level was reached in December in volume terms (66.33%) and in September in value terms (36.80%) whereas the maximum level was reached in March in volume terms (67.70%) and in February in value terms (39.83%). Settlement efficiency after NTS dropped significantly in July, mainly owing to an increase in the volume of party-on-hold transactions, in line with settlement efficiency at end of day, and remained flat until the end of the year.
Chart 12
Settlement efficiency after NTS in 2022
(percentages)
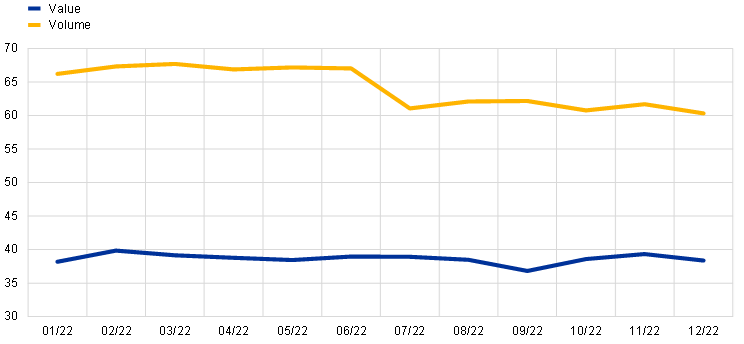
Source: T2S.
It is important to emphasise that settlement efficiency is in line with market expectations and its trend is discussed with the key stakeholders via dedicated Market Settlement Efficiency (MSE) workshops (See Box 1).
Box 1
Ongoing initiatives focusing on settlement efficiency in the securities market in Europe
Efficient securities settlement is a pre-requisite for a well-functioning and integrated financial market. For this reason, settlement efficiency in the European securities market has long been at the centre of attention of the Eurosystem, the Central Securities Depositories (CSDs), the industry at large and the regulators. The entry into force in February 2022 of the provisions of the CSDR and the related Regulatory Technical Standards (RTSs) pertaining to the settlement discipline regime (SDR) represented an important milestone in this respect. The objective of the measures introduced by the SDR[9] is to prevent and address settlement fails across Europe and to create incentives for market participants to achieve timely transaction settlement, thereby improving the efficiency of the securities settlement process. Following the entry into force of the SDR, all involved stakeholders have intensified their activities and discussions around the topic of settlement efficiency.
The Eurosystem has always actively promoted settlement efficiency in the European securities market in its roles as both operator of the T2S platform and catalyst of market initiatives. Under the remit of the T2S CSD Steering Group (CSG), the monitoring of settlement efficiency in T2S has evolved over time to respond to market needs and to regulatory requirements. In 2020, the CSG Data Access Task Force introduced an indicator of settlement efficiency for T2S which offered a business-oriented perspective, namely MSE.[10] In recent years CSG MSE workshops have focused on developing and discussing alternative indicators of settlement efficiency in T2S in line with CSDR guidelines to the extent possible.[11] At the same time, the MSE workshops have continued to facilitate discussions focused on the drivers of settlement efficiency within the T2S community. As an example, following communication with the market, there was a specific focus on intraday settlement efficiency indicators in 2021. Going forward, the CSG plans to hold regular MSE workshops to continue fostering this type of dialogue with key stakeholders. Similar discussions on settlement efficiency have also taken place in wider fora, such as discussions held in the Advisory Group on Market Infrastructures for Securities and Collateral (AMI-SeCo) which gathers, in different compositions, T2S users as well as other financial market stakeholders. Recent debates have emphasised the different phases of the transaction lifecycle ahead of settlement, in order to identify the possible drivers behind settlement fails, especially when they stem from market behaviour rather than CSD services or functionalities. AMI-SeCo has suggested launching a survey based on this objective.
Securities settlement efficiency has also been widely discussed in the market. In early 2022 the International Capital Market Association’s European Repo and Collateral Council summarised, in a white paper, its initiatives aimed at optimising settlement efficiency in the European fixed income markets through measures complementary to the CSDR.[12] This work focused on identifying opportunities for strengthening settlement efficiency and promoting best practices in repo markets. Similarly, the European Central Securities Depository Association (ECSDA) has a regular working group that discusses developments around settlement efficiency in the respective markets and monitors developments around cash penalties. At the end of 2022, ECSDA also organised a panel discussion bringing together the industry, the European Securities and Markets Authority, the European Central Bank (ECB) and the European Commission to debate trends, challenges and expectations regarding settlement efficiency in the European securities market after the entry into force of the SDR.
On the regulatory side, after the decision, based on the European Commission’s proposal, to suspend the application of the mandatory buy-in rules, EU legislators are working on a review of the CSDR.[13] The aim of this review is, among other things, to provide new and revised rules under the SDR which make the CSDR more effective and proportionate, taking into account lessons learnt and the feedback received from market stakeholders. In particular, the proposal by the European Commission includes a more focused application of settlement fail penalties and the option for EU regulators to adopt additional measures if there is an insufficient decrease in the rate of settlement fails in the European securities market.
Following the entry into force of the SDR, the topic of efficient securities settlement in the European market has gained further momentum. This has also been supported by several initiatives on the part of central banks, industry and the regulators. These efforts are expected to continue and to intensify in the course of 2023, including in the form of strengthened collaboration, with the aim of identifying and promoting measures which could improve settlement efficiency in Europe.
1.4 Unsettled transactions
Not all transactions submitted for processing in T2S are settled on the intended settlement day. This may be because the resources (cash and/or securities) needed for settlement are not available or because one of the two instructions underlying the transaction is set to on-hold. It may also be because the instruction is submitted late. Unsettled transactions negatively impact settlement efficiency (see Section 1.3).
Chart 13 illustrates the daily average volume of unsettled transactions in T2S at the end of the day in 2022. The calculations comprise DVP, DWP, PFOD, FOP and SRSE transactions.
Chart 13
Volume of unsettled transactions in 2022
(number of transactions, daily averages)

Source: T2S.
In 2022 the daily average number of unsettled transactions was 11,457, which is lower than the 14,170 transactions reported in 2021. This means that, on a daily average basis, of the total number of transactions processed by T2S, 6.26% were unsettled at end of day. Unsettled transactions reached a high of 16,404 in January and a low of 9,620 in September. In line with the results observed for settled transactions, DVP and FOP represented around 98.64% of all unsettled transactions in volume terms.
Chart 14 shows the daily average value of unsettled transactions in T2S in 2022. The transaction types contributing to the value are DVP, DWP and PFOD.
Chart 14
Value of unsettled transactions in 2022
(EUR billions, daily averages)

Source: T2S.
The daily average value of unsettled transactions in T2S in 2022 ranged between €25.24 billion in August and €36.28 billion in September. These figures are significantly higher than in 2021, when they ranged between €14.75 billion in August and €34.52 billion in November. In 2022, DVP represented 98.98% of all unsettled transactions in value terms, followed by PFOD with 1.02%. Once again, these results reflect the composition of settled traffic in value terms.
At each end of day, unsettled transactions are not deleted but are instead automatically postponed by T2S (“recycled” in technical terms) to the following business day(s). T2S attempts to recycle such transactions for a period of time referred to as the “recycling period” (set at 60 business days for matched instructions) before they are automatically cancelled. In other words, the recycling period is defined as the number of days during which a transaction remains unsettled. Chart 15 shows the share of unsettled transactions and the recycling days required before settling.
Chart 15
Average unsettled transactions and number of recycling days in 2022
(share of unsettled transactions, percentages; number of recycling days)

Source: T2S.
Note: the maximum recycling period for matched settlement instructions is 60 business days.
Chart 15 shows that in 2022, on average, 24.62% of unsettled transactions sent for recycling were settled on the following business day and less than half of those (11.78% in total) were pending for two days before settlement. Only 0.80% were pending for 16 days. In 2021 these averages stood at 24.93%, 11.50% and 1.11% respectively.
1.5 Penalty mechanism
The entry into force of the CSDR settlement discipline regime on 1 February 2022 introduced cash penalties for late matching and settlement fails for instructions settled in the EU, with the aim of promoting efficiency. Accordingly, T2S implemented a penalty mechanism that provides for (1) the daily calculation and reporting of cash penalties for settlement fails, and (2) monthly reporting of the aggregated amounts of cash penalties computed for a given month and for each T2S settlement currency. This is, therefore, the first year for which there are data on this new feature.
In 2022, T2S participants paid an average number of 1,075,222 cash penalties for late matching and settlement fails related to their euro activities (see Chart 16). The monthly volume of cash penalties related to settlement in euro ranged between 919,686 (in November) and 1,449,465 in March). The figure for February was 1,221,272, and the volume increased from April (1,023,962) to June (1,151,431), before progressively decreasing until the end of the year. The number of cash penalties related to settlement in Danish kroner was significantly lower, in line with its lower contribution to T2S traffic (see Chart 16). Cash penalties for settlement in Danish kroner averaged 22,995 and ranged between 18,289 (in February) and 28,348 (in March). Penalties in volume terms fluctuated considerably in the first half of 2022, reaching a second-highest peak of 27,658 in June before decreasing significantly in July (20,462). Their third-highest peak was in September (24,136), after which they fell steadily to 19,348 in December.
Chart 16
Volume of cash penalties in 2022
(number of transactions related to activities in euro, monthly totals (left-hand scale); number of transactions related to activity in Danish kroner, monthly totals (right-hand scale))

Source: T2S.
In 2022, on average, the monthly value of cash penalties for settlement in euro amounted to €141.61 million in T2S, ranging between €78.11 million (in October) and €236.44 million (in November) (see Chart 17). From the level reached in March (€195.36 million), cash penalties fell steadily until the end of the year, the two exceptions being the peaks in August (€197.66 million) and November (€236.44 million). By contrast, the monthly value of cash penalties for settlement in Danish kroner averaged €1.74 million in 2022, fluctuating between €1.31 million (in February) and €2.12 million (in March), in line with minimum and maximum volumes (see Chart 16).
Chart 17
Value of cash penalties 2022
(related to activity in euro, EUR millions (left-hand scale); related to activity in Danish kroner, EUR millions (right-hand scale))

Source: T2S.
Note: The values related to activities in Danish kroner were converted into euro at an exchange rate of DKK 1 to EUR 0.13.
The average value of cash penalties can be computed by comparing volumes and values. In 2022, the average value of a cash penalty related to settlement in euro in T2S ranged between €82.50 (in October) and €257.08 (in November), while for settlement in Danish kroner it ranged between €53.58 (in June) and €95.13 (in April).
Box 2
Penalty mechanism implementation
The T2S penalty mechanism, which comprises a combination of change requests, was implemented in the production environment, starting with Release 4.2 in November 2020 and ending with Release 6.0 in July 2022. The usual testing campaign for these change requests (except for T2S-760-URD[14]) was complemented with a dry run in the production environment covering the period between 13 September 2021 and 31 January 2022. The SDR entered into force on 1 February 2022.
This dry run period served as a useful intermediate step between the regular tests conducted in a testing environment and the final activation of the penalty mechanism. It made it possible to test the functioning of the new software features and their associated operational procedures under real production conditions, providing valuable visibility of their volumetric and timing dimensions. The performance of the penalty mechanism was suboptimal during and shortly after the dry run, resulting in a number of related incidents (see Section 2.2.1: 10 February incident).
During this period, the T2S Service Operator applied several performance improvements that managed to scale down the penalty mechanism-related process durations to within the expected target of 315 minutes as of 23 February 2022 onwards, with only 11 exceptions on specific days during the rest of the year. Chart A displays these average durations aggregated by week.

1.6 Use of auto-collateralisation in T2S
Auto-collateralisation in T2S is an intraday credit operation granted by a central bank which is triggered when a T2S dedicated cash account (DCA) holder does not have enough funds to settle securities transactions. Its ultimate purpose is to improve the buyer’s cash position and secure the funds necessary to settle the transaction. Auto-collateralisation is an automatic process which is aimed at facilitating smooth real-time DVP settlement in central bank money.
Two types of auto-collateralisation are available in T2S:
- auto-collateralisation on-flow is the use of the securities which are about to be purchased as collateral to secure the credit needed to complete the transaction;
- auto-collateralisation on-stock is the use of other securities already held by the buyer as collateral to complete the transaction.
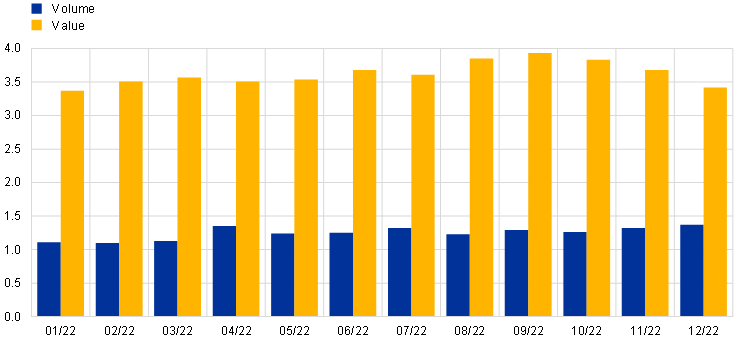
In 2022, the overall use of auto-collateralisation reached a daily average value of €123.90 billion, compared with €115.79 billion in 2021. Chart 18 shows the daily average value of auto-collateralisation per month, broken down by type. The daily average use of auto-collateralisation ranged between €110.83 billion in May and €139.00 billion in December. The use of auto-collateralisation largely follows a similar pattern to that observed for daily DVP transactions settled throughout the year.
Chart 18
Auto-collateralisation use by type in 2022
(left-hand scale: EUR billions, daily averages; right-hand scale: number of transactions, monthly totals)

Source: T2S.
Note: The chart shows use of auto-collateralisation by national central banks.
On average, 84.85% of the total value of auto-collateralisation was represented by auto-collateralisation on-flow (corresponding to €105.13 billion) and 15.15% by auto-collateralisation on-stock (corresponding to €18.77 billion). Like in 2021, the use of auto-collateralisation on-stock remained relatively stable in 2022. By contrast, the use of auto-collateralisation on-flow displayed a more volatile pattern, reaching a peak of €117.39 billion in September. The total monthly number of auto-collateralisation transactions ranged between 235,454 (in April) and 313,306 (in December).
In 2022 the overall use of auto-collateralisation on a monthly basis ranged between €2,383.37 billion in April and €3,027.68 billion in September. Chart 19 shows the monthly total value of auto-collateralisation, broken down by RTS and NTS, and the value of auto-collateralisation as a share of DVP transactions.
Chart 19
Real-time and night-time use of auto-collateralisation in 2022
(left-hand scale: EUR billions; right-hand scale: percentages, monthly totals)

Source: T2S.
Note: The chart shows use of auto-collateralisation by national central banks.
On average, 84.19% of monthly total auto-collateralisation transactions took place during RTS (corresponding to €2,233.93 billion) and 15.81% took place during NTS (€419.54 billion) in 2022. This compares with 83.08% and 16.92% respectively in 2021. The use of auto-collateralisation in RTS and NTS follows a similar pattern to that of the daily average value of transactions settled in T2S (see Chart 8). Auto-collateralisation use during RTS peaked in September (€2,606.33 billion) while its use during NTS peaked in March (€461.86 billion).
In 2022 the value of auto-collateralisation as a share of DVP transactions stood, on average, at 18.11%, with a peak of 19.68% in December. This represents an increase compared with 2021, when auto-collateralisation as a share of DVP transactions averaged 17.54%.
1.7 Other aspects related to settlement in T2S
1.7.1 Internally and externally matched settlement instructions
In order to settle a securities transaction, the delivering and receiving parties provide the necessary details in the form of settlement instructions. The two settlement instructions must be compared to ensure that both parties agree on the terms of the transaction. If the comparison is successful, the two settlement instructions are matched, generating a new settlement transaction in T2S. This process can take place either inside T2S in the module performing the validation and matching of individual settlement instructions (life cycle management and matching) or outside T2S, such as within a CSD. In the first case the settlement instructions are referred to as internally matched, while in the second case they are referred to as externally matched.
In 2022, on average 704,679 settlement instructions were matched daily in T2S, compared with an average of 776,728 daily settlement instructions matched outside T2S. This represents a decrease of 3.25% and 3.66% respectively compared with 2021. Chart 20 compares the daily average number of instructions internally and externally matched each month.
Chart 20
Internally and externally matched settlement instructions in 2022
(number of instructions, daily averages)

Source: T2S.
Overall, 47.57% of settlement instructions were internally matched, while more than half (52.43%) were already matched when they reached T2S.
1.7.2 Intra-CSD, cross-CSD and external-CSD settlement
Investors can access different markets linked to T2S through multiple technical channels. Depending on the number of CSDs involved, it is possible to distinguish between intra-CSD, cross-CSD and external-CSD traffic.
- Intra-CSD traffic refers to securities transfers where the delivering and receiving parties belong to the same CSD;
- Cross-CSD traffic occurs when the delivering and receiving parties belong to different CSDs;
- External-CSD traffic occurs when the delivering and receiving parties belong to different CSDs, one of which is not in T2S.
In T2S, intra-CSD transactions represent the majority of all settled transactions in terms of both volume and value.
As Chart 21 shows, in 2022 the daily average volume of intra-CSD transactions represented 98.20% of total T2S settlement volume (98.42% in 2021), while the daily average value of intra-CSD settlement represented 96.37% of total T2S settlement value (96.90% in 2021).
Chart 21
Intra-CSD settlement in 2022
(percentages, daily averages)

Source: T2S.
Only a small percentage is attributable to cross-CSD traffic. Chart 22 shows the share of cross-CSD transactions compared with total value and volume for all transactions settled[15], in terms of daily average volume and value, in 2022.
Chart 22
Cross-CSD settlement in 2022
(percentages, daily averages)
Source: T2S.
In 2022 the daily average volume of cross-CSD settlement transactions represented 1.25% of total T2S settlement volume (1.05% in 2021), while the daily average value of cross-CSD settlement transactions represented 3.63% of total T2S settlement value (3.10% in 2021).
Considering that intra-CSD and cross-CSD transactions together accounted for 99.45% of total volume and 100.00% of total value, the share of external-CSD settlement was negligible in 2022, as was the case in 2021.
1.8 Interaction between T2S and connected RTGS systems
At the start of each day liquidity is sent from the RTGS accounts in TARGET2 and Kronos2 (see Section 1.8.2) to the DCAs in T2S, while towards the end of RTS, at the latest, any remaining liquidity in DCAs is returned from T2S to the corresponding RTGS accounts. During the day, liquidity can be freely transferred from the RTGS systems to T2S and vice versa.
1.8.1 Interaction between T2S and TARGET2
Inbound liquidity transfers are transfers from the TARGET2 RTGS accounts to the T2S DCAs, while outbound liquidity transfers are transfers from the T2S DCAs to the TARGET2 RTGS accounts.
Chart 23 shows the daily average volumes of liquidity transfers between TARGET2 RTGS accounts and T2S DCAs in 2022. The daily average volume for inbound liquidity transfers from TARGET2 was 655, while the daily average volume for outbound liquidity transfers to TARGET2 was 1,145.
Chart 23
Volume of liquidity transfers between TARGET2 RTGS accounts and T2S DCAs in 2022
(number of transactions, daily averages)

Source: T2S.
Chart 24 shows the daily average value of liquidity transfers between TARGET2 RTGS accounts and T2S DCAs in 2022. The daily average value of inbound liquidity transfers from TARGET2 was €147.40 billion, while the daily average value of outbound liquidity transfers to TARGET2 was €152.04 billion. Any remaining balance on T2S DCAs stemming from the discrepancy between inbound and outbound liquidity transfers is automatically transferred back to TARGET2 as part of RTS closure activities.
Chart 24
Value of liquidity transfers between TARGET2 RTGS accounts and T2S DCAs in 2022
(EUR billions, daily averages)

Source: T2S.
1.8.2 Interaction between T2S and Kronos2
Inbound liquidity transfers are transfers from the Kronos2 RTGS accounts to the T2S DCAs, while outbound liquidity transfers are transfers from the T2S DCAs to the Kronos2 RTGS accounts.[16]
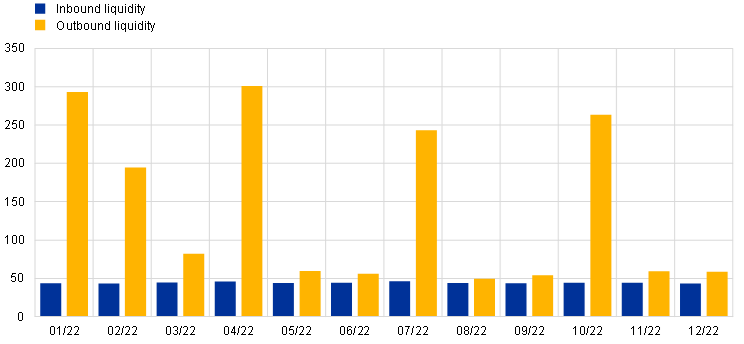
Chart 25 shows the daily average volumes of liquidity transfers between Kronos2 RTGS accounts and T2S DCAs in 2022. The daily average volume of inbound liquidity transfers from Kronos2 was 44, while the daily average volume of outbound liquidity transfers to Kronos2 was 140.
Chart 25
Volume of liquidity transfers between Kronos2 accounts and T2S DCAs in 2022
(number of transactions, daily averages)
Source: T2S.
Chart 26 shows the daily average value of liquidity transfers between Kronos2 RTGS accounts and T2S DCAs in 2022. The daily average value of inbound liquidity transfers from Kronos2 was €2.29 billion (corresponding to DKK 17.62 billion), while the daily average value of outbound liquidity transfers to Kronos2 was €3.96 billion (corresponding to DKK 30.46 billion). Any remaining balance on T2S DCAs stemming from the discrepancy between inbound and outbound liquidity transfers is automatically transferred back to Kronos2 as part of RTS closure activities.
Chart 26
Value of liquidity transfers between Kronos2 accounts and T2S DCAs in 2022
(EUR billions, daily averages)
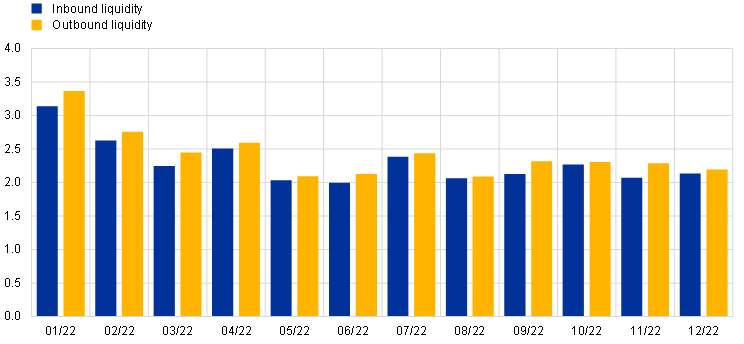
Source: T2S.
2 T2S service level and availability data
2.1 Technical availability
The Eurosystem pays particular attention to the proper functioning and operation of the T2S platform. The availability of services is measured continuously and objectively at pre-defined components of T2S, throughout each settlement day but excluding the maintenance window.
The use of key performance indicators (KPIs) is one of the measures implemented to demonstrate how effectively T2S is achieving its punctuality objectives. The punctuality of T2S is measured by calculating the real duration of the following three phases of the business day and comparing these against the expected target durations.
- Start of day (SOD) – measures the time elapsed between the start-of-day phase (event BDCD) and the end of start of day (event ESOD)
- NTS including reporting (NTS + reporting) – measures the time elapsed between the start of NTS (event C1P0) and the end of NTS reporting (event ENTS)
- End of day (EOD) – measures the time elapsed between the start of the end-of-day phase (event SEOD) and the end-of-day reports (event EEOR)
Chart 27 summarises the average duration, on a monthly basis, of the different phases in a business day, compared with the respective target durations. The figures show that the platform operated within target expectations.
Chart 27
Punctuality
(minutes)

Source: T2S.
2.2 Incidents in T2S
The Eurosystem is dedicated to ensuring the smooth operation of the T2S system during normal operations and to guiding activities aimed at restoring the proper functioning of the T2S Services in the event of incidents.
In 2022 the T2S platform experienced three major incidents, described as unplanned interruptions or reductions in the quality of an agreed service for which a Crisis Managers' conference call was required .[17] Each incident was followed up with a detailed report, which serves as input for continuously improving the service and for increasing capabilities for preventing or mitigating them in the future. Paragraphs 2.2.1 – 2.2.3 provide more details of these incidents.
By way of comparison, in 2021 the T2S platform also experienced three major incidents.
As Chart 28 shows, throughout 2022 the overall service level indicator, computed as the weighted average of the platform services, never fell below the committed KPI value of 99.7%. This committed value was also never breached for any of the individual KPIs across the 12 monthly averages.
Chart 28
Overall service level indicator in 2022
(percentages)

Source: T2S.
2.2.1 10 February incident
On 10 February 2022, the event related to penalty mechanism static data preparation (event PMSD) involved an unusually long duration after a fix had been installed on 9 February to address the recurrent extended duration of this event. The service provider traced the root cause of the PMSD duration back to the database calculating the wrong access path.
As a result, the T2S Crisis Managers decided to skip and reschedule all penalty mechanism-related events to avoid any further impact on the operating day and to roll back the fix. The service provider closed the impacted event at 17:09 and the activities which had been skipped were rescheduled for the following business day.
2.2.2 12 April incident
On 12 April 2022, the T2S NTS event C1P1 (Start of cycle 1/preparation of sequence 1) started with a requested delay of four hours following an operational incident at a CSD. The CSD had suffered a major system failure that required it to move to a second data centre.
Settlement and Crisis Managers agreed to the CSD’s request and the NTS event C1P1 started at 00:00 (instead of shortly after 20:00 as is customary).
2.2.3 18 November incident
On 18 November 2022, T2S faced an incident affecting outbound A2A traffic. A high number of outbound messages accruing on several back-out queues were identified. The source of the issue was the tablespace responsible for managing RTS bundled outbound files, as it had reached its maximum capacity.
To resolve the situation, the service provider started a reorganisation of the tablespace, while the Settlement Managers decided to implement temporary mitigation measures such as disabling the T2S RTS bundling functionality.
After the tablespace had been increased the service provider reactivated the T2S RTS bundling and reinjected all queued messages from the back-out queues. The incident was solved by 16:30 although it led to an IDVP delay of three hours with a knock-on effect on the subsequent cut-offs (IFOP took place at 20:00). Furthermore, it also caused a two-hour delay to the start of EOD at TARGET2.
3 T2S financial performance
3.1 Cost recovery objectives
The financial position of T2S is determined by cost and revenue trends. The platform operates on a full cost recovery basis, meaning that all costs incurred should be covered by the revenues generated. The T2S pricing structure is defined in Schedule 7 of the T2S Framework Agreement and is also available in the TARGET Services Pricing Guide. T2S cost recovery is driven by four factors:
- the transaction volumes that are settled in T2S;
- the fees that are charged to T2S actors for using its services;
- the pre-defined T2S cost recovery period;
- the variation of T2S costs over time.
3.2 Financial performance of T2S
The overall financial position of T2S is detailed in the annual T2S financial statements, which are prepared in accordance with specific accounting policies established by the Market Infrastructure Board (MIB). In the interests of clarity, the financial information is presented in a way which is similar to a profit and loss report (T2S operating statement) and a balance sheet report (T2S financial situation report). The T2S operating statement shows yearly accumulated revenues (collected on a monthly basis) and yearly operational costs (paid on a quarterly basis).
The T2S financial situation report provides a snapshot of relevant items in the asset and liability accounts.
For more information on the T2S financial position, see the latest T2S financial statement for 2021.[18]
3.3 Analysis of revenues collected in 2022
Chart 29 shows the relative split (in percentage terms) in T2S revenues between settlement services (SETT) and information services (INSV). The SETT revenue derives from the core settlement services that are available continuously during the night-time and real-time settlement periods, except for a short period during the maintenance window. Information services include services related to T2S information items such as queries and reports. As a part of this service, a CSD or a national central bank (NCB) may query any of its assigned accounts.
As Chart 29 shows below, in 2022 approximately four-fifths (81.7%) of T2S revenues stemmed from settlement services, while approximately one-fifth (18.3%) of T2S revenues stemmed from information services. The increase in the settlement services portion of T2S revenues in recent years (with a concomitant reduction in the information services portion) is mainly because of the gradual migration of some of the largest T2S markets in the platform’s first years of operation, as well as the increase in T2S prices which became effective in January 2019.
Chart 29
Share of T2S revenue split between settlement and information services
(percentages)

Source: T2S
Table 2 displays the share (as a percentage) of T2S revenues split between SETT and INSV, per tariff item. In 2022 the tariff items that contributed most to the settlement services portion of T2S revenues were DVP (53.2%) and FOP (10.0%), while the tariff items that contributed most to the information services portion of T2S revenues were charges related to messages bundled into file (9.5%) and transmissions (4.8%).
Table 2
Share of T2S revenues split between INSV and SETT tariff items
(percentages)

4 T2S risk management and compliance
4.1 Risk management
Managing operational and information security risk is a key element of the governance structure of T2S.
T2S governance is based on the ECB Guideline on T2S, which lays down the responsibilities of the Governing Council and of the MIB concerning T2S, including risk management-related responsibilities.[19] Thus, the Governing Council decides on the general operational aspects of T2S, including the T2S risk management framework. The MIB’s responsibilities include, among others, preparing proposals (in full respect of the mandates of the European System of Central Bank committees) regarding the T2S risk management framework, as well as implementing and managing the risk management frameworks of other projects under its governance.[20]
The T2S risk status and assessment, including risk analysis and mitigation measures (if required), are shared on a regular basis with the CSDs and the NCBs via the relevant fora: the Operations Managers Group, the Project Managers Group, the CSD Steering Group and the Securities Managers Group. Within the context of their own risk management activities, and complying with their own national regulatory requirements, CSDs and NCBs flag new risks to the relevant T2S governance bodies if they consider such risks to be significant.
Following a recommendation received from the TARGET2 Overseer (the Eurosystem), a three-lines-of-defence model[21] was adopted for risk management – adding a second line of defence (governance) to the existing two (audit and operations). This second line of defence reports to the MIB and considers the operational risks for all TARGET services. It will be enhanced incrementally in the years to come.
4.2 Oversight
The Eurosystem conducts oversight of T2S as laid down in the Eurosystem oversight policy framework. The ECB has primary oversight responsibility for T2S and leads and coordinates all oversight activities. T2S oversight is conducted by applying the principles for financial market infrastructures (PFMIs) established by the Committee on Payments and Market Infrastructures and the International Organization of Securities Commissions, and which the Eurosystem considers to be relevant for T2S.[22] The PFMIs are the international standards for FMIs and comprise payment systems, CSDs, securities settlement systems, central counterparties and trade repositories. Although T2S does not fall within the definition of an FMI provided in the PFMI report, the Eurosystem has decided to apply the PFMIs to T2S as these principles relate to functions performed by T2S, namely the settlement and recording of securities transactions.
In the course of 2022, the operations function engaged in an active dialogue with the oversight function to follow up on outstanding oversight recommendations stemming from the various previous assessments. The oversight function acknowledged the overall progress made in 2022 and closed off the respective outstanding recommendations based on actions completed.
With regard to cyber resilience, in March 2022 the oversight function finalised its assessment of T2S against the Eurosystem’s expectations regarding cyber resilience oversight. In November 2022, the operations function provided an action plan aimed at addressing the recommendations issued as a result of the assessment.
In 2022 the operations function shared the information requested by the ECB’s oversight function to support assessments of operational incidents and changes to the system implemented through T2S Release 6.0 in June 2022 and Release 6.2 in November 2022. The function then followed up on the outcomes of these assessments by addressing the recommendations which had been issued. The operations function provided the oversight function with aggregated settlement statistics and information on operational and financial performance, as well as on risk management, testing and migration activities, with a view to supporting the oversight function’s monitoring of those T2S activities considered relevant from an oversight perspective.
4.3 External examinations
T2S services are performed on a single technical platform integrated with central banks’ RTGS systems for all participating currencies. Under the T2S Framework Agreement, the Eurosystem and the CSDs have agreed that the performance of T2S services will be subject to technical and operational examinations performed by an external examiner. These examinations provide all participating CSDs with an independent, third-party assessment based on the established industry norm (ISAE 3402). The external examiner must be a reputable, internationally active accounting firm.
The objective of these examinations is to provide the CSDs with reasonable assurances that (a) the organisation set up by the Eurosystem meets the obligations established in the Framework Agreement, and (b) the controls implemented by the Eurosystem are designed, effective and allow for efficient risk assessments in a way that meets security objectives.
As its statute requires, the Eurosystem conducted a public tender in 2018 and appointed an external examiner for T2S for four years, a period which was later extended by an additional year to cover the years 2018-22. In 2022, the fourth external examination was conducted and the final report was issued on 7 November 2022. A comprehensive action plan was prepared and was approved by the Governing Council in February 2023. With one or two exceptions, the external examiner confirmed that the T2S controls examined were both suitably designed and implemented and had operated effectively throughout the period under examination which ran from 1 January 2021 to 31 December 2021. The findings and recommendations from the 2019 examination report will be addressed via the aforementioned comprehensive action plan, together with the recommendations from the 2018 action plan which remain open.
The external examination covering 2022 will be performed in 2023 – external examinations are regular and are carried out on a yearly basis.
In 2023, the external examiner will also carry out a special examination of T2S Release 6.0.
4.4 Special review
In December 2020 the ECB had appointed Deloitte GmbH to conduct an independent review of five major information technology-related incidents (not cyber incidents) which had occurred in 2020, affecting payment transactions and securities processing associated with TARGET services.
On 28 July 2021 the ECB published Deloitte’s independent review. The report included a detailed description of the relevant incidents, the impact each had on TARGET services’ participants and the respective root causes. In its response, the Eurosystem accepted Deloitte’s general conclusions and recommendations and committed to address them decisively. In the second half of 2021 the Eurosystem prepared an action plan to address, in a timely manner, the issues and recommendations raised by Deloitte.
Measures addressing the majority of recommendations were implemented in 2021 and 2022 (around 75% of all planned actions were completed by the end of 2022). The remaining measures are expected to be implemented in 2023. The Advisory Group on Market Infrastructures for Payments (AMI-Pay), the Advisory Group on Market Infrastructures for Securities and Collateral (AMI-SeCo) and the T2S CSG are regularly updated on the implementation of the action plan until the process has been completed.
5 System evolution
5.1 Regular software updates
The evolution of T2S reflects changes in business needs, regulatory factors and applicable market standards, along with some potential changes to aspects of system maintenance. The typical T2S annual release schedule includes one major release and one minor release, including change requests and production problems, as well as two production problem releases, which only include fixes for known production problems.
5.1.1 T2S releases in 2022 (R5.3, R6.0, R6.1 and R6.2)
On 19 February 2022 T2S Release 5.3 was deployed to fix three known production problems.
Although the go-live of Release 6.0 was initially planned for 11 June 2022, it was agreed to postpone the go-live date by three weeks to extend the testing phase. On 2 July 2022 the major T2S release, Release 6.0, went live with the implementation of 15 change requests (listed in Table 4 below), two editorial change requests and 23 fixes for known production problems. These changes covered a wide range of functional areas including the introduction of the new ESMIG (Eurosystem Single Market Infrastructure Gateway) interface and other common components developed for the T2-T2S consolidation project (see Section 5.4), as well as new technology for the digital signing of manual actions in T2S (non-repudiation of origin). In the case of the billing component (included in the initial scope of this release) it was agreed to postpone its activation because it was not possible to perform sufficient testing in time. On 1 December 2022 the T2S billing module was activated with the generation of past T2S invoices accumulated since July 2022.
A second release solely for production problems (Release 6.1) was deployed on 17 September 2022 to fix 25 production problems.
The minor release, T2S Release 6.2, was deployed on 19 November 2022 and included eight change requests (listed in Table 5 below), two editorial change requests and 34 fixes for production problems. The changes included enhancements to the T2S graphical user interface to query reference data objects and improvements to the generation of flat file reports.
The numbers of change requests deployed and production problems resolved in 2022 are shown in Table 3.
Table 3
T2S releases in 2022

Table 4
Change requests implemented in R6.0

Table 5
Change requests implemented in R6.2

5.1.2 Future system evolution
Starting with the first major release of 2023, the naming of a release will be amended to make it easier to identify its deployment timeline. Hence, 2023 changes to T2S will be delivered in two releases – T2S Releases R2023.JUN and R2023.NOV. The changes planned for June 2023 will include the new T2S data warehouse together with enhancements focusing on processing the high-volume transactions of corporate action events stemming from new CSDs with an end-investor market-business model. In November 2023 the T2S R2023.NOV release will include enhancements to the penalty mechanism as well as adaptations which take into account the migration of the Danish kroner to T2 and TIPS in April 2025.
In addition to the major and minor releases in 2023, two releases solely for production problems will be deployed – one on 18 February 2023 (T2S R2023.FEB) and the other on 16 September 2023 (T2S R2023.SEP).
5.2 Onboarding and exit activities
5.2.1 Onboarding activities
T2S has also been evolving constantly in terms of participants. The following CSDs are currently working towards joining the T2S platform.
- Euroclear Finland. The migration of Euroclear Finland to T2S is scheduled for 11 September 2023. As an end-investor market, Euroclear Finland is expected to bring more than two million securities accounts to T2S, a significant increase on today’s operations, and there is substantial focus on testing and migration activities to ensure that production operations run smoothly.
- Euroclear Bank. The onboarding of Euroclear Bank (EB) will follow a phased migration approach to ensure a smooth transition that enables EB to start offering its clients settlement services in central bank money. The EB migration plan was endorsed by MIB in July 2022 and the migration of EB to T2S as SME is scheduled for 11 April 2023 and as a T2S CSD on 11 September 2023.
- Središnje klirinško depozitarno društvo (SKDD). Following the accession of Croatia to the euro on 1 January 2023 Hrvatska narodna banka (the Croatian central bank) and SKDD are scheduled to migrate to T2S on 11 September 2023. SKDD signed the T2S Framework Agreement on 19 May 2022 and the MIB endorsed the SKDD migration plan in November 2022.
- The Bulgarian market. Both CSDs active in the Bulgarian market reached an important milestone in 2022. The Central Depository AD (a privately owned CSD) and the Bulgarian National Bank Government Securities Settlement System (BNBGSSS), the CSD operated by the central bank, signed the T2S Framework Agreement on 20 October and 22 December 2022 respectively. A suitable migration date for BNBGSSS is being assessed in accordance with T2S governance procedures.
5.2.2 Exit activities
Following the decision taken by its shareholders on 30 September 2021 to liquidate the company, ID2S asked the Eurosystem to initiate the exit process from T2S. The exit from the test environment was performed in 2021, while the exit from the PROD environment was successfully completed in February 2022.
5.3 Consolidation of TARGET2 and T2S
The T2-T2S consolidation project will replace the current TARGET2 with a new RTGS system and will introduce Central Liquidity Management (CLM) as a liquidity hub for all TARGET services (T2, T2S, TIPS and ECMS).
The Governing Council decided on 20 October 2022 to reschedule the project’s go-live to March 2023 (from November 2022) to allow users more time to complete their testing in a stable environment.
The functional specification phase of the project ended in 2020 following the publication of stable User Detailed Functional Specifications (UDFS) and User handbooks (UHBs). Further updates were performed in 2021 to prepare these deliverables for testing.
In 2022, the focus was on the updates required for Production by incorporating change requests approved after the publication of the UDFS v2.2 and UHB v2.0 handbooks in 2021. UDFS and UHB v3.0 were published in October 2022.
The T2-T2S consolidation project has also published explainers and examples to help market participants better understand certain concepts by gathering information spread across different chapters or specification books into single documents.
The next versions of the user specifications are expected to be published in February 2023 in preparation for R2023.JUN (i.e. the first release after the go-live).
Migration, testing and readiness
The T2‑T2S consolidation project will go live on 20 March 2023 following a “Big Bang” migration approach. This means that the current TARGET2 SSP will be discontinued at the time of the launch of the new T2 service. It is not possible to transition in stages as the SWIFT FIN Y-copy message flow used in TARGET2 cannot co-exist with the V-shaped message flow that will be used by the new T2 service. The V-shaped set-up provides for network-agnostic connectivity and enhanced information security.
Following on from the testing activities initiated in 2021, the focus in 2022 was on intensifying the central bank testing (which started in June 2021) and user testing (which started in December 2021).
The migration process was also practised intensively in a set of go-live rehearsal tests, some of which included the whole TARGET community. T2 participants were invited to take part in dedicated testing campaigns including billing and ancillary system procedures. T2 participants had to successfully perform mandatory test cases in order to access the new platform.
The community readiness reporting process follows the community readiness framework outlined in the Migration, Testing and Readiness Strategy document. The readiness of the community to migrate in March 2023 was assessed against these milestones throughout the year in quarterly cycles.
Further details are available on the T2-T2S consolidation project page of the ECB’s website.
5.4 Eurosystem Collateral Management System
The Eurosystem Collateral Management System (ECMS) will be a single collateral management system used to manage eligible assets mobilised as collateral in Eurosystem monetary policy operations. It will replace current local collateral management systems.
The ECMS will interact with the CLM module in T2 to ensure the settlement of payments stemming from monetary policy operations, corporate actions and fees, and to update the relevant credit line.
In addition, the ECMS will interact with T2S in respect of the settlement of securities and the management of the auto-collateralisation process. The resulting synergies are expected to benefit NCBs and all other ECMS players in their communities – counterparties, CSDs and tri-party agents – by contributing to the efficient exchange of securities, collateral and liquidity within the Eurosystem. It will be accessible via a single common interface across jurisdictions and will facilitate the mobilisation of cross-border collateral.
In 2022, Eurosystem Acceptance Testing phase 1 concluded. User testing commenced with NCB, CSD and tri-party agent connectivity testing. To support ECMS stakeholders in testing activities, updated versions of the catalogue of ECMS messages and credit claim schemas were published on the ECB’s website, as was detailed information on the testing and migration strategy. An ECMS focus session reached out to external stakeholders in June, and the workshop series with CSDs and tri-party agents continued throughout 2022. The MIB defined the baseline go-live release scope for the ECMS, allowing that further mandatory change requests might still be added to the scope.
Following the decision to postpone the launch of T2, the Eurosystem’s new RTGS system and CLM model, by four months, the Governing Council of the ECB decided on 2 December 2022 to mitigate the impact by also rescheduling the launch of the ECMS from 20 November 2023 to 8 April 2024.
© European Central Bank, 2023
Postal address 60640 Frankfurt am Main, Germany
Telephone +49 69 1344 0
Website www.ecb.europa.eu
All rights reserved. Reproduction for educational and non-commercial purposes is permitted provided that the source is acknowledged.
For specific terminology please refer to the ECB glossary (available in English only).
PDF ISBN 978-92-899-5554-6, ISSN 2599-9257, doi:10.2866/735196, QB-CH-23-001-EN-N
HTML ISBN 978-92-899-5553-9, ISSN 2599-9257, doi:10.2866/52242, QB-CH-23-001-EN-Q
See Section 1.3 for further details.
See Box 1, “Changes in the T2S statistical framework” in the TARGET2-Securities Annual Report (2019).
Liquidity transfers are excluded from the reported statistics, following the changes made to the T2S statistical framework. See Box 1 of the TARGET2-Securities Annual Report (2019) for further details.
See Box 1, “Changes in the T2S statistical framework” in the TARGET2-Securities Annual Report (2019).
See Section 1.3 for further details.
From 29 October 2018 all charts related to settled value include transactions settled in Danish kroner. Traffic in Danish kroner is converted into euro at an exchange rate of DKK 1 to EUR 0.13.
As SRSE and FOP transactions do not imply a cash movement on a dedicated cash account, these two transaction types do not contribute to the calculation of value-based statistics. Moreover, liquidity transfers are excluded from the reported statistics, following the changes made to the T2S statistical framework. See Box 1 of the TARGET2-Securities Annual Report 2019 for further details.
Until December 2019 settlement efficiency was computed in terms of platform settlement efficiency. The platform settlement efficiency indicator (PSEI) focused on the ability of the T2S platform to process transactions and helped determine whether T2S was performing as expected with regard to system configuration and performance of the optimisation algorithms. It comprised all settlement activities, including those automatically generated by T2S. Since January 2020 settlement efficiency has been computed in terms of market settlement efficiency. The market settlement efficiency indicator (MSEI) seeks to capture the behaviour of T2S participants. As a consequence, it excludes transactions that are internally generated by T2S, transactions related to corporate actions and liquidity transfers from the calculation. It does, however, include party-on-hold transactions. Further to the above, it is recalled that ad-hoc analyses of settlement efficiency based on CSDR requirements are carried out in dedicated workshops of the CSG with market participants (see Box 1, “Market Settlement Efficiency Workshop IV”, TARGET2-Securities Annual Report (2020) and Box 1, “Settlement efficiency according to CSDR guidelines”, TARGET2-Securities Annual Report (2021)).
The measures include harmonised rules for reporting on settlement fails, penalties for settlement fails and mandatory buy-ins as well as requirements in other domains such as partial settlement, instruction recycling and the “hold and release” mechanism.
See Box 1, “Changes to the T2S statistical framework”, TARGET2-Securities Annual Report (2019).
See Box 1, “Market Settlement Efficiency Workshop IV”, TARGET2-Securities Annual Report (2020) and Box 1, “Settlement efficiency according to CSDR guidelines”, TARGET2-Securities Annual Report (2021).
The European Securities and Markets Authority’s final report “CSDR RTS on Settlement Discipline – Suspension of buy-in”.
T2S-0760-URD (“Reporting the transaction details for new penalties in the List of Modified Penalties”) was implemented in June through Release 6.0.
Some cross-CSD transactions are managed via intra-CSD transactions – i.e. an investor CSD in an issuer CSD is managed as an intra-CSD in T2S (as no realignment needed), while in fact it is a cross-CSD.
Kronos2 is the RTGS system of Danmarks Nationalbank. The traffic in Danish kroner is converted into euro at an exchange rate of DKK 1 to EUR 0.13.
Crisis management is activated as the second level of managing an incident. The settlement managers, who generally lead the business support functions of the participating CSD and central bank, are the first level for managing an incident, identifying possible solutions and deciding whether escalation to crisis management is required.
The T2S financial statement for 2022 will be made public in June 2023. Further to its publication, the T2S Annual Report will be updated to include the link to the latest financial statement.
2012/473/EU: Guideline of the European Central Bank of 18 July 2012 on TARGET2‑Securities (ECB/2012/13) (OJ L 215, 11.8.2012, p. 19).
See the MIB’s mandate.
See the IIA position paper, “The three lines of defence position paper”, Institute of Internal Auditors, January 2013.