


How is a leading international currency replaced by another? Old versus new evidence
How is a leading international currency replaced by another? Old versus new evidence
Published as part of the The international role of the euro, June 2023.
This special feature reviews the evidence – both old and new – on how a leading international currency is replaced by another. The conventional historical narrative is that inertia in international currency use is substantial – it takes a long time for a challenger currency to replace the incumbent owing to the existence of network externalities that give rise to lock-in effects. The US dollar remains the leading currency for global trade and finance today, despite the decline in the United States’ share of global output and trade, which testifies to the importance of inertia. However, one interesting exception is the currency invoicing of trade of countries neighbouring the euro area between 1999 – the year of the euro’s creation – and 2019, when the share of the euro increased by more than 20 percentage points on average, at the expense of the US dollar.
Two competing hypotheses may explain these developments: a trade shock – where stronger trade links with the euro area tilt invoicing towards the euro – and an exchange rate volatility shock – where growing use of the euro as an exchange rate anchor spills over to invoicing. Recent evidence from ECB staff research empirically tests the relative importance of these two shocks. The estimates give support to the view that a trade shock is a key determinant of the stronger role of the euro for invoicing international trade in countries neighbouring the euro area. In those countries where trade links with the euro area increased, the shock explains on average almost 40% of the rise in the share of exports invoiced in euro between 1999 and 2019. By contrast, the impact of greater exchange rate stability against the euro is statistically insignificant. Countries’ invoicing currency choices are not just impacted by their own trade patterns and exchange rate volatilities but also by those of their trade partners and competitors. These effects operate mainly via bilateral trade linkages rather than strategic complementarities in export price setting, which underscores the relevance of changes to input-output linkages as determinants of invoicing currency patterns.
These findings have implications for policy. They suggest that, in response to the pandemic shock and the war in Ukraine, reshoring or friendshoring of production chains could lead to stronger regional trade, notably on the European continent. That in turn could strengthen the future role of the euro for the invoicing of international trade.
1 The historical record thus far
Why is a leading international currency replaced by another? The conventional historical narrative suggests that it took between 30 and 70 years from when the United States overtook Britain as the leading economic and commercial power and the US dollar overtook the pound sterling as the dominant international currency, depending on the aspects of economic and international currency status considered. The United States had already surpassed Britain in terms of absolute economic size in the 1870s and had become the leading commercial power, gauged by the value of foreign trade, in 1913. It was the leading creditor nation by the end of the First World War, and yet, according to the conventional narrative, the pound sterling remained the dominant international currency until after the Second World War. The view that inertia in international currency use is substantial is rooted in theoretical models where international currency choice is characterised by network externalities, giving rise to lock-in and persistence effects, which benefit the incumbent unit.[1]
The conventional account of how long it takes for one international currency to replace another has been challenged to some extent.[2] Evidence suggests that the dollar had in fact already overtaken the pound sterling as the leading reserve currency in the late 1920s (Chart B.1, panel b).[3] What was true of reserve currencies was also true of the use of currencies for financing international trade.[4] The dollar had already overtaken the pound sterling as the leading form of trade credit (as the currency of denomination for what were known as “trade acceptances” or “bankers’ acceptances”) in the mid-1920s, not after World War II. Financial market development and policy support – with the Federal Reserve System as a market maker in the New York market for bankers’ acceptances – were instrumental in helping the dollar rival and overtake the pound sterling. Finally, additional evidence suggests that the dollar also emerged as the pre-eminent international currency in global bond markets as early as 1929 (Chart B.1, panel a).[5] Financial development was the main factor that helped the dollar to overcome the pound sterling’s head start.
Chart B.1
The US dollar had already overtaken the pound sterling as leading international currency in the 1920s
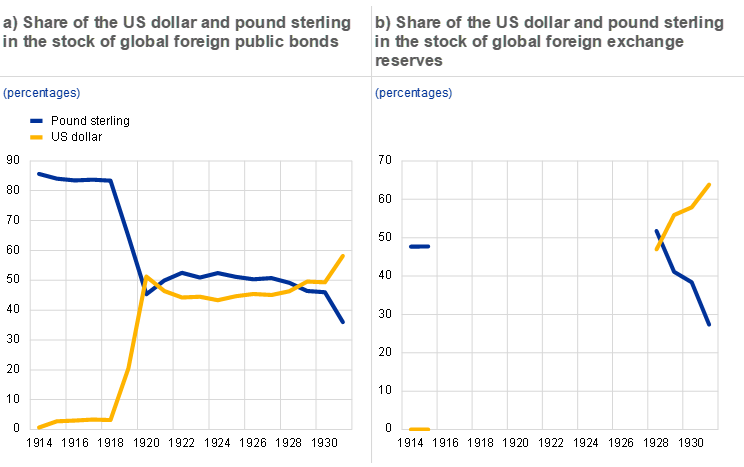
Sources: Eichengreen, B. and Flandreau, M. (2009), “The rise and fall of the dollar (or when did the dollar replace sterling as the leading reserve currency?)”, European Review of Economic History, Vol. 13, No 3, pp. 377-411; Chiţu, L., Eichengreen, B. and Mehl, A. (2014), “When did the dollar overtake sterling as the leading international currency? Evidence from the bond markets”, Journal of Development Economics, Vol. 111, Issue C, pp. 225-245.
Notes: The stock of global foreign public bonds excludes Commonwealth countries. No data are available on global foreign exchange reserves between 1915 and 1927. The latest observation is for 1931.
The conventional narrative remains largely valid today. The US dollar remains the main currency for global trade and finance despite claims that the euro or the renminbi would dethrone it.[6] It accounts for between 50% and 90% of global trade and financial transactions, depending on the metric considered, far more than the United States’ global economic and financial weight.[7] About half of global trade is invoiced in dollars – a share that has been broadly stable over the past two decades.[8] If the share of the dollar in international reserves has declined since 1999, it is mainly to the benefit of non-traditional reserve currencies other than the euro.[9]
A noteworthy exception is the invoicing of international trade in countries neighbouring the euro area. Countries that joined the euro area or the EU after the euro’s creation in 1999, EU candidate countries and other European countries have experienced marked increases in the use of the euro as an invoicing currency for international trade at the expense of the US dollar. The share of the euro as an invoicing currency for exports has increased on average by more than 20 percentage points since the turn of the millennium in these countries, while the share of the US dollar has declined by about the same magnitude (Chart B.2, panel a). Patterns for imports are similar, although the euro had more of a head start here (Chart B.2, panel b). Importantly, the rise in euro invoicing is not just a mechanical implication of euro adoption by some of these neighbouring countries.[10] This suggests that, under certain circumstances, a leading international currency might be replaced – or dwarfed in importance – by another.
Chart B.2
Use of the euro for invoicing by countries neighbouring the euro area increased after 1999 at the expense of the US dollar
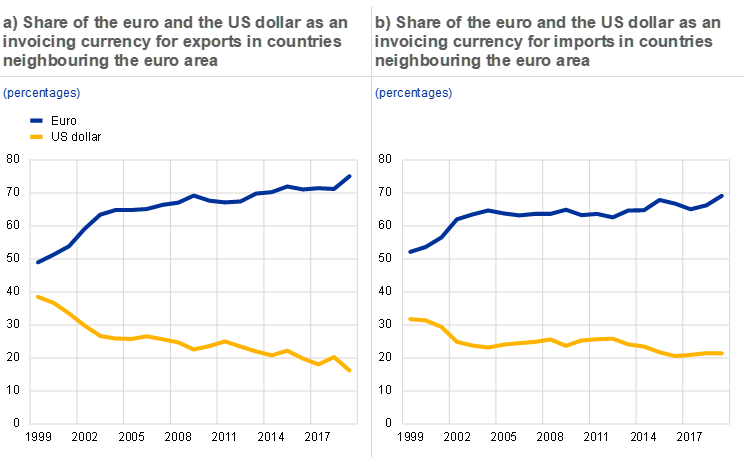
Source: Boz, E., Casas, C., Georgiadis, G., Gopinath, G., Le Mezo, H., Mehl, A. and Nguyen, T. (2022), “Patterns of invoicing currency in global trade: New evidence”, Journal of International Economics, Vol. 136, 103604.
Notes: Cross-country averages of individual observations of a sample of countries neighbouring the euro area which were not inaugural members of the euro area in 1999 (Bulgaria, Czech Republic, Estonia, Croatia, Latvia, Lithuania, Hungary, North Macedonia, Norway, Poland, Romania and Slovakia). The latest observation is for 2019.
2 New hypotheses and mechanisms
Recent theory points primarily to two hypotheses that could explain these developments. One hypothesis is a trade shock: the occurrence of a large, positive shock – or unexpected change – to the challenger’s role in international trade, which then feeds through self-reinforcing complementarities between a currency’s roles in global trade and finance.[11] Accordingly, as Europe took up a sufficiently large share of global exports relative to the United States, dynamics eventually got to a point where a euro-dominant equilibrium became inevitable. Chart B.3, panel b shows that exports of countries neighbouring the euro area to euro area countries increased significantly between the early 1990s and the mid-2000s, which is consistent with this hypothesis. Countries neighbouring the euro area transitioned towards market economies and were integrated into regional value chains and, in some cases, the EU. In parallel, the share of exports to the United States declined notably since the early 1990s. Another hypothesis emphasises a shock to exchange rate volatility: a stronger role of the challenger’s currency as a reference unit against which other economies manage their respective exchange rates.[12] A switch from US dollar to euro invoicing hence requires enough central banks to shift their exchange rate management policy away from the US dollar towards the euro.[13] In line with this hypothesis, exchange rate volatility against the euro declined significantly throughout the 1990s (Chart B.3, panel a). Exchange rate policies in many countries neighbouring the euro area turned to the euro as a nominal anchor, with some countries eventually adopting the euro. At the same time, exchange rate volatility against the US dollar declined as well, albeit to a lesser extent.
Chart B.3
Trade of countries neighbouring the euro area was re-oriented towards the euro in the 1990s, in tandem with a greater stability in their exchange rates vis-à-vis the euro
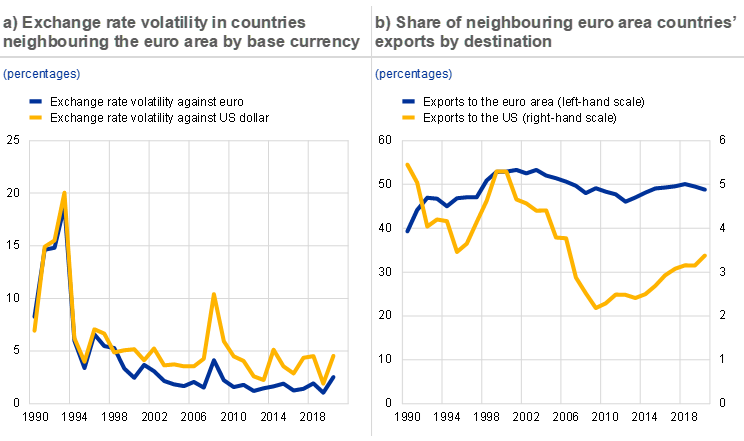
Sources: IMF Direction of Trade Statistics, BIS and ECB calculations.
Notes: Cross-country averages of individual observations of a sample of countries neighbouring the euro area which were not inaugural members of the euro area in 1999 (Bulgaria, Czech Republic, Estonia, Croatia, Hungary, Lithuania, Latvia, North Macedonia, Norway, Poland, Romania and Slovakia). The latest observation is for 2020.
Both recent and earlier theoretical models underline the importance of network effects. Network effects include bilateral trade links between countries in the form of input-output linkages and value chains, strategic complementarities in price setting among competitors and suppliers and economies of scope in alternative uses of a currency, all of which link the invoicing currency choices of different firms, both within and across countries. The resulting cross-country effects suggest that a switch in international invoicing currency that overcomes lock-in and inertia forces is a joint – rather than a unilateral – phenomenon affecting multiple countries.
Recent research by ECB staff takes these hypotheses to the data.[14] The study shows how theory maps itself into a network which links invoicing currency choices across countries. It uses a panel vector autoregression (or panel VAR) model that analyses invoicing currency choices, exchange rate volatility and trade developments jointly in a sample of 13 countries neighbouring the euro area between 1999 and 2019.[15] This framework allows various cross-country effects emphasised in theory to be explicitly modelled, and network effects to be accounted for – for example, the fact that countries’ invoicing currency choices are not just impacted by their own trade patterns and exchange rate volatilities but also by those of their trade partners and competitors, those of the trade partners and competitors of the latter. Moreover, the model investigates the dynamics underlying invoicing currency choices rather than merely static determinants. This is relevant in view of the significant heterogeneity in the timing, speed and extent of increases in euro invoicing across countries of the sample.[16] A trade shock and an exchange rate volatility shock can be identified within the model using sign restrictions on impact. Identification is achieved by limiting cross-country effects to those emphasised in the theory[17] and using a well-known puzzle in the international finance literature: the exchange rate disconnect. This refers to the lack of short-run correlation between the exchange rate and other macroeconomic fundamentals. Therefore, the identification assumption is that exchange rate volatilities are not impacted by contemporaneous trade developments.[18]
3 New empirical evidence
The model estimates provide significant evidence in support of the trade shock hypothesis. Estimated impulse responses to a trade shock suggest that stronger trade with the euro area relative to trade with the United States leads to a significant and persistent increase in euro invoicing. By contrast, the impact of an exchange rate volatility shock (i.e. greater exchange rate stability against the euro) is found to be statistically insignificant. Importantly, the effect of the trade shock is economically relevant – in countries where trade links with the euro area increased, the shock accounts for almost 40% of the rise in the share of exports invoiced in euro between 1999 and 2019 on average.
Chart B.4
Model estimates point to trade shocks as important drivers of increases in euro invoicing
Historical decomposition of the share of export invoicing across countries
(percentage points)

Source: Mehl, Mlikota and Van Robays, “How does a dominant currency replace another? Evidence from European trade”, CEPR Discussion Paper, forthcoming.
Notes: For each country, the green dot indicates the actual increase in the share of the euro as an invoicing currency for exports between 2000 and 2019. The red (yellow) bars indicate the estimated contribution of the trade (exchange rate volatility) shock, while the blue bar is the residual. The residual component encapsulates other important determinants of invoicing currency choice that are not explicitly modelled, such as changes to the economic fundamentals of the dominant currency issuer (e.g. higher inflation, geopolitical shocks or policy support).
However, the importance of the trade shock differs across countries. For some countries, such as Bulgaria, Latvia, Romania and Slovakia, between one-third to two-thirds of the increase in the share of the euro for export invoicing can be ascribed to stronger export orientation towards the euro area (see the red bars in Chart B.4). It is these countries that experienced the strongest increases in export shares to the euro area relative to the United States and, in turn, some of the largest increases in euro invoicing. Moreover, there is evidence that cross-country effects are relevant. For instance, in countries where the share of the euro area in total exports remained more stable, such as Estonia, stronger trade links between the euro area and the trade partners of the countries in question resulted in a slight rise in the share of the euro for export invoicing. Finally, in countries such as Croatia, Slovenia and Türkiye – where the share of the euro area in total exports declined to the benefit of the United States – model estimates pick up the fact that weaker trade linkages discouraged the use of the euro for export invoicing. However, residual factors more than offset these effects, thereby leading to an increase in euro invoicing even in these economies.[19]
Chart B.5
Cross-country effects operate mainly via bilateral trade linkages, such as input-output linkages
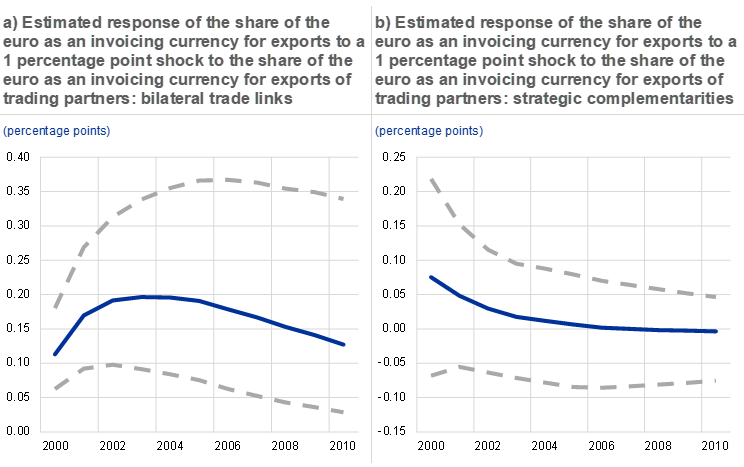
Source: Mehl, Mlikota and Van Robays, “How does a dominant currency replace another? Evidence from European trade”, CEPR Discussion Paper, forthcoming.
Notes: Panel a shows the part that relates to bilateral trade links – measured as the estimated effect of increases in the share of the euro as an invoicing currency for foreign exports on the share of the euro as an invoicing currency for domestic imports. Panel b shows the part that relates to strategic complementarities – measured as the estimated effect of changes in the share of the euro as an invoicing currency for foreign exports on the share of the euro as an invoicing currency for domestic exports.
Further estimates suggest that cross-country linkages are relevant determinants of changes in invoicing currency patterns. Impulse response estimates suggest that a one standard deviation shock to the share of the euro area in total trade of countries neighbouring the euro area increases the share of the euro as an invoicing currency for domestic exports by about 1 percentage point. The effect takes time to unfold but is significant, persistent and economically meaningful in magnitude. Other estimates further suggest that such cross-country effects operate mainly via bilateral trade linkages, including input-output linkages, that is, the use of imported goods in export goods production, rather than strategic complementarities in price setting – the fact that firms coordinate on a particular invoicing currency to align their price with the prices of suppliers and competitors. Chart B.5 provides evidence of the strength of these two channels. It shows the effect of a joint 1 percentage point increase in the share of the euro as an invoicing currency for foreign exports on the share of the euro as an invoicing currency for domestic exports. Chart B.5, panel a shows the part that relates to bilateral trade links – measured as the estimated effect of increases in the share of the euro as an invoicing currency in the exports of a country’s trading partners on the share of the euro as an invoicing currency for domestic imports, which, in turn, affects domestic exports. Chart B.5, panel b shows the part that relates to strategic complementarities – measured as the estimated effect of changes in the share of the euro as an invoicing currency for foreign exports on the share of the euro as an invoicing currency for domestic exports. The estimates underscore the relevance of bilateral trade linkages, which translate into a significant and persistently higher share of the euro as an invoicing currency for domestic exports. By contrast, the estimates for strategic complementarities are statistically insignificant.
4 Concluding remarks
New evidence on the importance of trade shocks for currency invoicing has important implications for policy. It suggests that in response to the pandemic and the war in Ukraine, the reshoring or friendshoring of production chains could lead to stronger regional trade, notably on the European continent. That, in turn, could strengthen the future role of the euro for export invoicing and its importance for the international transmission of shocks and the pass-through of global exchange rate movements, with the caveat that such a reversal in global economic integration would bring other economic costs.
See, for example, Krugman, P. (1980), “Vehicle currencies and the structure of international exchange”, Journal of Money, Credit and Banking, Vol. 12, No 3, pp. 513-526; Krugman, P. (1984), “The international role of the dollar: theory and prospects” in Exchange Rate Theory and Practice, edited by Bilson, J. and Marston, R. (Chicago: University of Chicago Press); Matsuyama, K., Kiyotaki, N. and Matsui, A. (1993), “Toward a theory of international currency”, Review of Economic Studies, Vol. 60, No 2, pp. 283-307; Zhou, R. (1997), “Currency exchange in a random search model”, Review of Economic Studies, Vol. 64, No 2, pp. 289-310; Rey, H. (2001), “International trade and currency exchange”, Review of Economic Studies, Vol. 68, No 2, pp. 443-464.
For an overview see Eichengreen, B., Mehl, A. and Chiţu, L. (2017), How global currencies work: past, present, and future, Princeton University Press.
See Eichengreen, B. and Flandreau, M. (2009), “The rise and fall of the dollar (or when did the dollar replace sterling as the leading reserve currency?)”, European Review of Economic History, Vol. 13, No 3, pp. 377-411.
See Eichengreen, B. and Flandreau, M. (2012), “The Federal Reserve, the Bank of England, and the rise of the dollar as an international currency, 1914-39”, Open Economies Review, Vol. 23, No 1, pp. 57-87.
See Chiţu, L., Eichengreen, B. and Mehl, A. (2014), “When did the dollar overtake sterling as the leading international currency? Evidence from the bond markets”, Journal of Development Economics, Vol. 111, Issue C, pp. 225-245.
On the euro see Chinn, M. and Frankel, J. (2007) “Will the euro eventually surpass the dollar as leading international reserve currency?” in G7 Current Account Imbalances: Sustainability and Adjustment (Chicago: University of Chicago Press); on the renminbi see Subramanian, A. (2011), “Renminbi rules: the conditional imminence of the reserve currency transition”, Peterson Institute for International Economics Working Paper, No 11-14.
See Maggiori, M., Neiman, B. and Schreger, J. (2019), “The rise of the dollar and fall of the euro as international currencies”, AEA Papers and Proceedings, Vol. 109, pp. 521-526; Ilzetzki, E., Reinhart, C. and Rogoff, K. (2019), “Exchange arrangements entering the twenty-first century: Which anchor will hold?”, Quarterly Journal of Economics, Vol. 134, No 2, pp. 599-646.
See Boz, E., Casas, C., Georgiadis, G., Gopinath, G., Le Mezo, H., Mehl, A. and Nguyen, T. (2022), “Patterns of invoicing currency in global trade: New evidence”, Journal of International Economics, Vol. 136, No 103604.
The shift out of dollars has been in two directions: one quarter into the Chinese renminbi and three quarters into the currencies of smaller countries that have played a more limited role as reserve currencies. See Arslanalp, S., Eichengreen, B. and Simpson-Bell, C. (2022), “The Stealth Erosion of Dollar Dominance and the Rise of Nontraditional Reserve Currencies”, Journal of International Economics, Vol. 138, No 103656.
Slovenia joined in 2007, Slovakia in 2009, Estonia in 2011, Latvia in 2014, Lithuania in 2015 and Croatia in 2023, in other words, several years after the share of the euro had increased. Moreover, invoicing in legacy currencies of the countries in question was limited before the adoption of the euro, while invoicing in major global currencies was widespread.
This hypothesis is developed by Gopinath, G. and Stein, J.C. (2021), “Banking, trade, and the making of a dominant currency”, Quarterly Journal of Economics, Vol. 136, No 2, pp. 783-830.
This is the hypothesis developed in Mukhin, D. (2022), “An equilibrium model of the international price system”, American Economic Review, Vol. 112, No 2, pp. 650-688.
The model put forward by Mukhin contains several other determinants, including trade-size shocks as discussed by Gopinath and Stein. However, the author’s counterfactual simulations suggest that the abandonment of US dollar pegs is required for the US currency to lose its dominant currency role in trade invoicing.
See Mehl, A., Mlikota, M. and Van Robays, I., “How does a dominant currency replace another? Evidence from European trade”, CEPR Discussion Paper, forthcoming. The sample includes the same countries as those shown in Chart B.1 and Chart B.2.
Euro (or euro area) variables in the model are defined relative to the US dollar (or United States) to analyse the determinants of the switch of the use of the euro for trade invoicing at the cost of the US dollar. The results are robust to only considering euro (or euro area) variables.
The euro either strengthened its lead (Croatia, Czech Republic, Hungary), caught up (Norway) or replaced the US dollar as the main invoicing unit (Bulgaria, Lithuania, Poland).
Specifically, to capture strategic complementarities in export price setting, the model allows a country’s share of exports invoiced in euro to depend on contemporaneous and lagged values of other countries’ exports invoiced in euro. Similarly, it allows exchange rate volatility of a given country to depend on exchange rate volatilities of other countries. By including country-specific data on exchange rate volatility and country-specific effects, different currency regimes are accounted for. Finally, the model captures bilateral trade links and input-output linkages by allowing a country’s share of imports invoiced in euro to depend on exports invoiced in euro of countries for which the country is the destination market. As stressed above, all variables are expressed in relative terms vis-à-vis the US dollar (United States).
See Obstfeld, M. and Rogoff, K. (2000), “The six major puzzles in international macroeconomics: is there a common cause?”, NBER Macroeconomics Annual, Vol. 15, pp. 339-390 and Itskhoki, O. and Mukhin, D. (2021), “Exchange rate disconnect in general equilibrium”, Journal of Political Economy, University of Chicago Press, Vol. 129, No 8, pp. 2183-2232.
Examples include changes to the economic fundamentals of the dominant currency issuer (e.g. much higher inflation in the United States, as discussed in Mukhin (2022)), geopolitical shocks (as discussed in Eichengreen, B., Mehl, A. and Chitu, L. (2019), “Mars or Mercury? The geopolitics of international currency choice”, Economic Policy, Vol. 34, No 98, pp. 315-363), or policy support (e.g. the availability of currency swap lines in the challenger currency, as discussed in Bahaj and Reis (2020)).