


Gauging the interplay between market liquidity and funding liquidity
Gauging the interplay between market liquidity and funding liquidity
Published as part of the Financial Stability Review, May 2023.
The ability of market participants to access funding and conduct transactions in an efficient way is a prerequisite for financial stability, providing shock-absorption capacity and, in turn, limiting the scope for shock amplification. Market liquidity and funding liquidity are inherently connected. When market liquidity evaporates, financial market pricing becomes less reliable and tends to overreact, leading to increased market volatility and higher funding costs. Funding liquidity enables market participants to take exposures onto their balance sheets, thus absorbing fluctuations in demand and supply in the name of efficient market functioning. Under extreme conditions, markets can stop functioning altogether. While liquidity has many dimensions, from a systemic perspective the interplay between market liquidity and funding liquidity[1] is key, as these two dimensions can reinforce each other in ways that generate liquidity spirals. Cyclical factors such as the business cycle, systemic leverage, as well as monetary and fiscal policy affect the probability of liquidity stress arising. In the light of the current challenges of high financial market volatility, increased risk of recession, bouts of heightened risk aversion and monetary policy normalisation, this special feature constructs composite indicators for market liquidity and funding liquidity. It also attempts to identify what can cause poor market liquidity and funding liquidity conditions and to show how the two dimensions interact in the euro area.
1 Introduction
Concerns have recently been increasing over the resilience of liquidity. For much of the last decade, volatility in bond markets has been low (Chart A.1, panel a) and holdings of high-quality liquid assets (HQLAs) in the banking sector have been large (Chart A.1, panel b). Recently, though, these tailwinds have started to change direction. Despite a regime of continuing high excess reserves, liquidity conditions have become more fragile and, at times, unreliable. Moreover, a constellation of a subdued free float of high-quality debt securities and globally high inflation, which has introduced uncertainty as to the future path of monetary policy, has greatly increased volatility in bond markets.
Financial system liquidity has a market component and a funding component, both of which have structural and cyclical drivers. In theory, market liquidity (the ability to rapidly execute sizeable securities transactions at a low cost and with a limited price impact) can be distinguished from funding liquidity (the ease with which financial intermediaries can borrow). In practice, these two types of liquidity constitute financial system liquidity and can interact and – on occasion – reinforce one another in generating liquidity spirals. These components can be influenced by structural trends such as market-making practices, issue size, trade transparency and investor landscape.[2] The dimensions of liquidity can also be strongly influenced by cyclical determinants which underpin shifts in liquidity regimes. Such cyclical determinants[3], including investor risk appetite, macroeconomic conditions and global monetary policy cycles, have started to turn. This has given rise to concerns over a shift towards a regime of less system liquidity and more fragile liquidity.
This special feature develops composite indicators of market liquidity and funding liquidity and assesses how they interact. It introduces concepts pertinent to both market and funding liquidity. It then presents a suite of indicators that sheds light on the evolution of both concepts for the euro area in recent years, investigating the main drivers behind them and examining how the two dimensions interact.
Chart A.1
Cyclical market and funding liquidity factors turn more restrictive as policy normalises
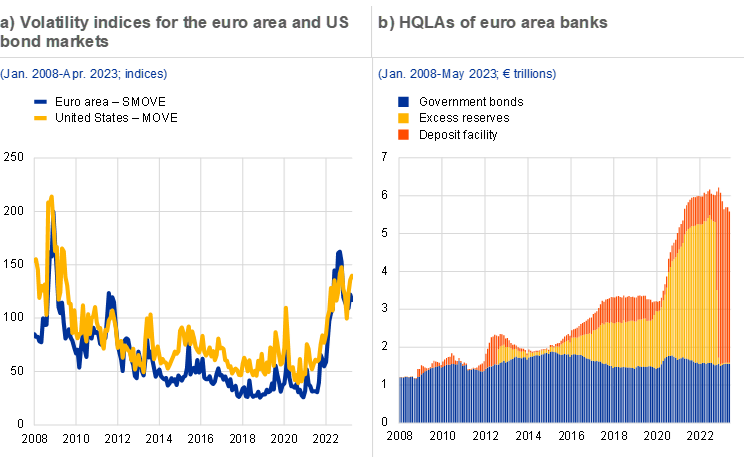
Sources: ECB and Bloomberg Finance L.P.
Notes: Panel a: SMOVE is the Merrill Lynch 1M EUR Swaption Volatility Estimate index; MOVE is the Merrill Lynch 1M UST Option Volatility Estimate Index.
2 Why market and funding liquidity matter and how they interact
When liquid, financial markets provide efficient, reliable pricing of financial assets, and funding can be easily obtained at a fair price. Liquidity consists of two main pillars: market liquidity and funding liquidity. Market liquidity may be defined as the ability to rapidly execute large transactions at a low cost and with a limited price impact. Funding liquidity indicates the ease of borrowing conditions and capital flows in global financial markets. Focussing on the specific dimensions of market liquidity and funding liquidity, and distinguishing between them, can provide clarity on how their interaction can create adverse liquidity spirals which harbour the potential for systemic stress.
Market liquidity has several dimensions which are closely, but not solely, related to trading conditions in financial markets. These dimensions include immediacy (the pace of trade execution), breadth and depth (the scope and size of transactions), and tightness (the cost and price impact). From a financial stability perspective, it is also important to consider the resilience of market liquidity, which is the ability of market-makers to continue to provide market-making services during periods of market stress (Chart A.1).[4]
Figure A.1
Dimensions of market liquidity and funding liquidity

Source: ECB.
However, market liquidity is not directly observable, and there is no single indicator that can comprehensively capture its multiple dimensions. Individual indicators are also hampered by conceptual issues. Tight bid-ask spreads, which are often used to show abundant market liquidity, may conceal the fact that there is little volume available at the best quotes. Data on liquidity indicators, especially for the corporate bond market, are often sparse, as bond trading is still fragmented given the prevalence of over-the-counter trading and waivers from pre-trade and post-trade transparency rules. In addition, any assessment is complicated by data quality issues, such as differences across commercial databases, a lack of consolidated tape providers[5] and gaps in available data for less-regulated non-bank financial intermediaries and principal trading firms.[6] Finally, the gradual automation of trading, including the use of high-frequency trading, might, in some cases, undermine the robustness of individual liquidity measures. Limited access to data on algorithmic trading makes it challenging to make a proper assessment of its impact on market liquidity and its resilience.
Funding liquidity focuses on the ease of obtaining deposits and borrowing conditions in capital markets, which also affects the overall cost of funding. If funding is abundant, investors can obtain cheap funding, while financing is more expensive if funding liquidity is shallow. Funding liquidity risk can take different forms, depending on the type of funding. These risks are rollover risk, redemption risk and haircut/margining risk (Figure A.1). If a bank relies to a large extent on short-term funding (e.g. via repos), it runs the risk that it might be unable to replace or roll over maturing short-term funding or that it might only be able to do so at significantly higher cost. Redemption risk captures the risk, in the case of a bank, of depositors withdrawing their funds. Lastly, haircut or margining risk surfaces if a financial intermediary is funded via a secured loan (e.g. a repo transaction or margin loan) and the haircut or margin applied to the collateral increases. In any of these cases, the financial firm might be forced to exit positions or liquidate assets.[7]
Even in a regime with ample reserves, funding liquidity might become impaired, notably for weaker banks. Central bank asset purchase programmes over the past decade – including in the euro area – have contributed to a rapid increase in excess liquidity in the financial system (Chart A.1, panel b). However, the normalisation of monetary policy that began in 2022, including ongoing quantitative tightening (QT), could change these dynamics, along with the risks to financial stability. Disruptions in funding markets are closely related to the short-term availability of liquidity. Two effects are seen to have a negative impact on the short-term availability of reserves. First, reserves might be encumbered because banks have sold liquidity guarantees in the form of contingent credit lines which can be called during times of liquidity stress.[8] Second, reserves might be encumbered in order to maintain liquidity coverage ratios in times of stress (reserve hoarding by well-capitalised banks), making them unavailable for interbank lending to liquidity-stressed banks. [9] As such, high levels of aggregate excess reserves might hide vulnerabilities at weaker individual banks. Banks might therefore find that initially issued bank-held reserves are not available during periods of stress, implying that changes in the level of reserves might be equally important.[10]
Since the global financial crisis, changes in the behaviour of financial sector participants and regulatory reforms have had implications for both funding and market liquidity. First, in money markets, banks have shifted from unsecured to secured transactions, often cleared by central counterparties. The secured segment became the largest segment of the euro area money market around the time of the global financial crisis and has continued to grow ever since, increasing systemic liquidity needs in the form of cash and collateral to secure lending.[11] Moreover, the widespread increase in collateralised transactions has magnified the sensitivity of liquid-asset demand to market volatility. If market participants are ill-prepared for rapidly rising margin calls, their short-term liquidity needs to fund such margin calls could squeeze liquidity in already stressed markets, further amplifying shocks. For this reason, collateralised funding, while greatly reducing counterparty credit risk, may also increase systemic liquidity risk. Second, banks changed their business models as they deleveraged, increased their regulatory capital and liquidity buffers, and shrank their inventories. While these developments enhanced banks’ resilience, they may also have made banks’ market-making services more restrictive and led non-bank financial institutions to take on a more prominent role in market-making. Restrictions on proprietary trading and regulations requiring banks to increase associated capital buffers may also have led them to retreat from trading and market-making activities. Moreover, a continued shift towards electronic trading platforms and the growing use of automated trading may have made market liquidity conditions less predictable.
3 Assessing euro area funding and market liquidity conditions
Combining different market liquidity indicators could help to capture different dimensions and shed light on drivers. The analysis below uses a suite of 21 indicators of liquidity in sovereign bond markets, representing all five dimensions of market liquidity. These indicators range from standard measures, such as the bid-ask spread, traded volume and dealer inventories, to less commonly used indicators such as the share of non-quoted securities, and are based on a variety of data sources. To make the indicators comparable, they are standardised by transforming them into z-scores based on their historical distribution. Afterwards, individual indicators are first aggregated into five sub-indicators and then translated into a composite indicator. This makes it possible to track developments in market liquidity over time, and to identify broader trends and understand their underlying drivers.
Market liquidity has deteriorated as volatility has increased in an environment of high uncertainty over the path of future monetary policy. Market liquidity conditions in the euro area sovereign bond market have deteriorated below the sample average since mid-2022 across many dimensions (Chart A.2, panel a). The composite indicator has declined to similar levels seen during the outbreak of the COVID-19 pandemic in 2020. At the same time, high sensitivity to macroeconomic surprises has been reflected in extremely high bond price volatility, as investors have adjusted their expectations of the pace of policy normalisation (Chart A.2, panel b). Looking at the various dimensions of liquidity that have driven the deterioration in the composite indicator, liquidity providers widened quoted spreads, thus undermining market tightness. Market-makers thereby compensated for potentially higher market risk stemming from large and rapid price moves that make it more challenging for them to keep their trading books matched. The biggest deterioration was, however, observed in market breadth, as bid-ask spread dispersion increased substantially. Such dynamics might be partly explained by the different sensitivities in the credit risk of individual issuers to higher risk-free rates. For bonds issued by more-indebted sovereigns, bid-ask spreads might have increased more because of a lower level of willingness or capacity to hold them among dealers. The ECB’s withdrawal from asset purchase programmes further challenged the ability of market-makers to limit risk, should they find themselves with outsized exposures relative to risk-bearing capacity. Their willingness to provide quotes to other market participants might thus have been reduced. As a result, around the end of 2022 the average number of market-makers active in the euro area bond market dropped to the lowest levels on record.
Chart A.2
Euro area market liquidity has declined since last year as uncertainty over rates has fed into higher bond price volatility
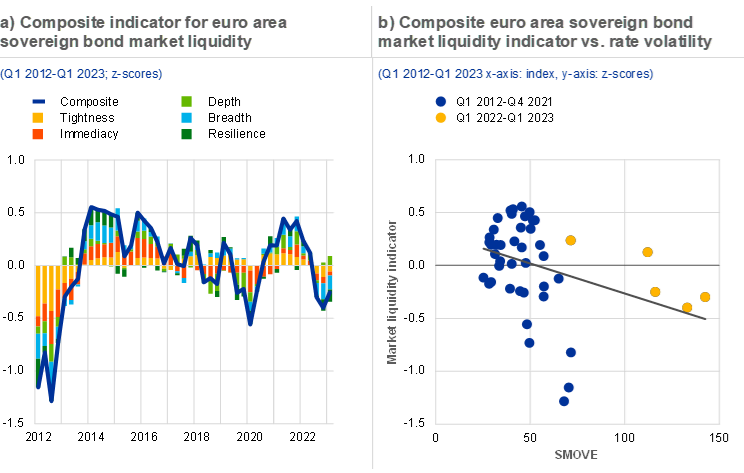
Sources: Bloomberg Finance L.P., Euro MTS Ltd, MarketAxess, Refinitiv, ECB and ECB calculations.
Notes: Panel a: composite liquidity indicator based on number of market-makers, share of non-quoted or non-traded securities, transaction frequency, trade size, dealer inventory, quote slope, quoted volume, traded volume, turnover ratio, Amihud ratio, effective spread, spread dispersion, volume concentration, market efficiency coefficient and Bloomberg Liquidity Index. Panel b: the chart shows the OLS fit between the SMOVE and the composite indicator for euro area sovereign bond market liquidity between Q1 2012 and Q1 2023. SMOVE is the Merrill Lynch 1M EUR Swaption Volatility Estimate Index.
By comparison, a composite indicator for euro area funding liquidity captures rollover risk, redemption risk and margining risk. A set of 28 indicators covering various characteristics of funding liquidity for euro area banks are monitored along the dimensions of rollover risk, redemption risk and haircut/margining risk (Chart A.3, panel a). The indicators aim to capture reliance on short-term funding and repo markets and the ability to obtain funding from the central bank. For example, (short-term) wholesale funding indicators capture rollover risk, indicators on deposit rates and volumes capture redemption risk, and asset encumbrance indicators capture haircut/margining risk.[12],[13]
Chart A.3
Funding liquidity for euro area banks deteriorated as redemption and haircut risks linked to monetary policy normalisation rose

Sources: ECB, Bloomberg Finance L.P. and Refinitiv.
Notes: Panel a: composite liquidity indicator based on, for rollover risk: deposit flows agreed maturity, overnight and term deposit rates to households and non-financial corporations, non-deposit funding as a share of total funding, yields on covered, senior bail-inable and senior unsecured debt, short rates for secured MMSR transactions, €STR market depth, interbank repo volumes, the EURIBOR-OIS spread, position in the monetary corridor (floor versus corridor) and euro-dollar cross-currency basis; for redemption risk: deposit growth rates for households, non-financial corporations and non-monetary financial institutions, the euro short-term rate minus agreed deposit rate for households and non-financial corporations and the liquidity coverage ratio; for haircut/margining risk: asset encumbrance ratio, collateral reuse ratio, market funding encumbrance ratio, share of covered bonds in total bond issuance volume and Schatz volatility. The indicators are first aggregated for deposit rates, yields and deposit growth, then taken as a simple average over all indicators to construct the composite indicator. Panel b: the chart shows the OLS fit between the change in the composite funding liquidity indicator and the change in bank HQLAs between Q1 2016 and Q4 2022.
Funding liquidity indicators have deteriorated since the start of 2022, consistent with cyclical factors such as greater redemption and margining risks. Redemption risk has increased amid lower deposit growth rates and weaker competitiveness of deposits compared with money market rates. The indicators for haircut and margining risk also increased due to higher volatility in government bond markets and higher asset encumbrance ratios, but then eased somewhat at the end of 2022 as volatility normalised and central bank-related asset encumbrance declined (Chart A.3, panel a). High asset encumbrance ratios during 2022 were mainly driven by two factors. First, a high level of central bank lending increased the amount of collateral encumbered at the central bank. Second, banks continued to make extensive use of secured funding markets to maintain liquidity buffers against a backdrop of heightened economic uncertainty. Rollover risk is considered somewhat lower because the increase in deposit rates has remained contained so far and (interbank) money markets are functioning in an orderly manner. At the same time, bank bond yields have increased, reflecting rising policy rates, resulting in higher market funding costs. In recent years, accommodative monetary policy and central bank asset purchases that increase reserves have supported funding liquidity conditions, but liquidity conditions have weakened as these reserves have been removed from the system funding (Chart A.3, panel b).
4 Risk of market and funding liquidity spirals
Market liquidity and funding liquidity are interrelated and can reinforce each other, potentially creating liquidity spirals. The extent to which dealers can make markets and provide liquidity depends on their ability to take exposures onto their own balance sheets, absorbing fluctuations in demand and supply. To finance these activities, dealers borrow in repo markets using the bonds purchased as collateral. In this way, market and funding are inherently connected.[14] A funding liquidity shock, such as an increase in margins and haircuts, could therefore limit dealers’ capacity to take own positions, thereby hampering their ability to provide liquidity and, ultimately, worsening overall market liquidity conditions. Deteriorating market liquidity conditions can, in turn, negatively affect funding liquidity. As poor market liquidity conditions exacerbate price volatility, they can also lead to an increase in margins and haircuts, which again worsens overall funding liquidity conditions. Ultimately, such liquidity spirals can become self-fulfilling (Figure A.2).
Figure A.2
Overview of a systemic funding illiquidity event

Source: ECB.
Since early 2022, market liquidity and funding liquidity have declined simultaneously as volatility has risen. Historically, the indicators for market liquidity and funding liquidity have not always moved in the same direction. At the start of the COVID-19 pandemic in 2020, for example, market liquidity conditions deteriorated significantly, while policy support measures kept bank funding conditions favourable (Chart A.4). Beginning in mid-2022, however, market liquidity and funding liquidity deteriorated simultaneously as policy started to normalise and economic uncertainty remained highly elevated. Market liquidity indicators returned to levels observed during the pandemic. By contrast, it was only during the most recent observation period that funding liquidity deteriorated to record lows, as it had been supported by central bank liquidity during the pandemic. Lower funding liquidity largely reflects the environment of higher interest rates, in which competition for deposits has increased and volatility in safe assets is high – contributing to rising margins and haircuts. At the same time, market functioning has remained orderly, keeping rollover risk contained.
Chart A.4
Market liquidity and funding liquidity show stronger co-movement lately, with a funding liquidity shock having more potential to disrupt market liquidity than vice versa
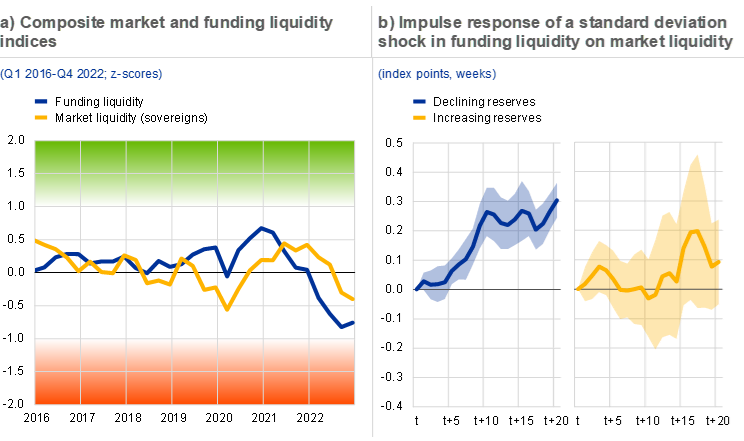
Sources: ECB, Eurostat, Bloomberg Finance L.P., Refinitiv and ECB calculations.
Notes: Panel a: for a description of the indicators, see the notes for Charts A.2 and A.3. Panel b: the chart shows impulse response functions with their respective 95% confidence bands for market liquidity – as proxied by the Bloomberg Liquidity Index for German sovereign bonds – after a shock in funding liquidity, as proxied by the EURIBOR-OIS spread. Higher values mean lower liquidity. The results are corrected for implied volatility (VSTOXX), log returns in the EURO STOXX Banks index and economic surprises (Citi Economic Surprise Index). Increasing and decreasing reserves are defined by changes in excess liquidity. Excess liquidity is defined as deposits at the deposit facility net of the recourse to the marginal lending facility. The impulse response functions were estimated using a non-linear local projection model* on weekly data between 1 January 2008 and 31 February 2023. The shaded areas represent 90% confidence intervals using Newey-West standard errors robust to heteroscedasticity and autocorrelation.
(*) See Jordà, Ò., “Estimation and Inference of Impulse Responses by Local Projections”, American Economic Review, Vol. 95, No 1, March 2005, pp. 161-182.
Funding liquidity conditions affect market liquidity conditions, while market liquidity appears to have a more limited impact on funding liquidity. An analysis of time series data shows that after a shock in bank funding conditions – measured as the EURIBOR-OIS spread – market liquidity conditions in sovereign bond markets deteriorate significantly.[15] This finding is in line with other studies and suggests that a funding shock affects the ability of banks to intermediate in bond markets, resulting in less-liquid market conditions.[16] Moreover, the opposite relationship does not appear to hold, meaning that, on aggregate, a shock in market liquidity does not necessarily translate into deteriorating funding conditions for banks. A local projections exercise shows that the finding is driven by periods in which excess liquidity is low or declining.[17] When excess liquidity is increasing, there are no significant spillovers from a shock in funding liquidity to market liquidity (Chart A.4, panel b, right graph). This highlights the difference between the current period of policy normalisation and the period of the pandemic, when bank funding liquidity was abundant due to fiscal and central bank support.
As central banks normalise their portfolios, reserves held in banks will gradually be replaced by the securities currently held by the Eurosystem, reversing the market impact of asset purchases. The reduction of central bank balance sheets (i.e. QT) might not mirror the impact of quantitative easing (QE), but it could affect funding conditions for banks in several ways. First, by making a positive contribution to financial stability, it could alleviate pressures on repo markets as the free float of HQLA securities increases; this would reduce the collateral scarcity that has accompanied central bank QE programmes and resulted in money market frictions in recent years.[18] Second, as QT might reverse the compression of risk premia,[19] valuations for some securities earmarked as HQLAs might become more volatile, potentially increasing rollover and margining risks in stressed liquidity regimes. Third, there has been substantial portfolio rebalancing in the euro area, with risk premia on bonds issued by lower-rated sovereigns and firms falling measurably.[20] QT might lead to a partial reversal of these effects via the “risk-taking channel” of monetary policy, increasing risk premia, potentially lowering collateral values and sparking a decline in risk appetite.
5 Conclusions
A substantial deterioration in market liquidity and funding liquidity has been evident since the start of 2022. So far, funding markets have functioned in a largely orderly manner, supported by cyclical factors such as large central bank balance sheets and the post-pandemic recovery. These cyclical factors may have reached a turning point, potentially exposing the underlying risks that have been masked by accommodative policy over the last decade. This mainly reflects changing cyclical factors such as heightened economic uncertainty, monetary policy normalisation and overall tighter financial conditions. It signals the heightened risk of a shift towards a stressed liquidity regime.
As global central banks normalise their portfolios, the portfolio rebalancing channel will slowly start to turn, potentially affecting funding conditions.[21] Reserves will be gradually replaced by the securities currently held by central banks, which potentially increases volatility and hence the demand for HQLAs in financial markets. Reduced central bank presence in the bond markets might further challenge market-makers’ willingness to provide liquidity as it decompresses risk premia.[22] Moreover, unlike central bank reserves, marketable safe and liquid assets are subject to valuation changes, which might affect funding conditions in a stressed liquidity regime.
This special feature suggests that some structural liquidity factors have so far remained supportive, and that the reserves held by banks to meet high liquidity coverage requirements remain at an elevated level. At the same time, the shift towards widespread collateralisation, while greatly reducing counterparty credit risks, has increased the sensitivity of liquid-asset demand to market volatility and has resulted in high asset encumbrance at banks. Moreover, banks’ desire to match the maturity of assets and liabilities after the period of QE has sparked an increase in central bank reserves. However, banks might not be able to adjust the maturity of their liabilities overnight once QT is under way and might face exposure to liquidity claims by non-banks and non-financial corporations.[23] As such, both market liquidity and funding liquidity conditions might be more fragile and flightier than the aggregate measures for liquidity suggest, and they therefore warrant continuous monitoring. At the same time, the euro area banking sector is resilient, with strong capital and liquidity positions, which helps to mitigate the potential risks that follow from deteriorating liquidity conditions.
Throughout this special feature, funding liquidity refers to funding liquidity for banks.
See “Market Liquidity – resilient or fleeting?”, Global Financial Stability Report, Chapter 2, International Monetary Fund, October 2015.
See Miranda-Agrippino, S. and Rey, H., “US monetary policy and the global financial cycle”, The Review of Economic Studies, Vol. 87, Issue 6, 2020, pp. 2754-2776.
See Sarr, A. and Lybek, T., “Measuring liquidity in financial markets”, IMF Working Papers, No 2002/232, International Monetary Fund, December 2002.
A consolidated tape provider is an entity authorised under MiFID II to provide the service of collecting trade reports for financial instruments and consolidating them into a continuous electronic live data stream providing price and volume data per financial instrument.
See “Liquidity in Core Government Bond Markets”, Financial Stability Board, October 2022.
Brunnermeier, M.K., “Deciphering the liquidity and credit crunch 2007-08”, Journal of Economic Perspectives, Vol. 23, No 1, 2009, pp. 77-100, and Drehmann, M. and Nikolaou, K., “Funding liquidity risk: Definition and measurement”, BIS Working Papers, No 316, Bank for International Settlements, July 2010.
A bank holding highly liquid reserves, with the reserves being required only in situations of liquidity stress, might want to “sell” liquidity wherever it is not needed, by offering contingent lines of credit, for instance.
The collateral value of an asset in market transactions might also be depressed, further limiting banks’ ability to borrow in the secured market. Furthermore, in crisis periods, elevated systemic risk might reduce the credit quality of otherwise safe banks, also limiting their ability to borrow in the unsecured market. Banks can use main refinancing operations and the marginal lending facility to obtain unlimited liquidity from the central bank against appropriate collateral.
See Acharya, V. and Rajan, R., “Liquidity, Liquidity Everywhere, Not a Drop to Use – Why Flooding Banks with Central Bank Reserves may not Expand Liquidity”, NBER Working Paper Series, No 29680, National Bureau of Economic Research, 2022.
See “Euro money market study 2022”, ECB, 2023.
Individual indicators are first aggregated into sub-indicators to reflect the three dimensions of funding liquidity and then translated into a composite indicator of funding liquidity for the banking sector.
Care should be taken when interpreting deposit redemptions, as in some countries they also reflected the pre-payment of (part of) mortgage debt.
Shin, H.S., “Market liquidity and bank capital”, speech at the ‘Perspectives 2016: Liquidity Policy and Practice’ conference, AQR Asset Management Institute, London Business School, 27 April 2016.
After the reforms of July 2019, the EURIBOR switched to a hybrid methodology to address robustness and representativeness concerns, which might impact the measure of funding liquidity after July 2019. However, the results of the analysis are unchanged if the period between July 2019 and February 2023 is excluded from the data.
See Khan, M.S., Scheule, H. and Wu, E., “Funding liquidity and bank risk taking”, Journal of Banking & Finance, Vol. 82, Issue C, 2017, pp. 203-216.
We define the regimes based on the changes in excess liquidity in the same way as Acharya et al., who argue that banks’ desire to match the maturity of assets and liabilities after QE has implied an increase in central bank reserves (see Acharya, V. and Rajan, R., “Liquidity, Liquidity Everywhere, Not a Drop to Use – Why Flooding Banks with Central Bank Reserves may not Expand Liquidity”, NBER Working Paper Series, No 29680, National Bureau of Economic Research, 2022). Banks might not, however, be able to increase the maturity of their liabilities once QT is under way.
See Arrata, W. et al., “The scarcity effect of QE on repo rates: Evidence from the euro area”, Journal of Financial Economics, Vol. 137, Issue 3, September 2020, pp. 837-856.
See Motto, R. and Özen, K., “Market-stabilization QE”, Working Paper Series, No 2640, ECB, February 2022.
See Albertazzi, U. et al., “Portfolio rebalancing and the transmission of large-scale asset purchase programs: Evidence from the Euro area”, Journal of Financial Intermediation, Vol. 48, October 2021.
See Krishnamurthy, A. and Vissing-Jorgensen, A., “The Effects of Quantitative Easing on Interest Rates: Channels and Implications for Policy”, Brookings Papers on Economic Activity, Brookings Institution Press, Fall 2011.
See Schnabel, I., “Quantitative tightening: rationale and market impact”, speech by Isabel Schnabel, Member of the Executive Board of the ECB, at the Money Market Contact Group meeting, 2 March 2023.
See Acharya, V. and Rajan, R., “Liquidity, Liquidity Everywhere, Not a Drop to Use – Why Flooding Banks with Central Bank Reserves may not Expand Liquidity”, NBER Working Paper Series, No 29680, National Bureau of Economic Research, 2022.